time.md
 codybontecou401 downloads
Navigate and visualize data exported from the time.md screen-time analytics app.
- Overview
- Scorecard
- Updates27
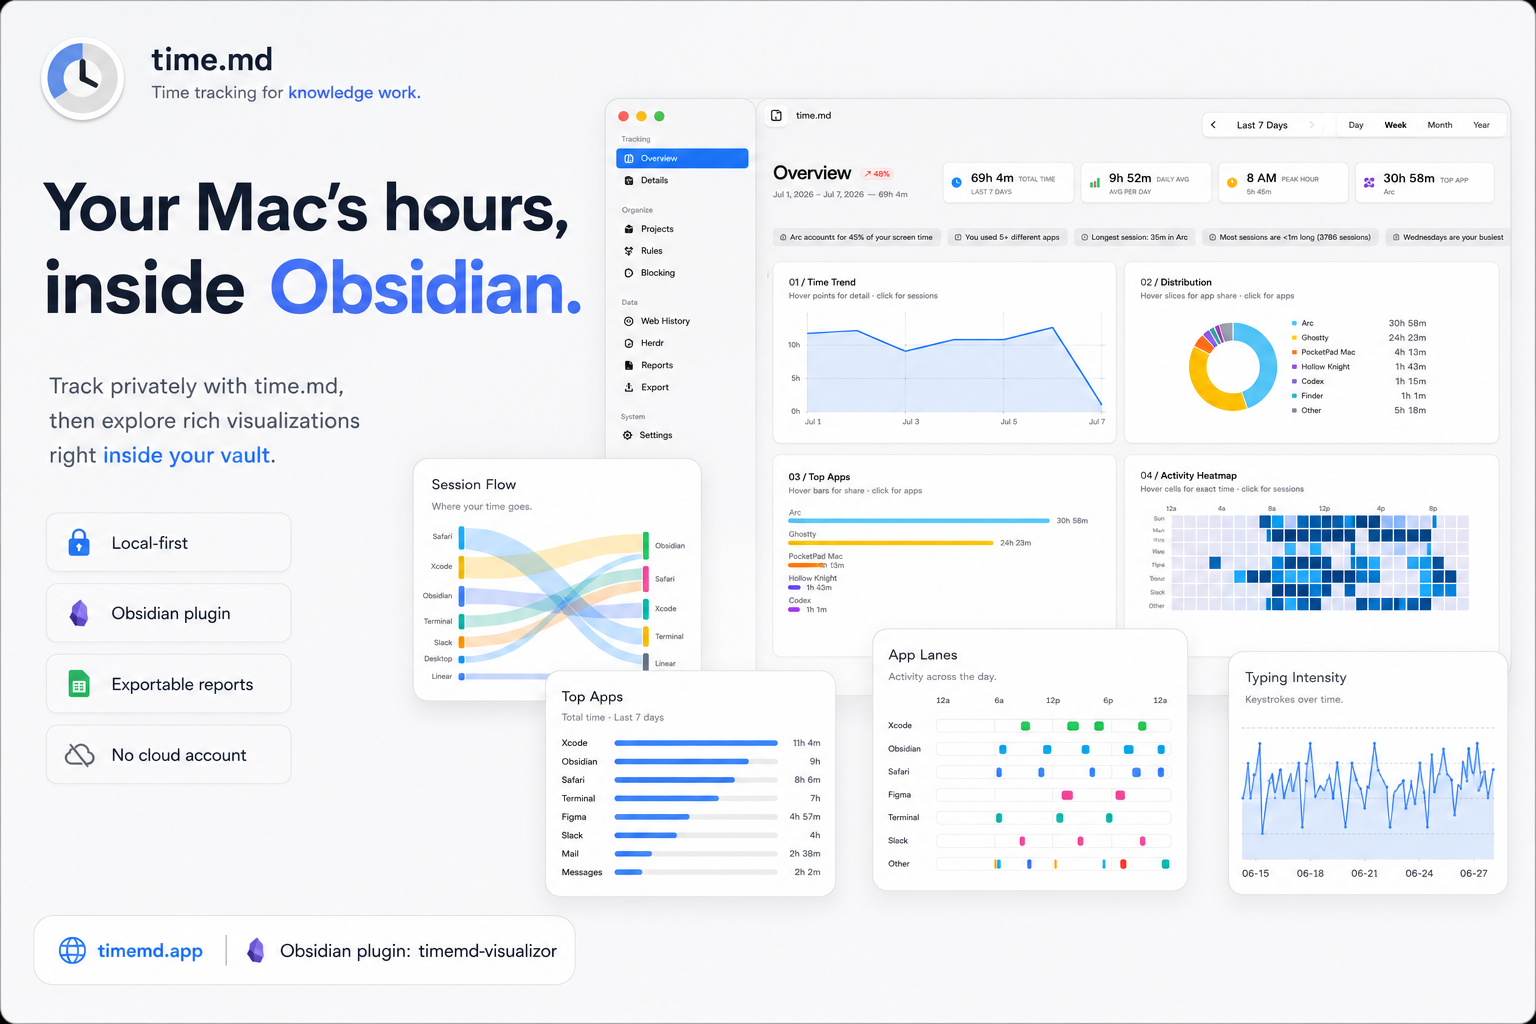
time.md navigates and visualizes data exported from the time.md screen-time analytics app, directly inside Obsidian.
Drop any time.md export into a folder in your vault and time.md recreates the core time.md experience — Overview, Trends, Calendar, Details, and Apps & Categories views — without needing to open the app.
Supported import formats
time.md auto-detects and parses every format time.md can export:
- JSON (
.json) — nested or flat - CSV (
.csv) — with or without metadata comments and section markers - YAML (
.yaml,.yml) — nested sections matching time.md's JSON export shape - Markdown (
.md) — GitHub-flavored tables with metadata header - Obsidian (
.md) — YAML frontmatter payloads used by Obsidian/Bases workflows
Views
| View | What it shows |
|---|---|
| Overview | Total, daily average, peak hour, longest session, trend, distribution donut, top apps, heatmap, and web-history overview |
| Trends | Range-aware daily/hourly defaults, stacked by-app chart (with Raw Sessions), hourly usage chart, app rhythm, focus-vs-fragmentation scatter, category balance, day archetypes, top apps by day, and daily breakdown |
| Calendar | Stats strip, GitHub-style daily contribution heatmap, 7×24 usage heatmap, date × hour heatmap (with Raw Sessions), intensity legend, and month grid |
| Details | Session stats, duration distribution, daily timeline, app lanes, session waterfall, context-switch intensity, attention-flow Sankey, and filterable raw-session table |
| Apps & Categories | Aggregated apps and categories with percentages |
| Projects | Category groups with donut distribution chart and stats |
| Web History | Browser history timeline, top domains, hourly activity |
| Reports | Daily / weekday breakdowns, period comparison, distribution charts, and CSV / JSON / Markdown export |
| Input Tracking | Cursor heatmap, typing intensity, top words / keys, per-app clicks (opt-in in time.md) |
Open any view from the command palette (time.md: Open Overview, etc.) or the ribbon icon.
Visualization gallery
The screenshots below are rendered from the plugin's live embed renderer against representative sample data. Every view: value can be used in a timemd code block.
Core screen-time visualizations
| Visualization | Embed view | What it shows | Screenshot |
|---|---|---|---|
| Overview dashboard | overview |
Stats, trend, weekly heatmap, and top apps in one dashboard. | 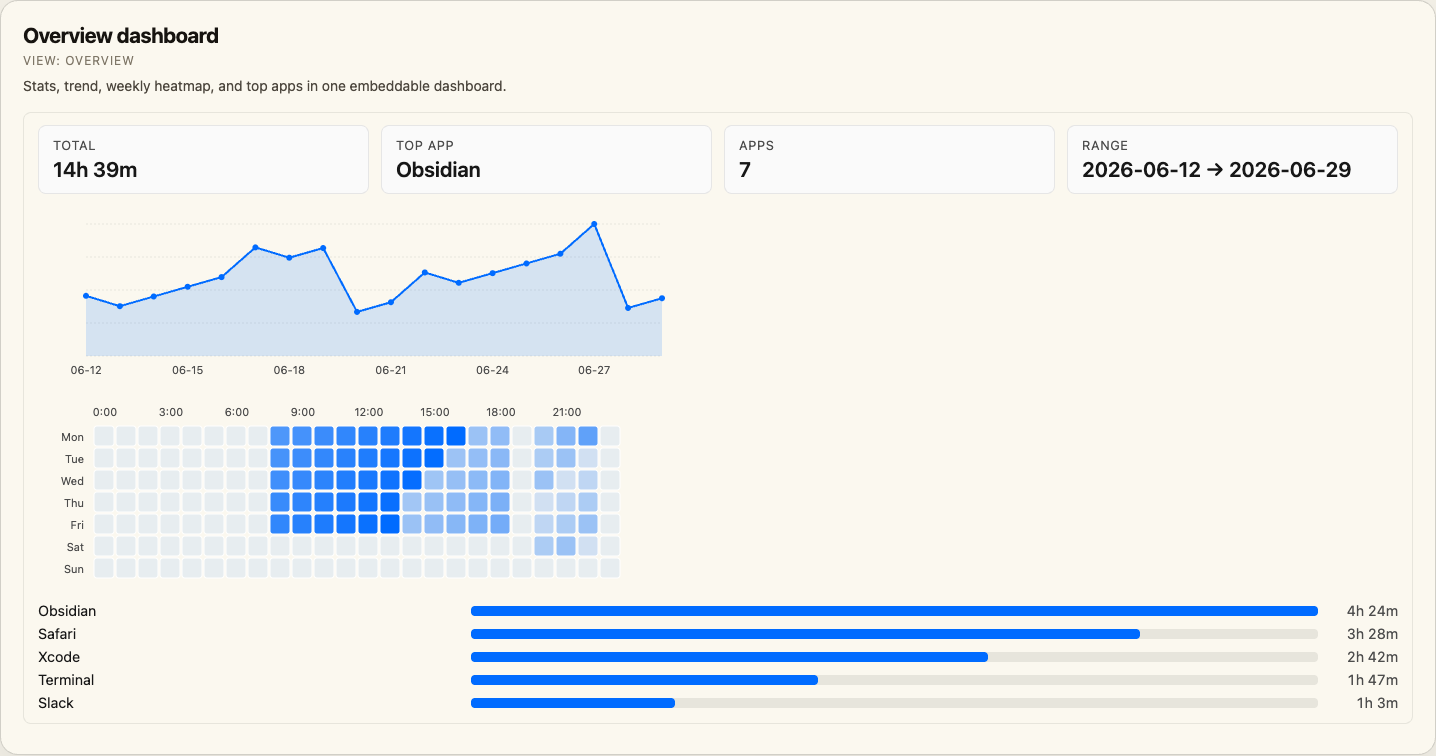 |
| Stat card | stat |
One focused metric such as total time, top app, app count, days, or peak day. | 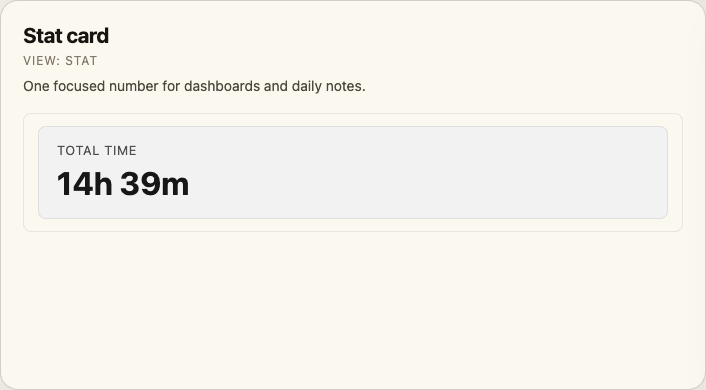 |
| Trend chart | trend-chart / trends |
Daily active time line chart. | 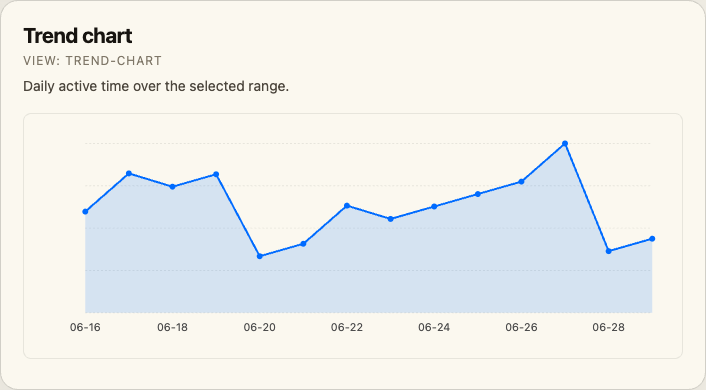 |
| Weekly heatmap | heatmap / calendar |
Weekday × hour activity intensity. | 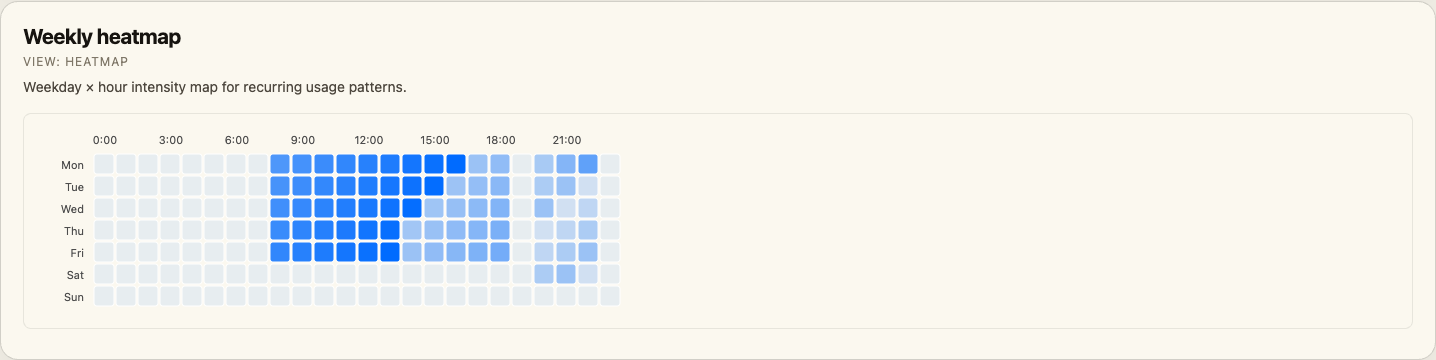 |
| Top apps | top-apps / apps |
Ranked app totals with proportional bars. | 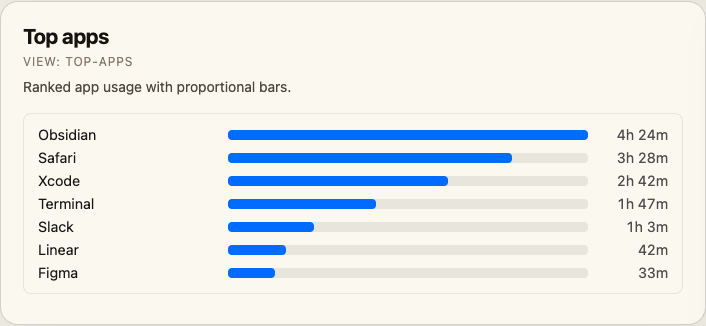 |
| Categories | categories |
Category totals and share of tracked time. | 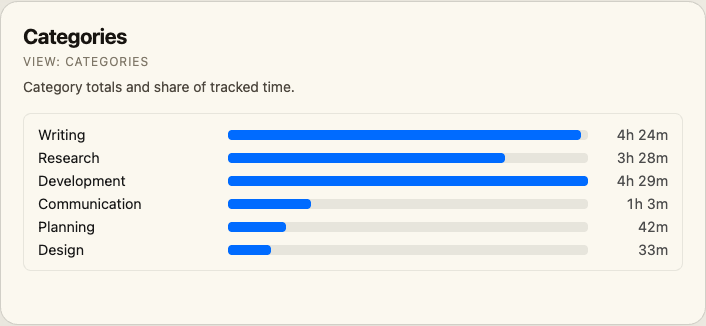 |
| Recent sessions | details |
Latest raw sessions with app, timestamp, and duration. | 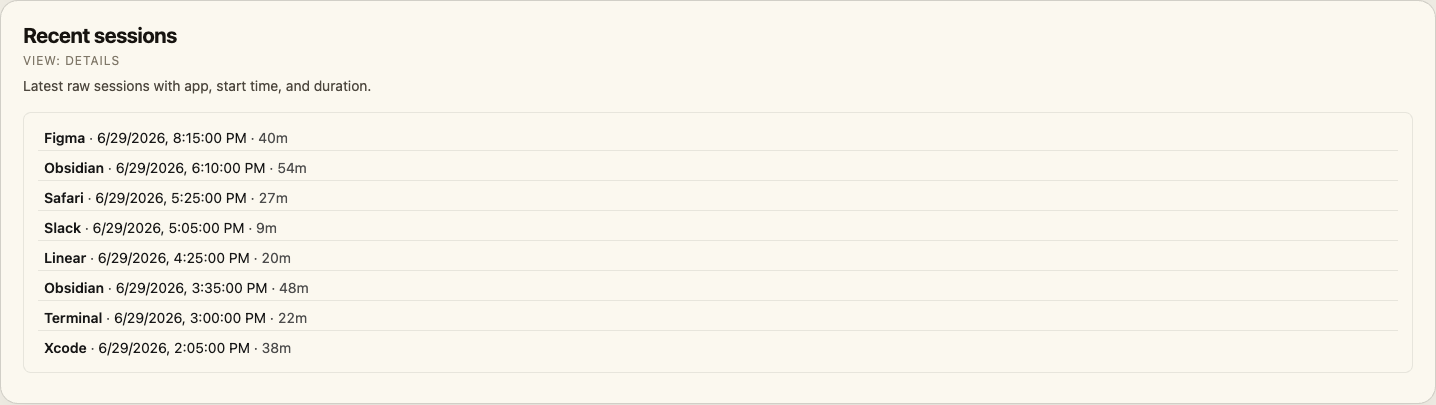 |
Attention, rhythm, and session analysis
| Visualization | Embed view | What it shows | Screenshot |
|---|---|---|---|
| Attention flow | transition-sankey |
Sankey diagram showing where focus moves between apps. | 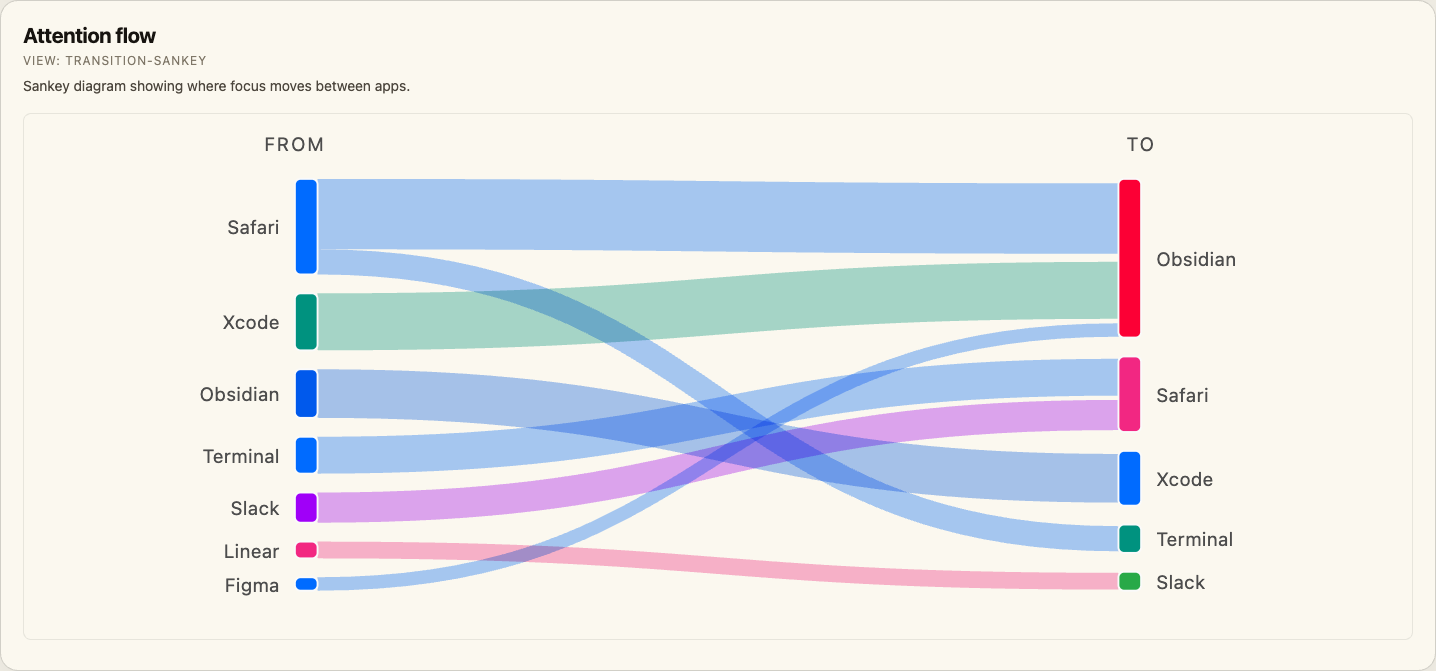 |
| App lanes | app-lanes |
Per-app timeline lanes for the latest day. | 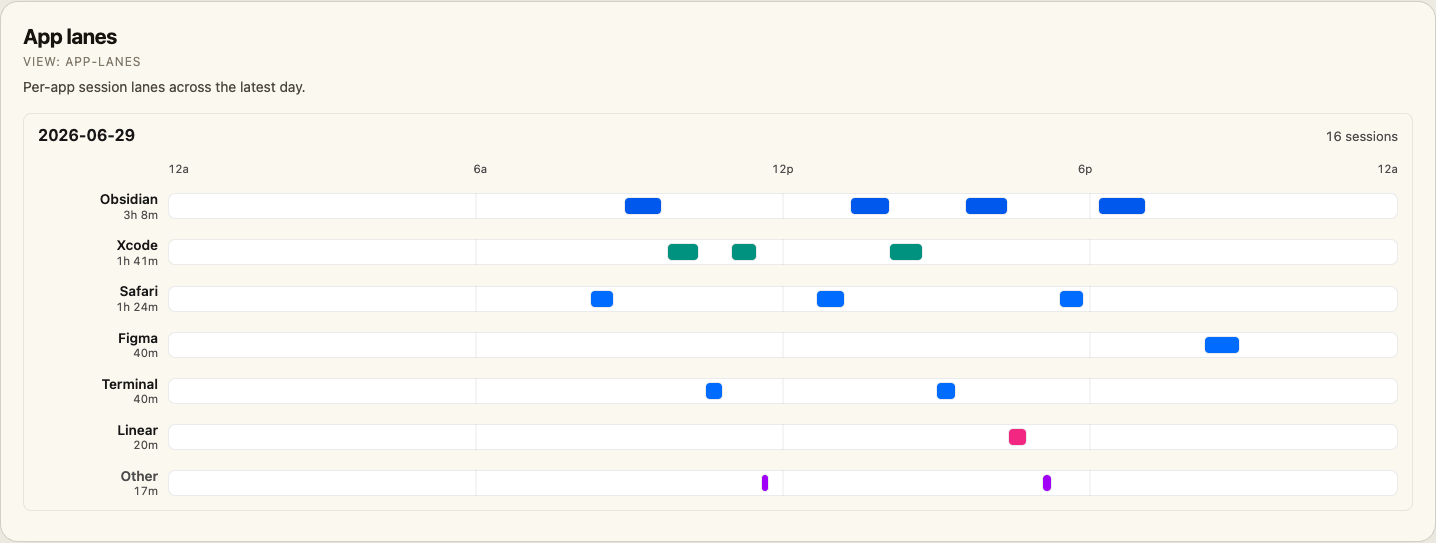 |
| Session waterfall | session-waterfall |
Chronological sessions with duration bars. | 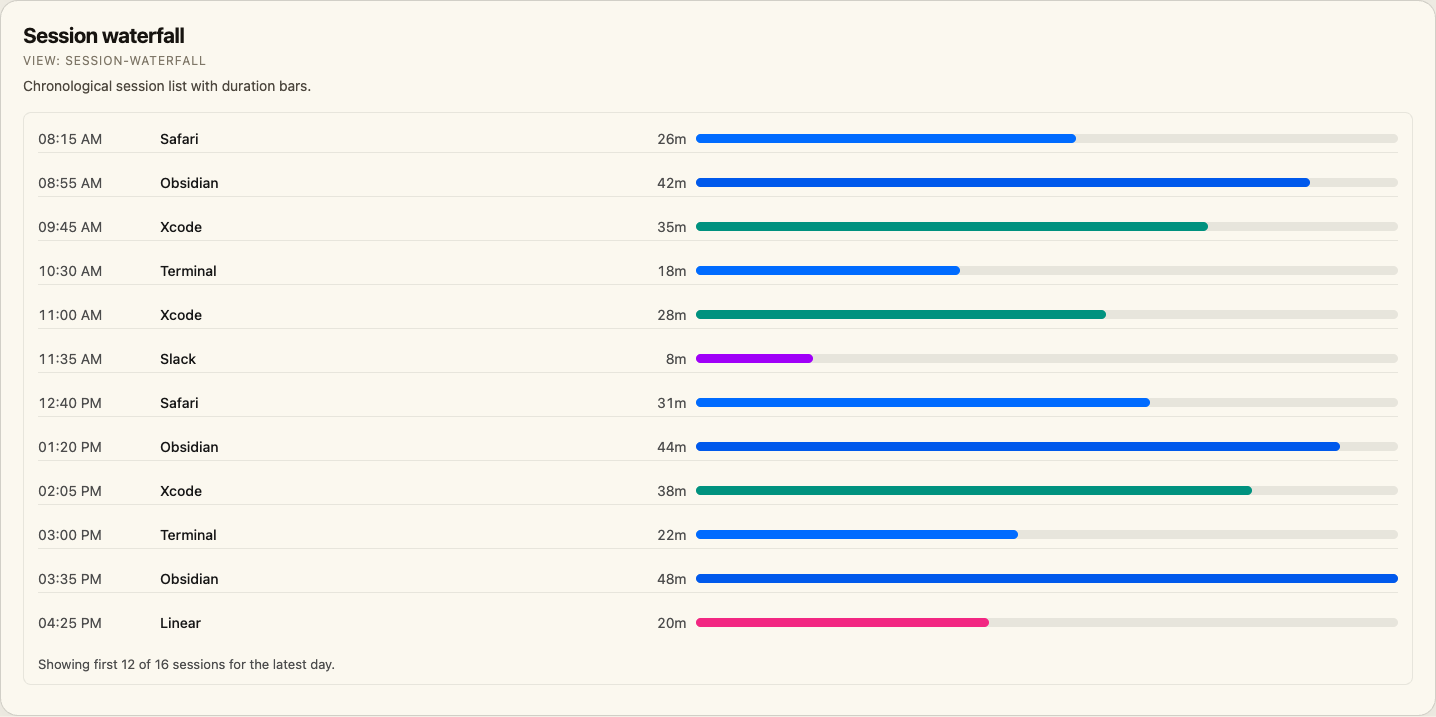 |
| App rhythm | app-rhythm |
App × hour heatmap for daily usage rhythms. | 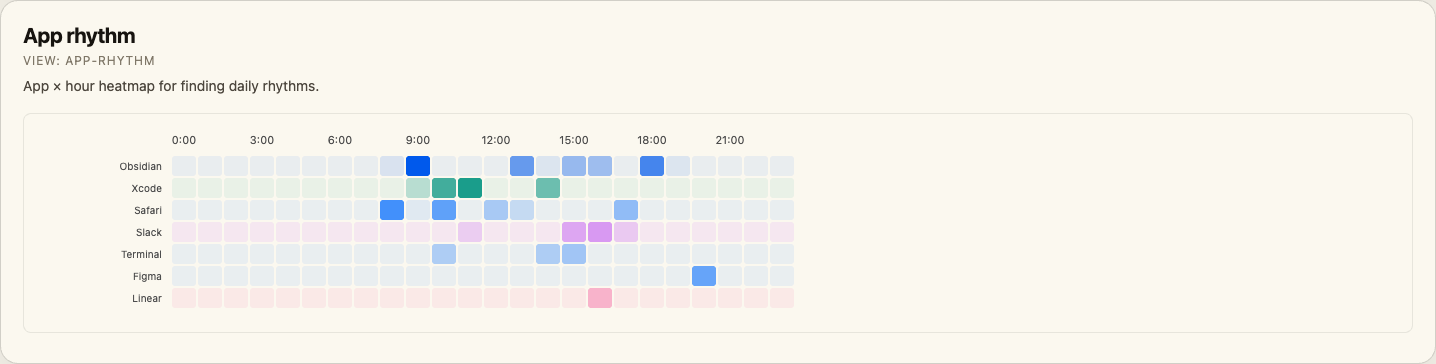 |
| Focus vs fragmentation | fragmentation-scatter |
Daily active time versus switches per hour; bubble size is session count. | 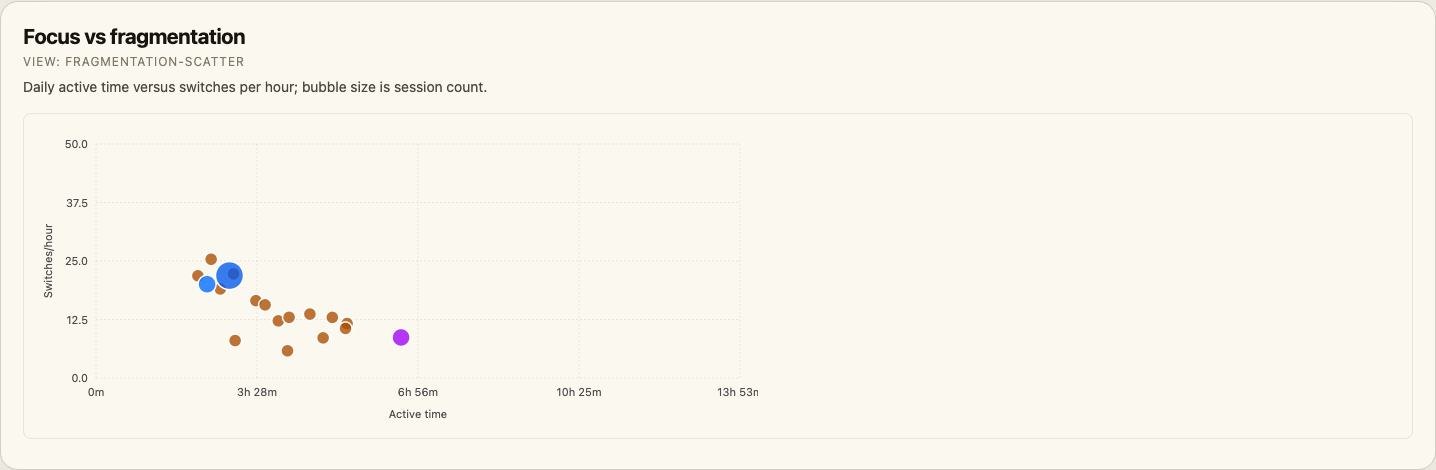 |
| Category balance | category-balance |
Category mix from daily and hourly matrices. | 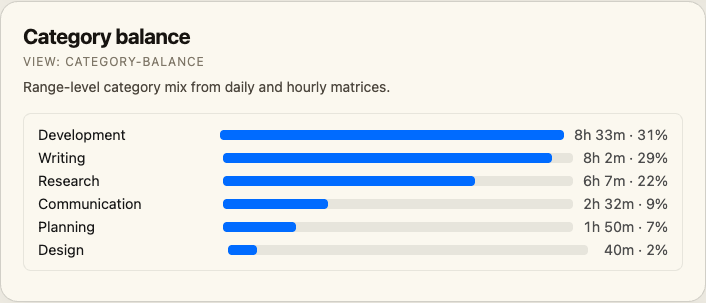 |
| Day archetypes | day-archetypes |
Day classifications such as deep work, fragmented, or browsing-heavy. | 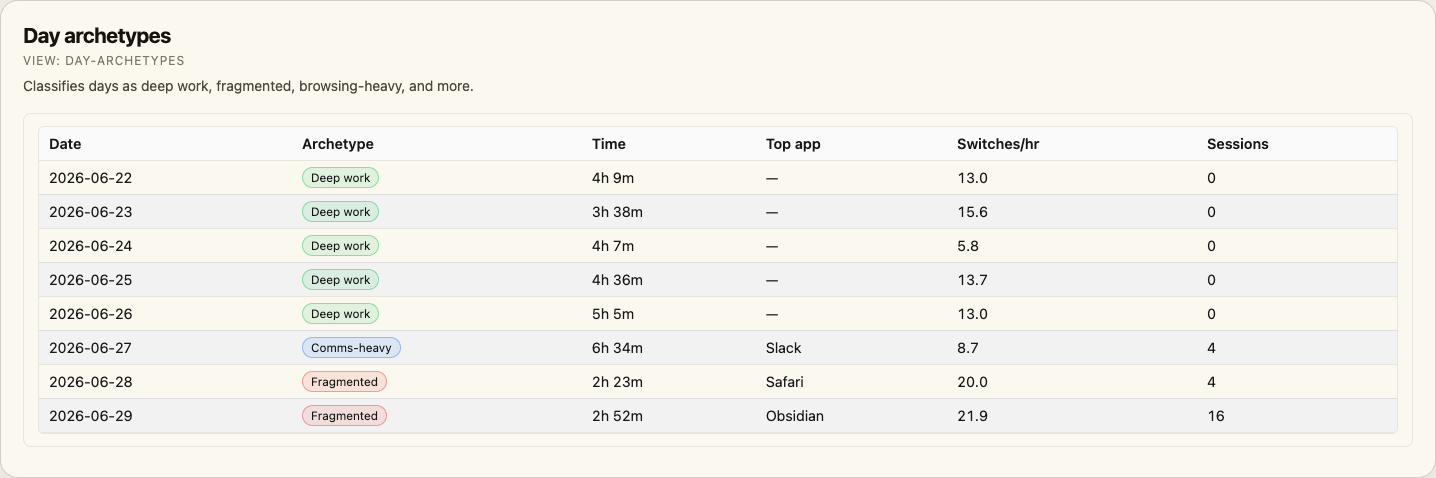 |
| Contribution heatmap | contribution-heatmap |
Calendar-style daily activity heatmap. | 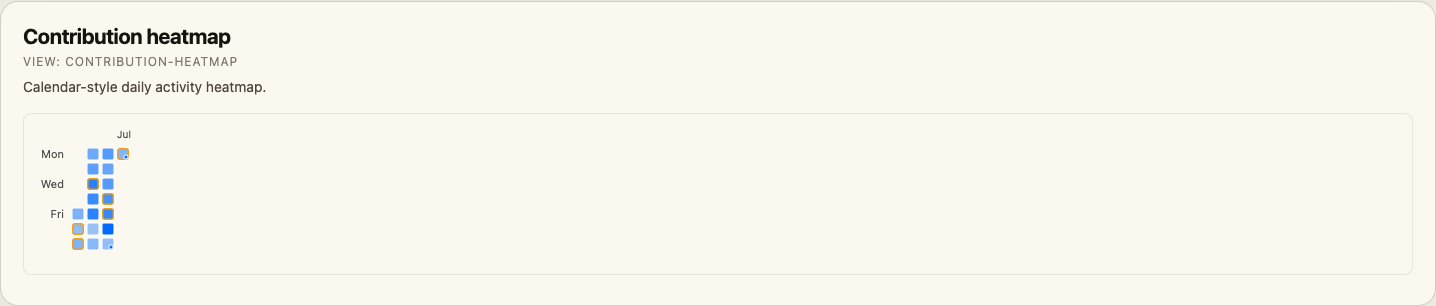 |
| Date × hour heatmap | date-hour-heatmap |
Raw-session-derived grid by date and hour. | 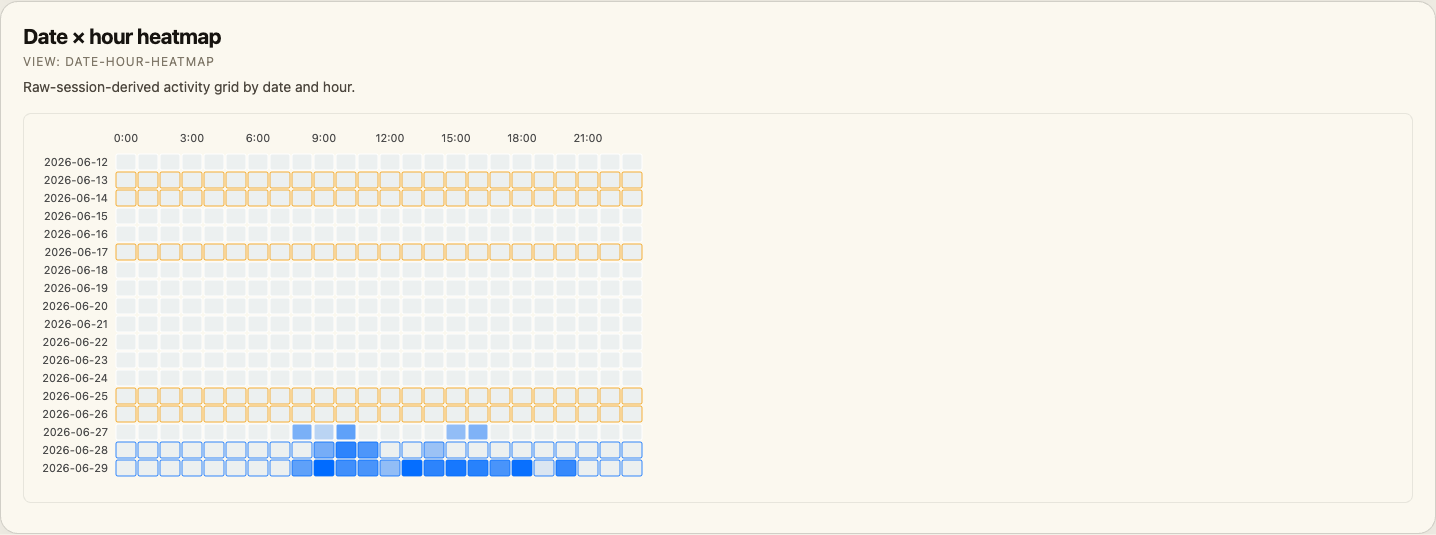 |
Projects, reports, and browsing
| Visualization | Embed view | What it shows | Screenshot |
|---|---|---|---|
| Projects | projects |
Category/project list paired with distribution stats. | 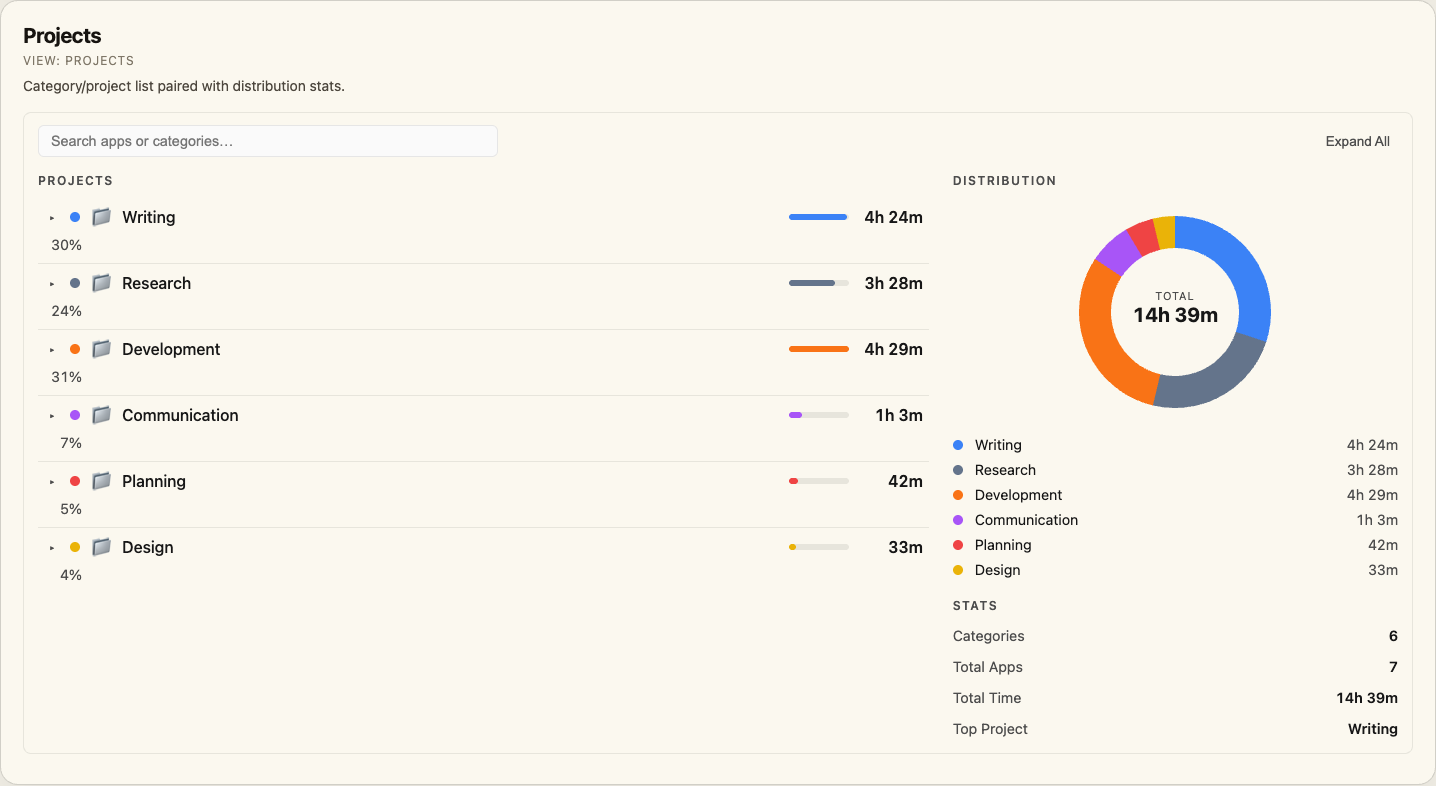 |
| Distribution donut | distribution |
Category share as a donut with legend and stats. | 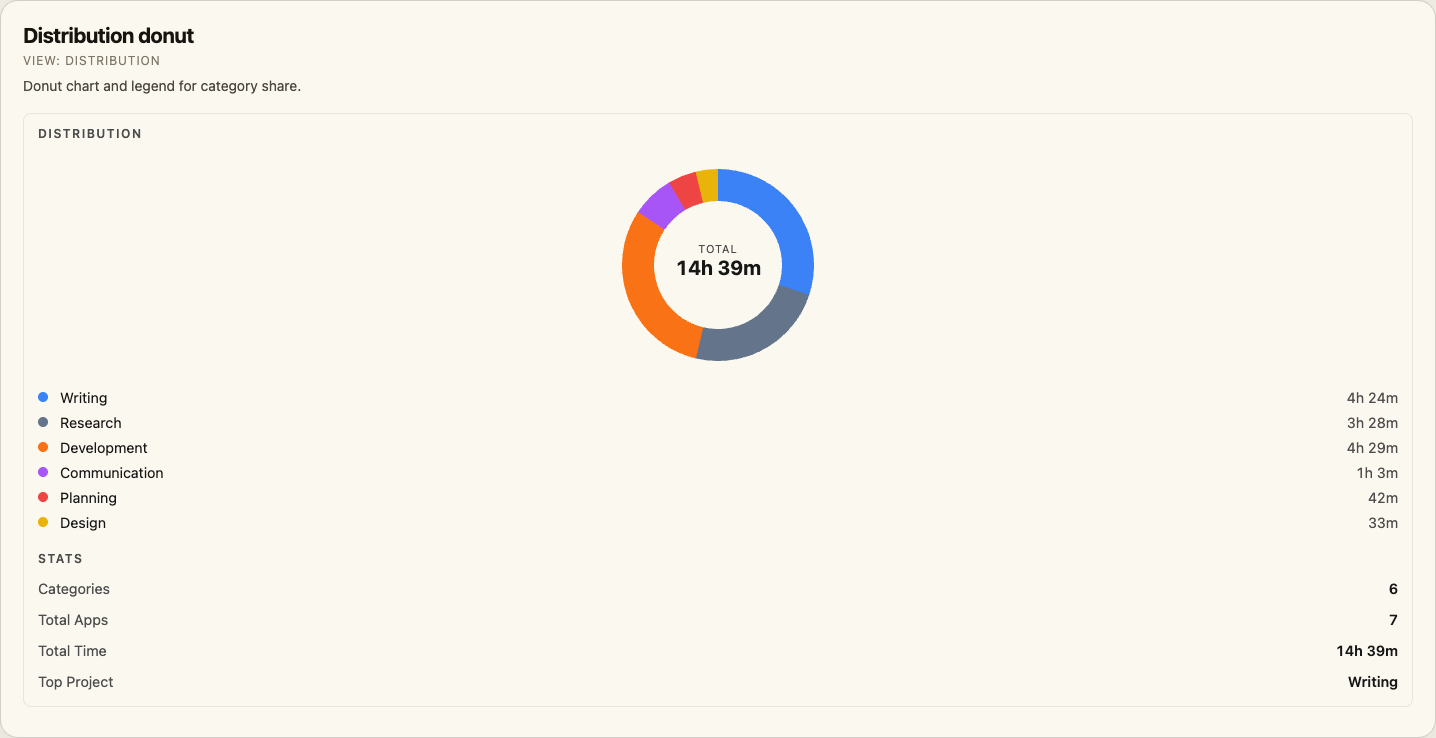 |
| Web history | web-history |
Browser history stats, timeline, domains, or hourly activity. | 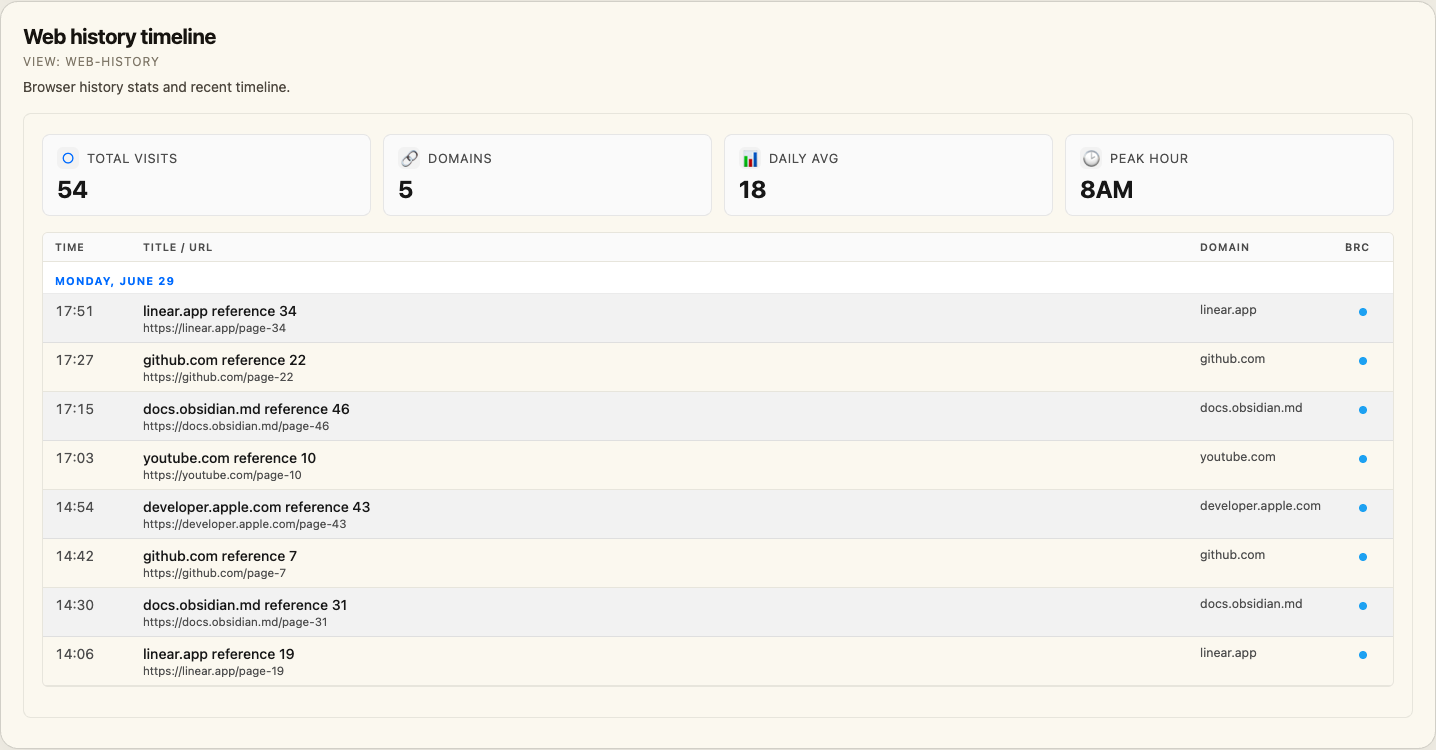 |
| Reports | reports |
Summary stats, period comparison, distributions, weekday averages, and export table. | 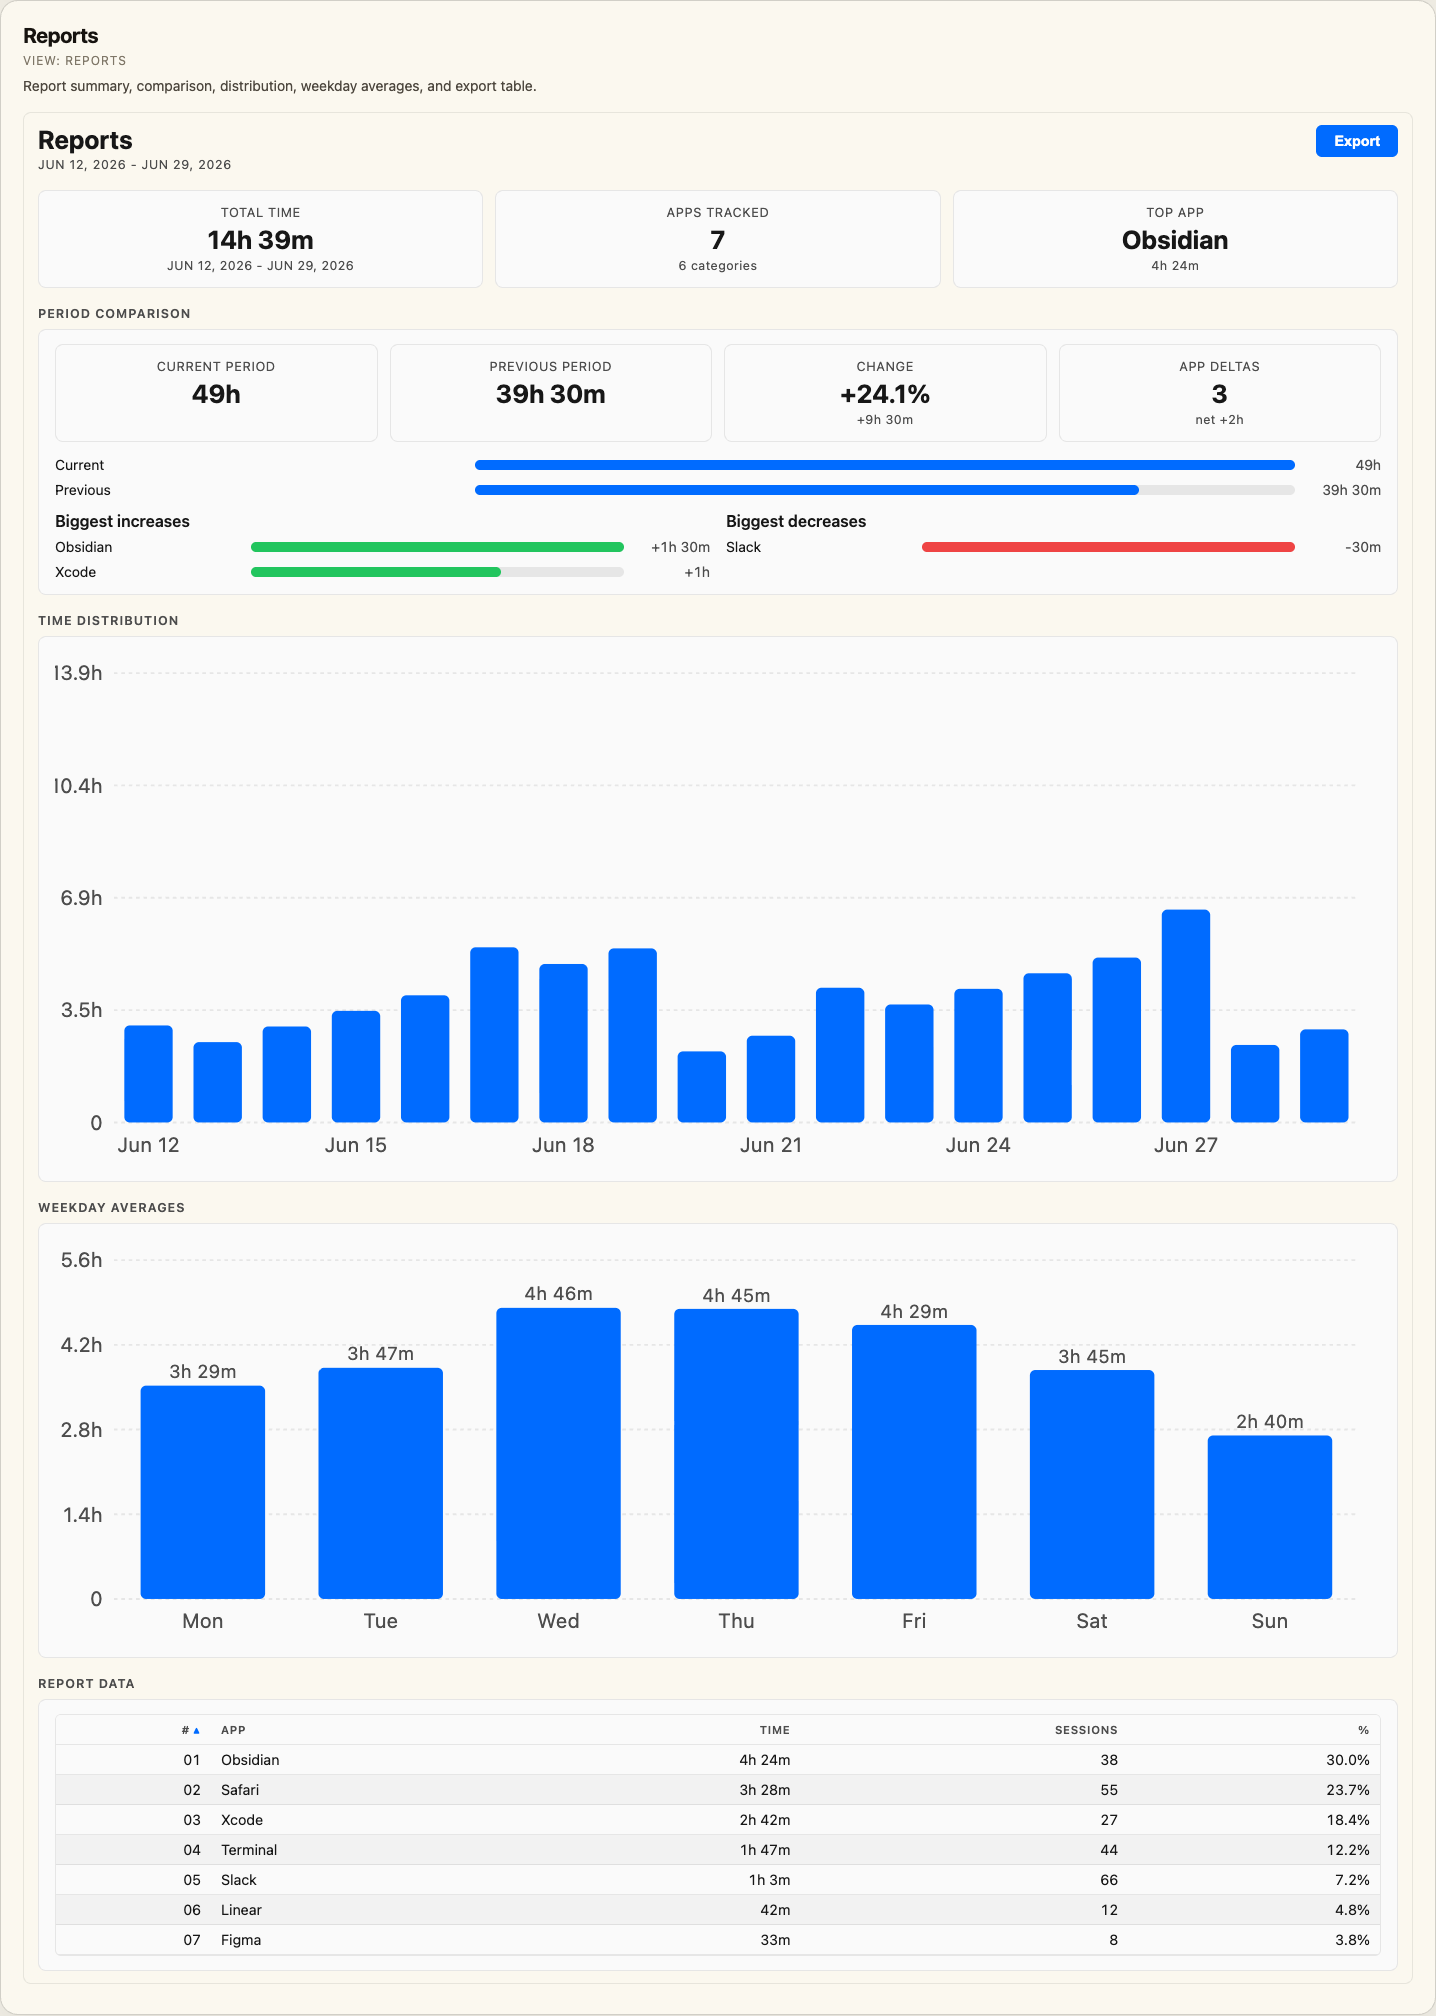 |
Input tracking visualizations
| Visualization | Embed view | What it shows | Screenshot |
|---|---|---|---|
| Input stats | input-stats |
Keystrokes, peak typing minute, cursor samples, clicks, and observed apps. | 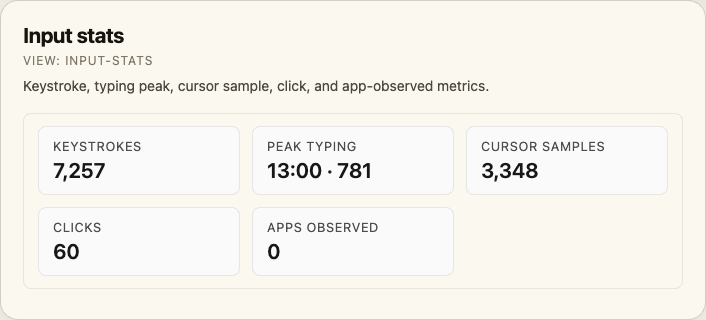 |
| Cursor heatmap | cursor-heatmap |
Absolute screen-coordinate cursor heatmap with click overlay. | 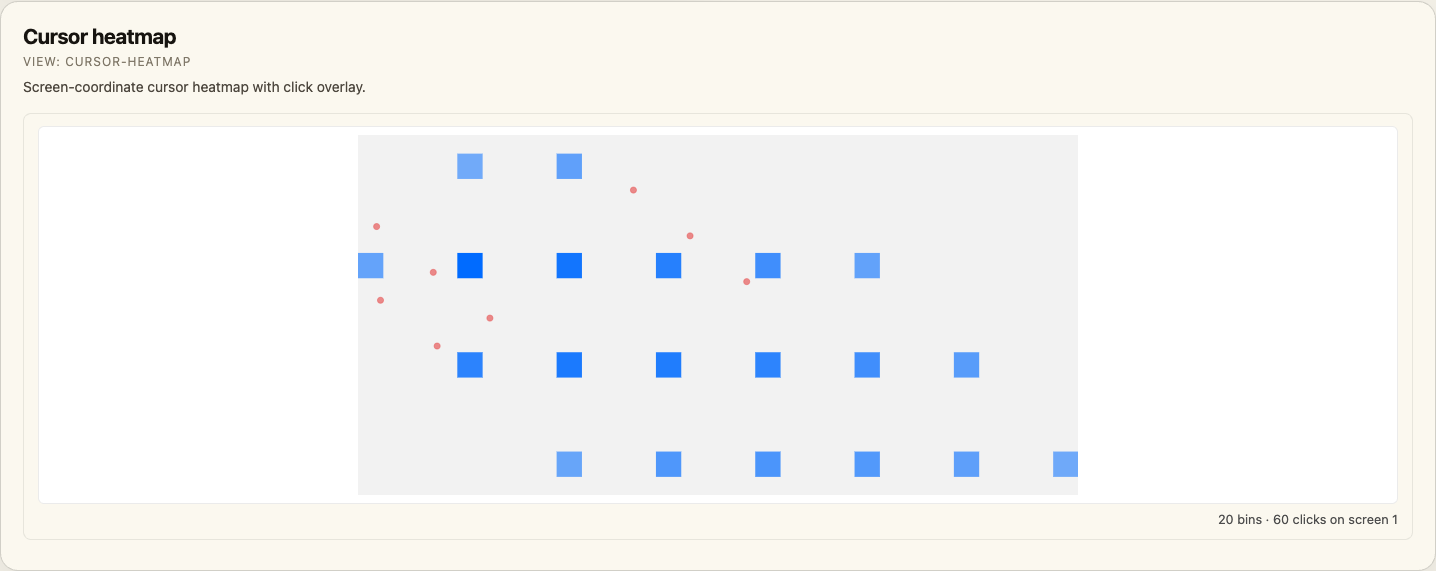 |
| Typing intensity | typing-intensity |
Hourly keystroke line chart. | 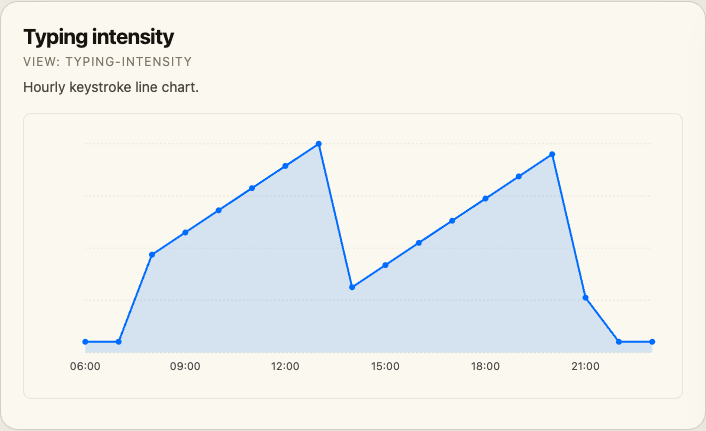 |
| Top typed keys | top-keys |
Most-pressed keys. | 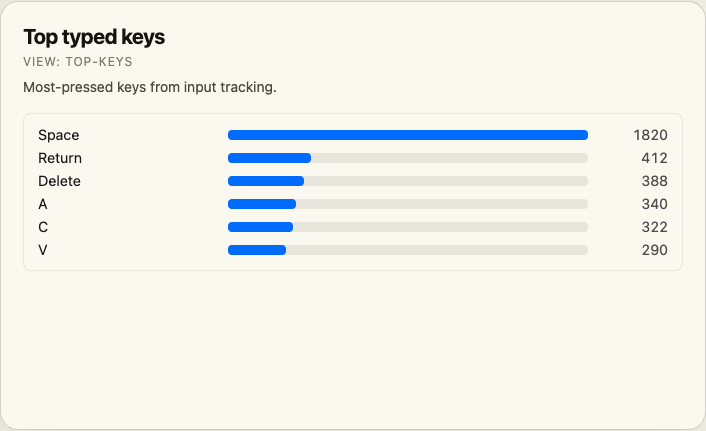 |
| Top typed words | top-words |
Most-typed words with default redaction controls. | 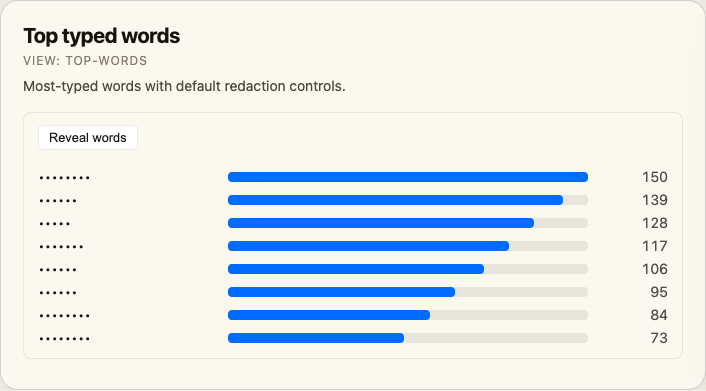 |
| Input activity | input-activity |
Per-app click counts from raw mouse events. | 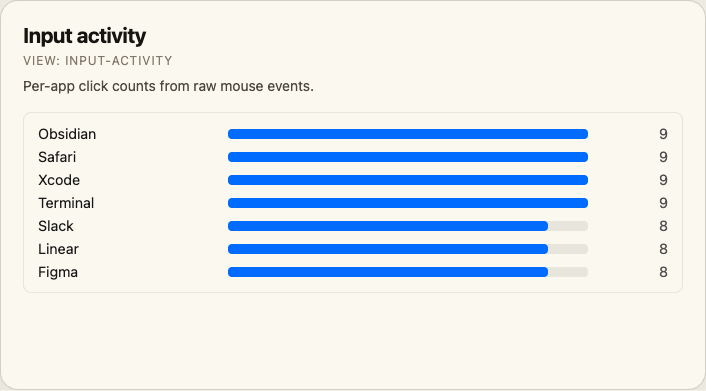 |
Input Tracking
If you've enabled Input Tracking in the time.md app (Settings → Input Tracking), the .input destination emits six new sections that this plugin renders as the Input Tracking view:
| Section | What it shows |
|---|---|
| Cursor Heatmap Bins | 2D heat overlay in absolute screen coordinates, per-screen tab strip, optional click overlay |
| Typing Intensity | Hourly keystrokes line chart |
| Top Typed Keys | Bar list of the 25 most-pressed keys |
| Top Typed Words | Bar list of the 50 most-typed words (only populated when "Full content" capture is on; default-redacted with a Reveal toggle) |
| Raw Mouse Events | Per-app click counts + click dots overlaid on the cursor heatmap |
| Raw Keystrokes | Optional first-200 timeline (chars default-redacted; secure-input rows show 🔒) |
Example export workflow
In time.md → Export view, pick Destination = Input (or Combined with the input toggles enabled).
Pick a format the plugin can read — JSON is recommended for the raw sections:
Format:      JSON
Destination: Input
Date range:  Today
Sections:    Top Typed Words, Top Typed Keys,
             Cursor Heatmap Bins, Typing Intensity,
             Raw Keystrokes (optional),
             Raw Mouse Events (optional)
Save the file into the folder you've configured under Settings → time.md → Export folder.
Run time.md: Open Input Tracking from the command palette (or click the keyboard ribbon icon).
A minimal JSON export the view can render looks like:
{
  "title": "Input Tracking — 2026-05-04",
  "destination": "input",
  "sections": [
    {
      "name": "input_cursor_heatmap",
      "display_name": "Cursor Heatmap Bins",
      "headers": ["screen_id", "bin_x", "bin_y", "samples"],
      "data": [
        { "screen_id": 1, "bin_x": 30, "bin_y": 22, "samples": 1820 },
        { "screen_id": 1, "bin_x": 31, "bin_y": 22, "samples": 1280 },
        { "screen_id": 2, "bin_x": 60, "bin_y": 20, "samples": 1140 }
      ]
    },
    {
      "name": "input_typing_intensity",
      "display_name": "Typing Intensity",
      "headers": ["timestamp", "keystrokes"],
      "data": [
        { "timestamp": "2026-05-04T10:00:00Z", "keystrokes": 388 },
        { "timestamp": "2026-05-04T11:00:00Z", "keystrokes": 612 },
        { "timestamp": "2026-05-04T15:00:00Z", "keystrokes": 720 }
      ]
    },
    {
      "name": "input_top_keys",
      "display_name": "Top Typed Keys",
      "headers": ["key_code", "key_label", "count"],
      "data": [
        { "key_code": 49, "key_label": "Space",  "count": 1820 },
        { "key_code": 36, "key_label": "Return", "count": 412 },
        { "key_code": 51, "key_label": "Delete", "count": 388 }
      ]
    }
  ]
}
A larger fixture covering all six sections lives at tests/fixtures/input-tracking-sample.json — drop it into your export folder to preview the view without needing real data.
Privacy
- The Top Typed Words and Raw Keystrokes panels default to redacted (each character replaced with
•); click Reveal words / Reveal chars to unmask. - Rows captured while macOS Secure Input was active (e.g. password fields,
sudoprompts) are surfaced as 🔒 with emptycharvalues, by design from the time.md exporter. - If no input sections are present in any loaded export, the Input Tracking view shows an empty-state callout — the existing views are unaffected.
Embedding into notes
Drop a timemd code block into any note to render a live widget that updates whenever you reload exports:
```timemd
view: overview
```
Supported views
view |
Renders |
|---|---|
overview |
Stats strip, trend sparkline, weekly heatmap, and top apps (default) |
stat |
One big number — configure with metric: |
trends, trend-chart |
Daily line chart |
calendar, heatmap |
7×24 weekly heatmap |
apps, top-apps |
App bar list |
categories |
Category bar list |
details |
Recent sessions list |
transition-sankey |
Attention-flow Sankey between source and destination apps |
app-lanes |
Per-app session lanes for the latest day |
session-waterfall |
Chronological session list with duration bars |
app-rhythm |
App × hour heatmap |
fragmentation-scatter |
Daily active time vs. switches per hour scatter plot |
category-balance |
Category mix from daily / hourly matrix exports |
day-archetypes |
Table of daily classifications such as Deep work or Fragmented |
contribution-heatmap |
Calendar-style daily contribution heatmap |
date-hour-heatmap |
Date × hour heatmap derived from Raw Sessions |
projects |
Categories list + distribution donut + stats |
distribution |
Donut chart + category legend + stats card (no list) |
web-history |
Browser history (timeline / domains / activity tab) |
reports |
Time distribution + weekday averages + report data table |
input-stats |
Stats strip — keystrokes, peak typing minute, cursor samples, clicks, apps observed |
cursor-heatmap |
Aspect-preserving cursor heatmap in absolute screen coordinates with click overlay |
typing-intensity |
Hourly keystroke line chart |
top-keys |
Bar list of the most-pressed keys |
top-words |
Bar list of the most-typed words (default-redacted; Reveal toggle) |
input-activity |
Per-app click count bar list |
Parameters
| key | applies to | default | description |
|---|---|---|---|
view |
all | overview |
widget type (see table above) |
limit |
overview, top-apps, categories, details, transition-sankey, app-lanes, session-waterfall, app-rhythm, category-balance, day-archetypes, projects, web-history, top-keys, top-words |
varies | number of items shown |
days |
overview, trend-chart |
all | restrict to last N days of trend data |
height |
cursor-heatmap, typing-intensity |
view default | SVG canvas height in pixels |
metric |
stat |
total_time |
total_time, top_app, apps_count, days, peak_day |
sections |
overview |
all | comma-separated list of stats, trend, heatmap, apps |
date |
overview |
— | today, yesterday, or YYYY-MM-DD — filters every panel to that single day (requires Raw Sessions in the export) |
tab |
web-history |
timeline |
timeline, domains, or activity |
browser |
web-history |
— | filter to a single browser (Safari, Chrome, Arc, …) |
stats |
distribution |
true |
false to hide the STATS card |
legend |
distribution |
true |
false to hide the legend list (donut-only) |
label |
distribution |
true |
false to hide the "DISTRIBUTION" label |
bare |
all | true |
false keeps the embed's card background, border, and padding; default bare widgets sit flush on the note |
colorScheme |
all | plugin setting | per-block palette override: theme, time-md, monochrome, warm-console, graphite-violet, system, editor-dark, midnight, or daybreak |
groupBy |
reports |
app |
app, category, or day |
format |
reports |
csv |
csv, json, or markdown (used by the in-view Export button) |
title |
all | — | optional heading |
Examples
Dashboard stat card for a daily note:
```timemd
view: stat
metric: total_time
title: Screen time today
```
Last 7 days of trend:
```timemd
view: trend-chart
days: 7
title: Last week
```
Top 5 apps:
```timemd
view: top-apps
limit: 5
```
Lean overview — stats and apps only, last 7 days:
```timemd
view: overview
sections: stats, apps
days: 7
limit: 3
```
Just yesterday:
```timemd
view: overview
date: yesterday
title: Yesterday
```
Input tracking dashboard for a daily note:
```timemd
view: input-stats
title: Input today
```

```timemd
view: cursor-heatmap
height: 360
```

```timemd
view: top-words
limit: 20
```
A complete sample note that wires every input component together lives at
examples/input-tracking.md. The expanded
examples/ directory also includes visualization recipes,
ready-to-copy note templates, and synthetic exports for previewing dashboards
without personal data.
Setup
- Install the plugin (see "Manually installing" below while it's pre-release).
- Export data from the time.md app using any supported format.
- Place the exported file(s) inside a folder in your Obsidian vault.
- Point the plugin at that folder in Settings → time.md → Export folder.
- Run time.md: Open Overview from the command palette.
While enabled, the plugin also makes .json, .csv, .yaml, and .yml files visible in Obsidian’s file explorer and opens them in the text editor. Disable Show data files in vault in the plugin settings if you prefer Obsidian’s default file visibility.
Manually installing (pre-release)
- Build locally:
npm install && npm run build - Copy
main.js,styles.css,manifest.jsoninto<vault>/.obsidian/plugins/timemd-visualizor/ - Enable the plugin in Obsidian settings.
Development
npm install
npm run dev   # esbuild in watch mode
npm run build # type-check + production build
License
0BSD (same as the sample plugin template).