Charts View
 caronchen88k downloads
Visualize data from your notes with plots and graphs.
- Overview
- Scorecard
- Updates32
Obsidian Charts View Plugin
This is a data visualization plugin for Obsidian, based on Ant Design Charts. Support plots and graphs. @see The document generated by Zread
- Obsidian Charts View Plugin
Chart Templates
Word Count
Use command Insert Template -> Word Count to insert code block.
#-----------------#
#- chart type    -#
#-----------------#
type: WordCloud

#-----------------#
#- chart data    -#
#-----------------#
data: "wordcount:Words"

#-----------------#
#- chart options -#
#-----------------#
options:
  wordField: "word"
  weightField: "count"
  colorField: "count"
  wordStyle:
    rotation: 30

Multi files
data: "wordcount:Words,PARA,@Inbox/"
ALL files
data: "wordcount:/"
Folder
data: "wordcount:@Inbox/"
Pie
Use command Charts View: Insert Template -> Pie to insert code block.

WordCloud
Use command Charts View: Insert Template -> WordCloud to insert code block.

Treemap
Use command Charts View: Insert Template -> Treemap to insert code block.

DualAxes
Use command Charts View: Insert Template -> DualAxes to insert code block.

Mix
Use data.<any name> and options.<any name> to set data and options. Keep data and options <any name> same.
Use command Charts View: Insert Template -> Mix to insert code block.

Bar
Use command Charts View: Insert Template -> Bar to insert code block.

OrganizationTreeGraph
Use command Charts View: Insert Template -> OrganizationTreeGraph to insert code block.

Radar
Use command Charts View: Insert Template -> Radar to insert code block.

TinyLine
Use command Charts View: Insert Template -> TinyLine to insert code block.

Dataviewjs Example (Column)
Chart data by dataviewjs.
Use command Charts View: Insert Template -> Dataviewjs Example (Column) to insert code block.

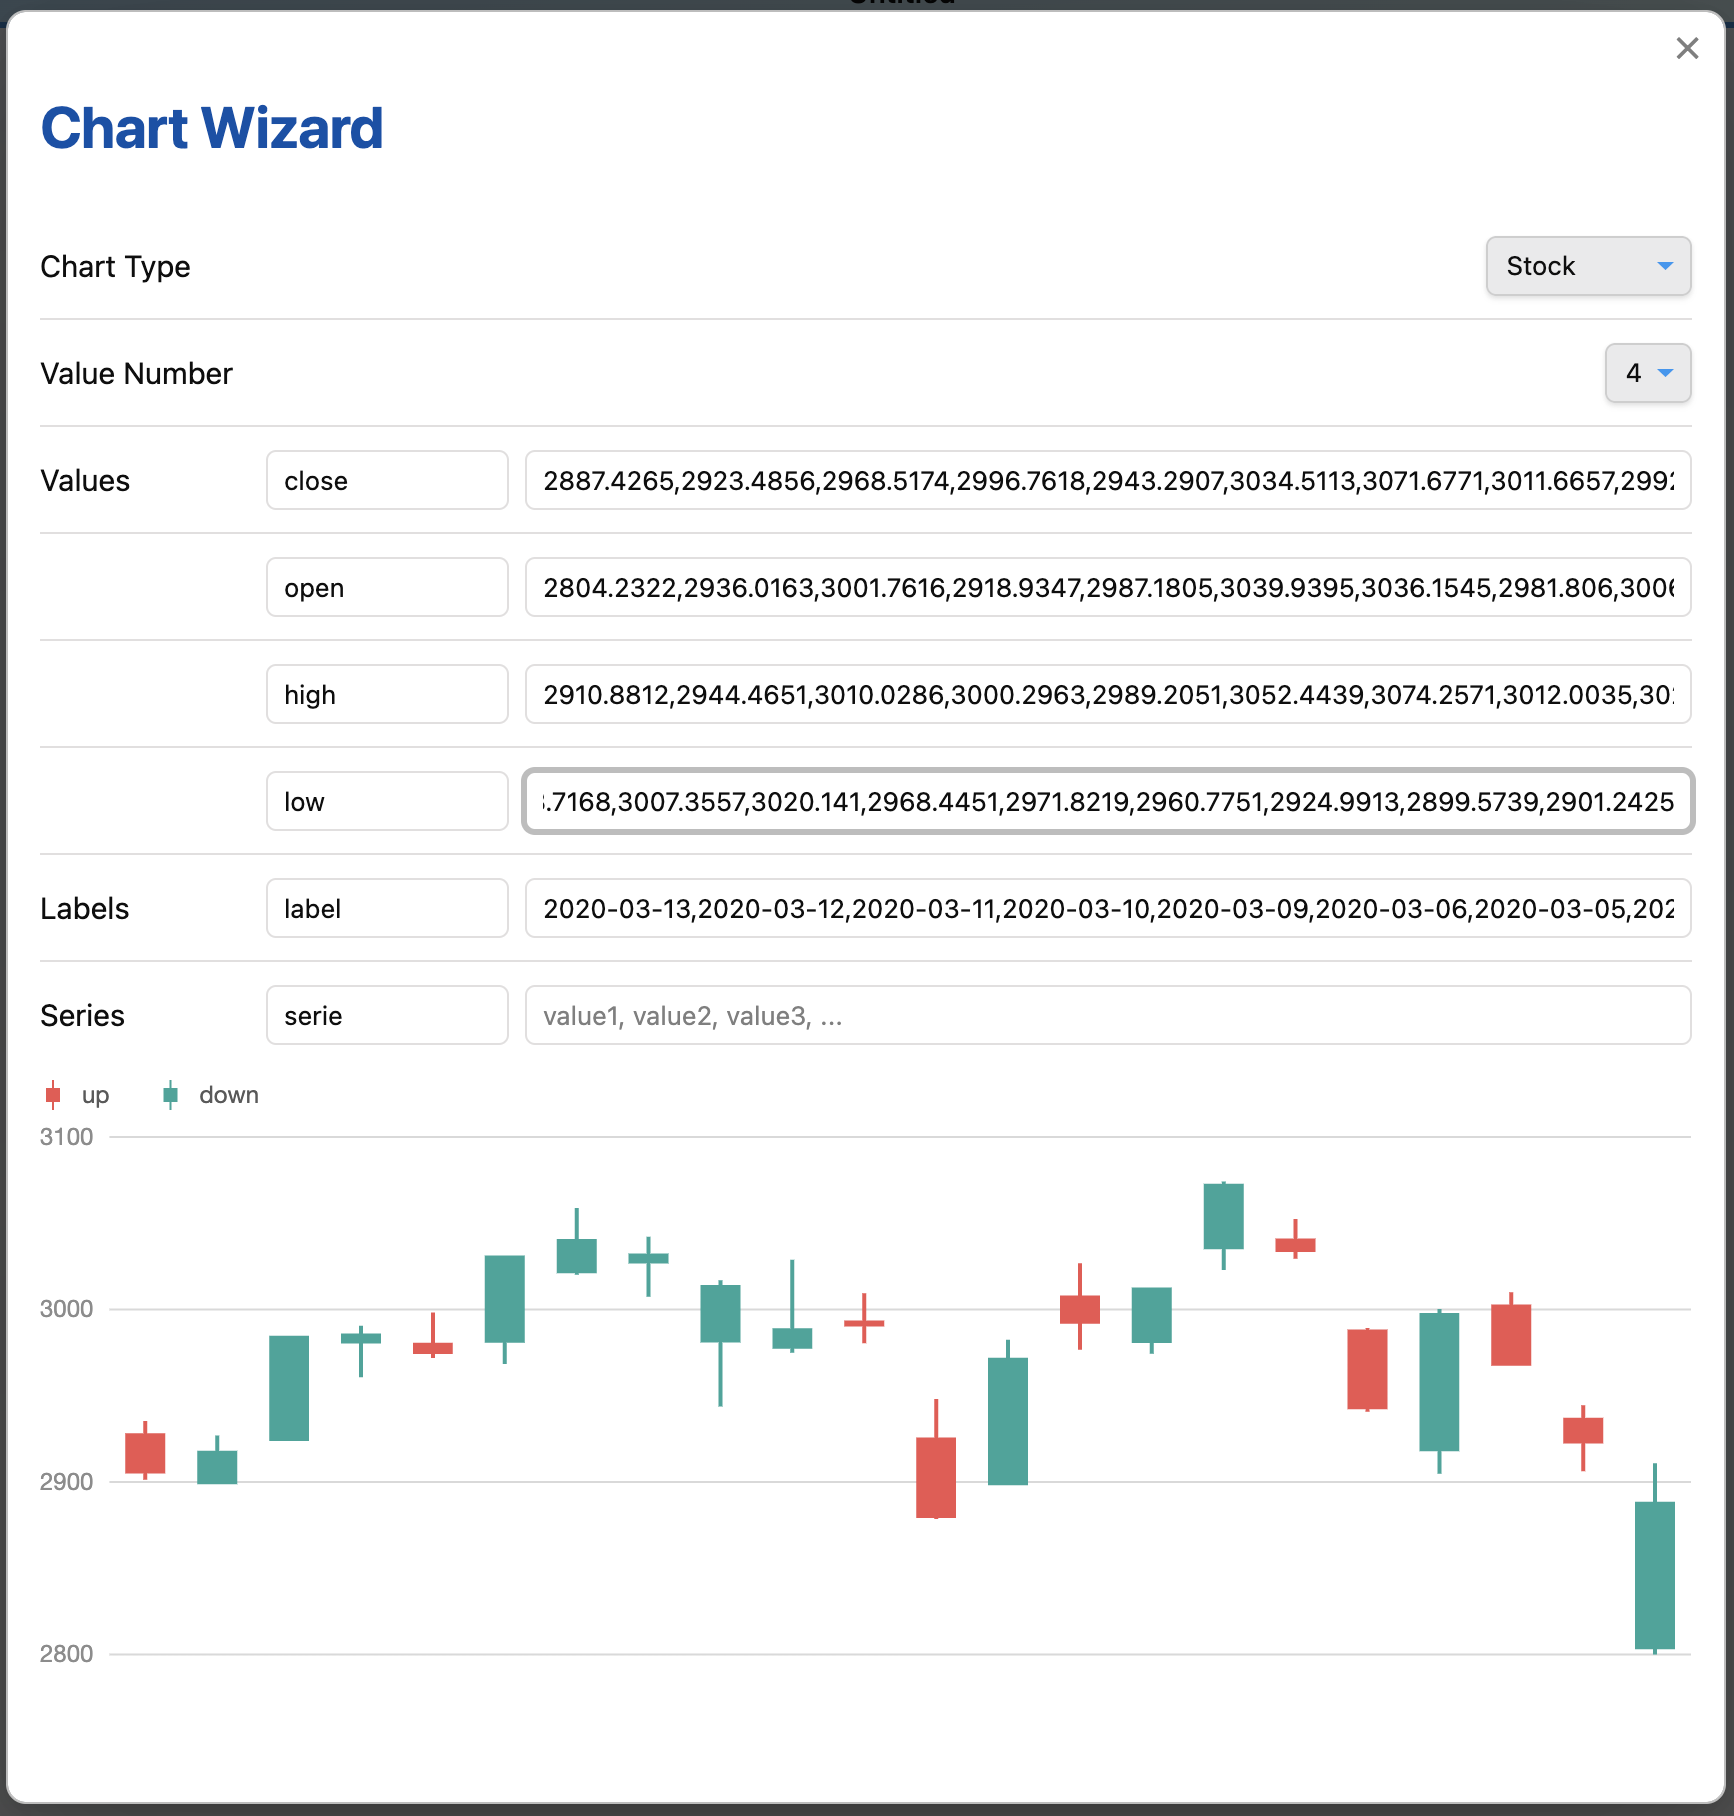
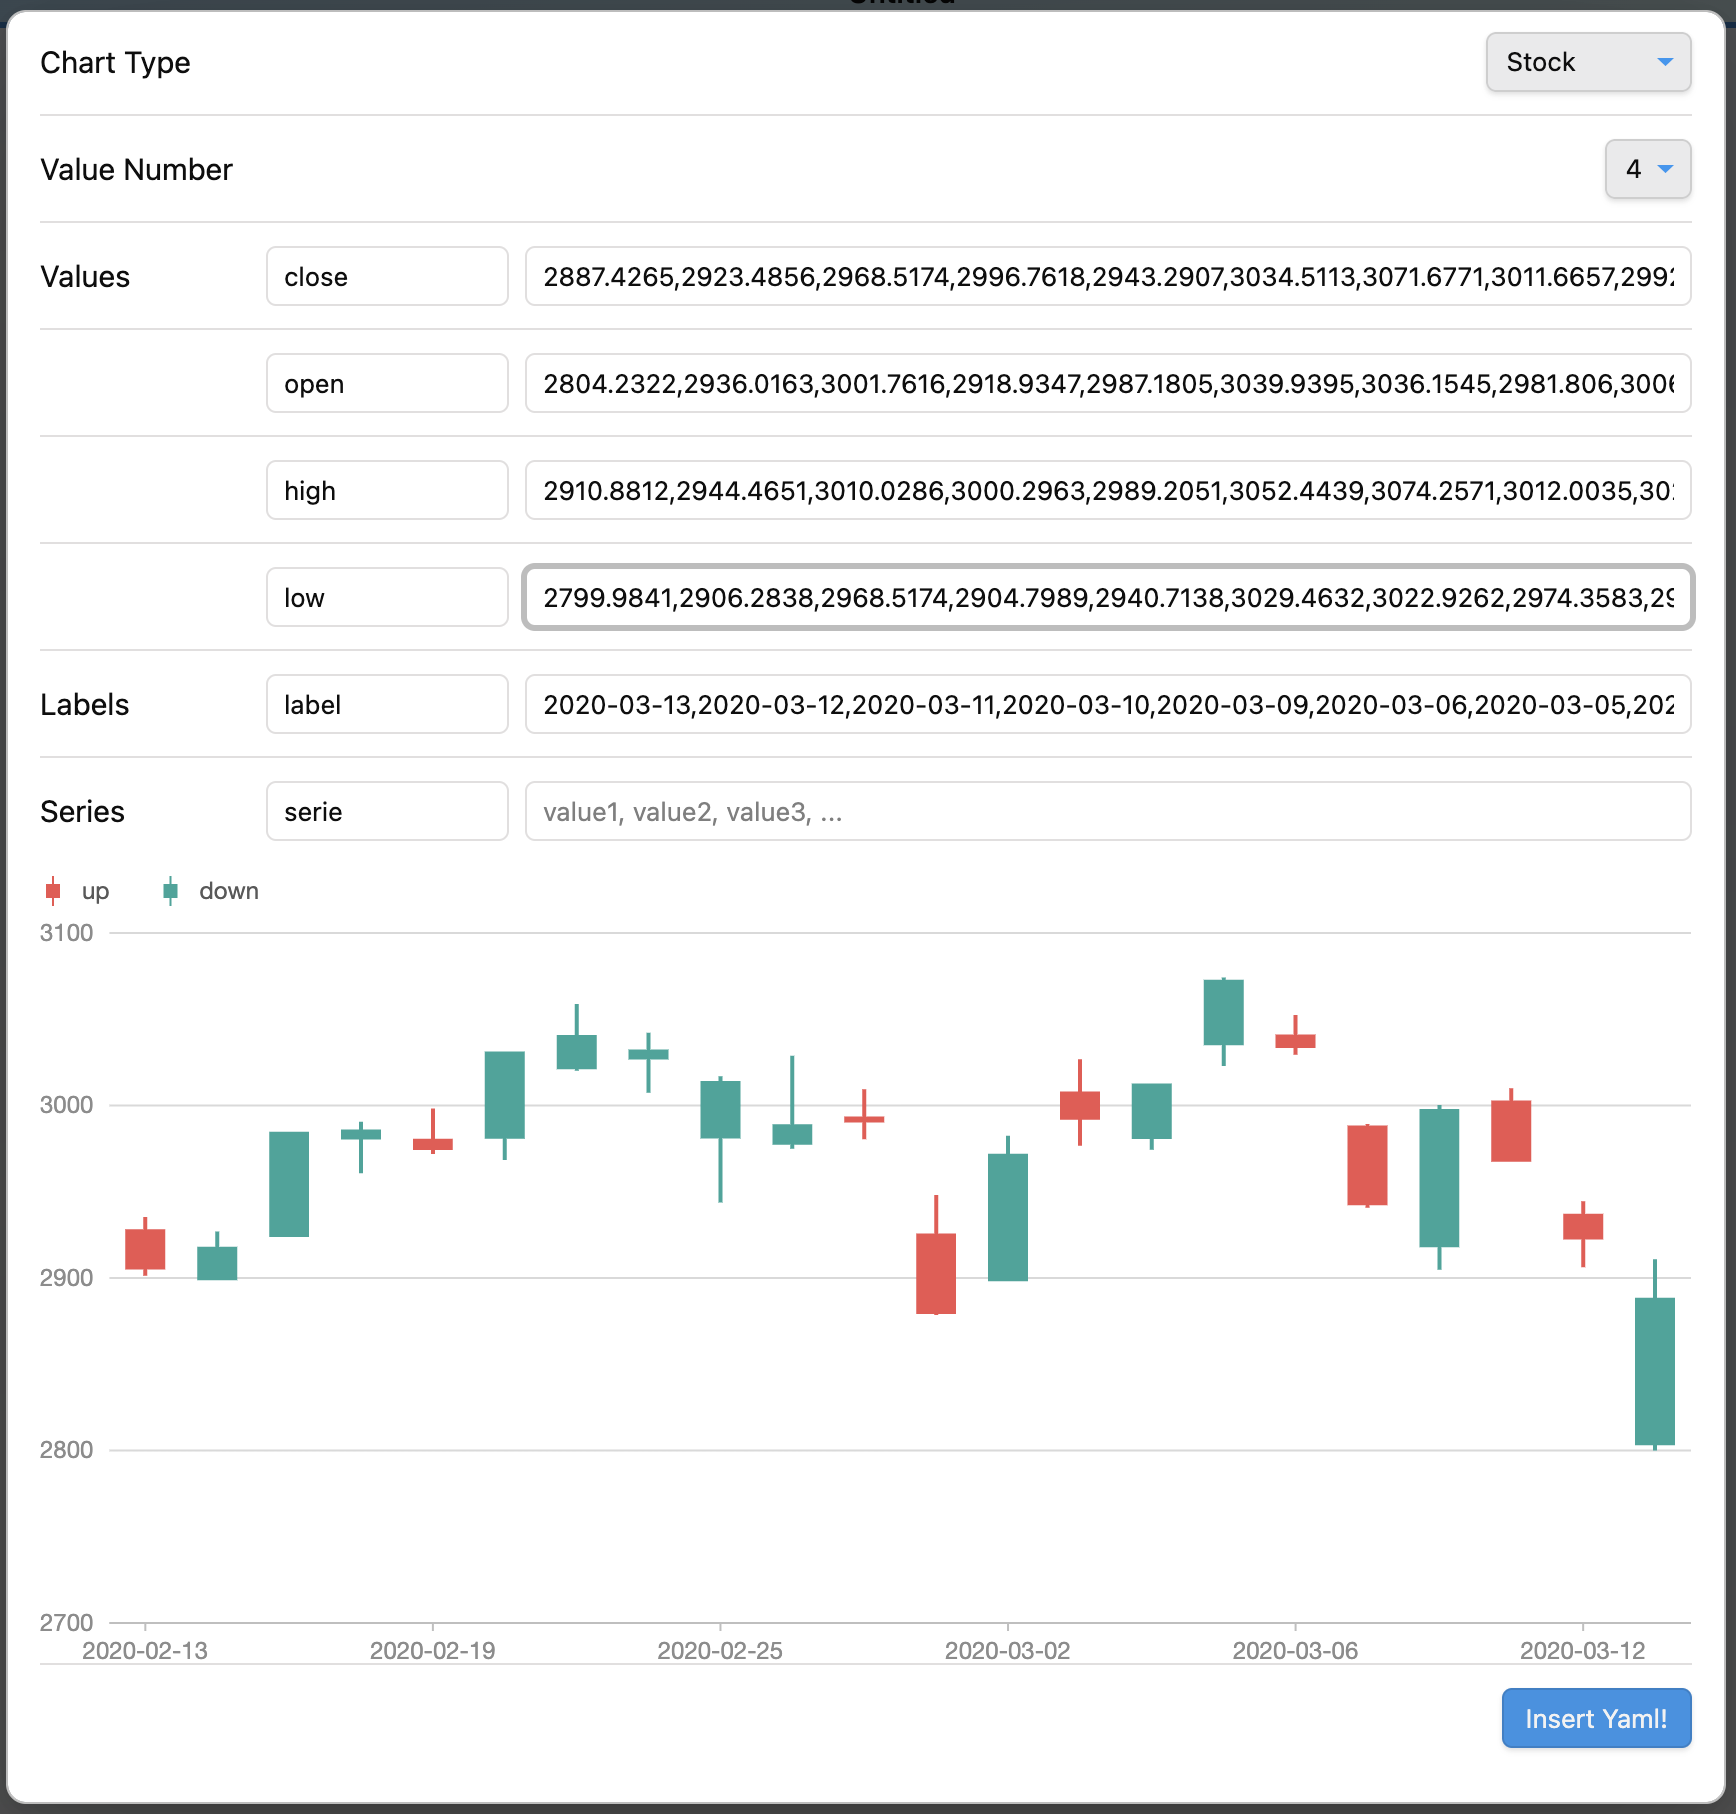
Chart Wizard
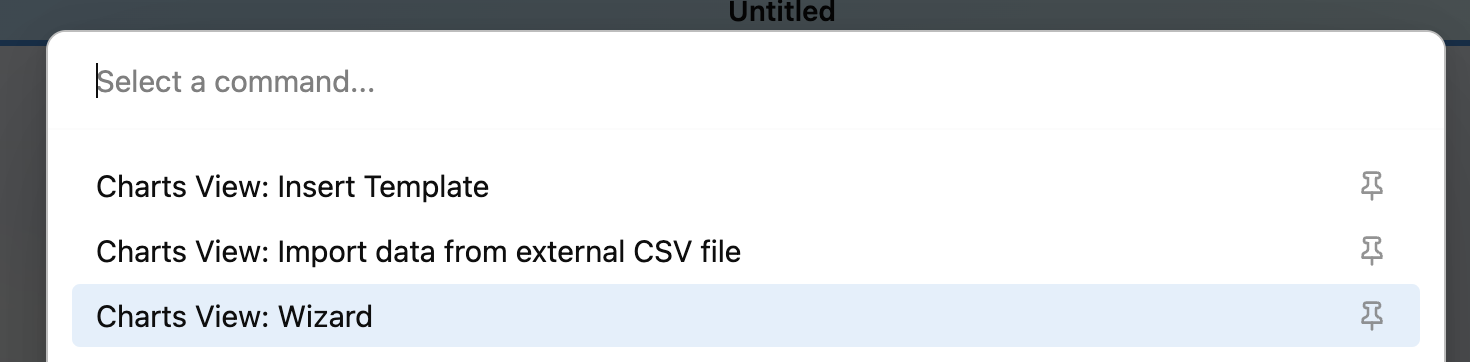
Use command Charts View: Wizard to insert code block.
Data from CSV file
Import data from external CSV file (Desktop)
Use command Charts View: Import data from external CSV file to insert data from CSV file.
Load data from internal CSV file
Load CSV file from data path. Data path should be specified in settings.
#-----------------#
#- chart type    -#
#-----------------#
type: Mix

#-----------------#
#- chart data    -#
#-----------------#
data.area:
  - time: 1246406400000
    temperature: [14.3, 27.7]
  - time: 1246492800000
    temperature: [14.5, 27.8]
  - time: 1246579200000
    temperature: [15.5, 29.6]
  - time: 1246665600000
    temperature: [16.7, 30.7]
  - time: 1246752000000
    temperature: [16.5, 25.0]
  - time: 1246838400000
    temperature: [17.8, 25.7]

data.line: LineData.csv

#-----------------#
#- chart options -#
#-----------------#
options:
  appendPadding: 8
  syncViewPadding: true
  tooltip:
    shared: true
    showMarkers: false
    showCrosshairs: true
    offsetY: -50

options.area:
  axes: {}
  meta:
    time:
      type: 'time'
      mask: 'MM-DD'
      nice: true
      tickInterval: 172800000
      range: [0, 1]
    temperature:
      nice: true
      sync: true
      alias: '温度范围'
  geometries:
    - type: 'area'
      xField: 'time'
      yField: 'temperature'
      mapping: {}

options.line:
  axes: false
  meta:
    time:
      type: 'time'
      mask: 'MM-DD'
      nice: true
      tickInterval: 172800000
      range: [0, 1]
    temperature:
      sync: 'temperature'
      alias: '温度'
  geometries:
    - type: 'line'
      xField: 'time'
      yField: 'temperature'
      mapping: {}
    - type: 'point'
      xField: 'time'
      yField: 'temperature'
      mapping:
        shape: 'circle'
        style:
          fillOpacity: 1
Multi CSV files
#-----------------#
#- chart type    -#
#-----------------#
type: DualAxes

#-----------------#
#- chart data    -#
#-----------------#
data: DualAxesData.csv, DualAxesData.csv

#-----------------#
#- chart options -#
#-----------------#
options:
  xField: 'time'
  yField: ['value', 'count']
  yAxis:
    value:
      min: 0
      label:
        formatter:
          function formatter(val) {
            return ''.concat(val, '个');
          }
  geometryOptions:
    - geometry: 'column'
    - geometry: 'line'
      lineStyle:
        lineWidth: 2
Dataview Plugin Integration
Allowed methods
- dv.current()
- dv.pages(source?)
- dv.pagePaths(source?)
- dv.page(path)
- dv.array(value)
- dv.isArray(value)
- dv.date(text)
- dv.fileLink(path, embed?, display-name?)
- dv.date(pathlike)
- dv.query(source, settings?)
- dv.io
See Dataview Codeblock Reference
Interaction
Enable search interaction
Enable the Search in Obsidian interaction when click a chart element by add an option enableSearchInteraction.
Use default:
#-----------------#
#- chart options -#
#-----------------#
options:
  ...
  enableSearchInteraction: true
or custom:
#-----------------#
#- chart options -#
#-----------------#
options:
  ...
  enableSearchInteraction:
    field: 'word'
    operator: 'path'
fieldindicate where to get keyword for search.operatorenums from Obsidian search opertaors:
| operator | Obsidian search opertaor |
|---|---|
default |
|
tag |
tag: |
path |
path: |
file |
file: |
task |
task: |
taskTodo |
task-todo: |
taskDone |
task-done: |
matchCase |
match-case: |
ignoreCase |
ignore-case: |
line |
line: |
block |
block: |
content |
content: |
section |
section: |
fileopen |
Open a file inside Vault |
Examples
See https://github.com/caronchen/obsidian-chartsview-plugin/wiki/Chart-examples
Manually installing the plugin
- Copy over
main.js,styles.css,manifest.jsonto your vaultVaultFolder/.obsidian/plugins/obsidian-chartsview-plugin/.