
- Overview
- Scorecard
- Updates8
This plugin for Obsidian adds three new bases views: Scatter Charts, Line Charts, and Bar Charts.
Usage
First you need a Base, then from there you can (with the plugin installed and enabled) create three new bases views: Scatter Charts, Line Charts, and Bar Charts.
Next you need to select the property or formula used for the X axis, in the view settings.
On the X axis, Number, Date, and String are supported.
Then you can select which properties to display on the Y Axis using the Base's Properties menu (top right).
It is recommended that you disable the default activated file name.
On the Y axis the plugin only supports values of type Number.
Grouping and Multiple Charts
The plugin supports grouping data points by color and spliting them into multiple charts.
The view settings (in the Base's view menu, top left) include a Multi chart mode dropdown.
The avaiable options are Separate by group and Separate by property.
Separating by group will use a Group by sort (Base's Sort menu, top right) to arrange the notes into multiple charts.
Here, every group gets it's own chart. Within one chart, data points are colored by their Y axis property.
Separating by property will display a separate chart for each selected Y axis property.
Within a chart, data points are colored using a Group by sort (Base's Sort menu, top right).
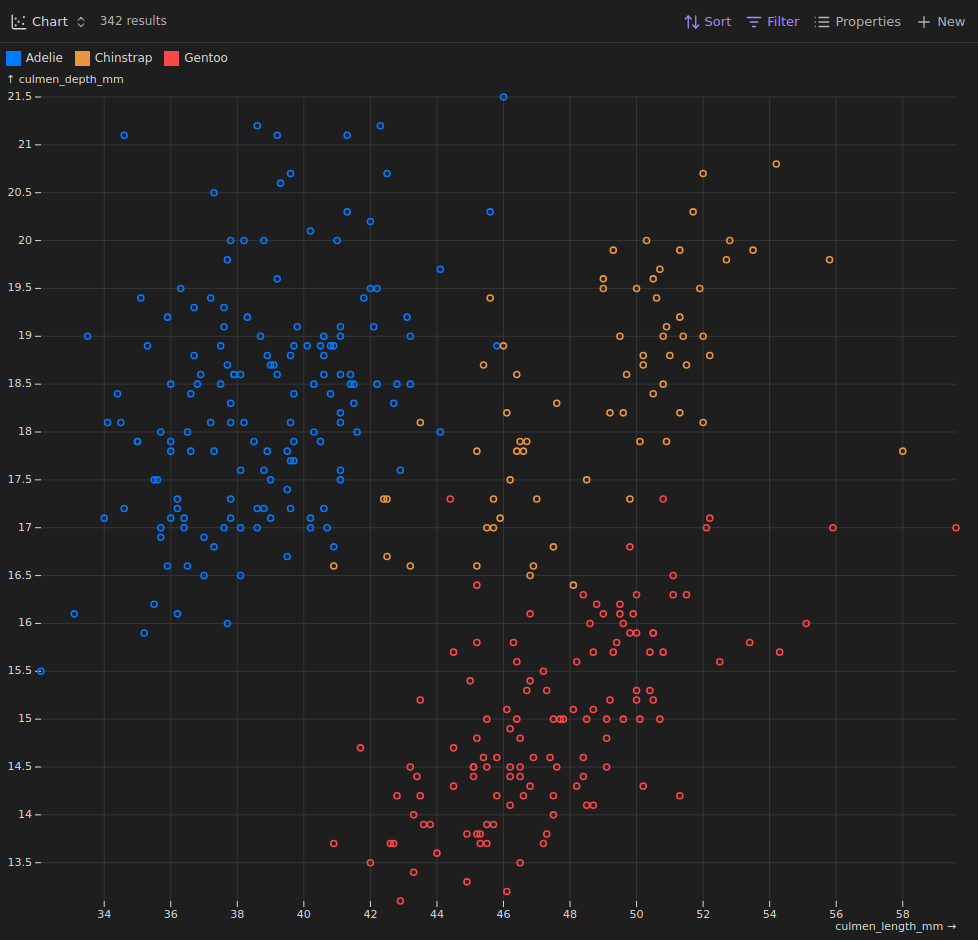
Scatter Charts
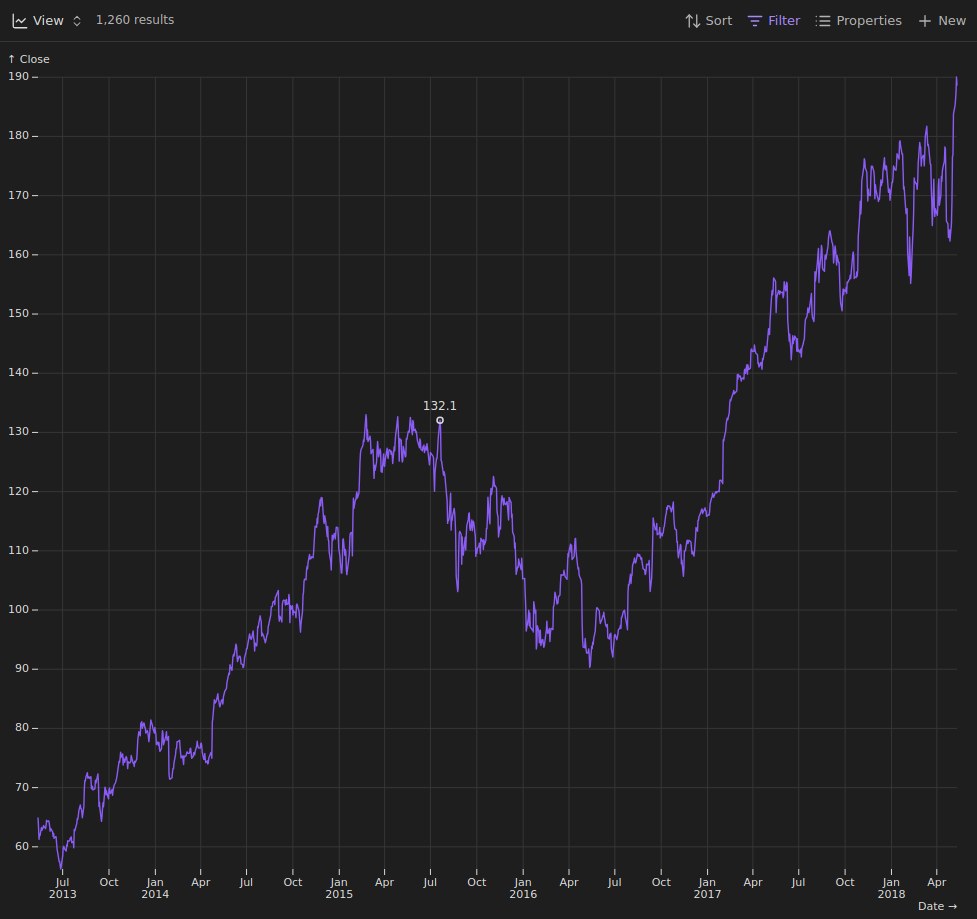
Line Charts
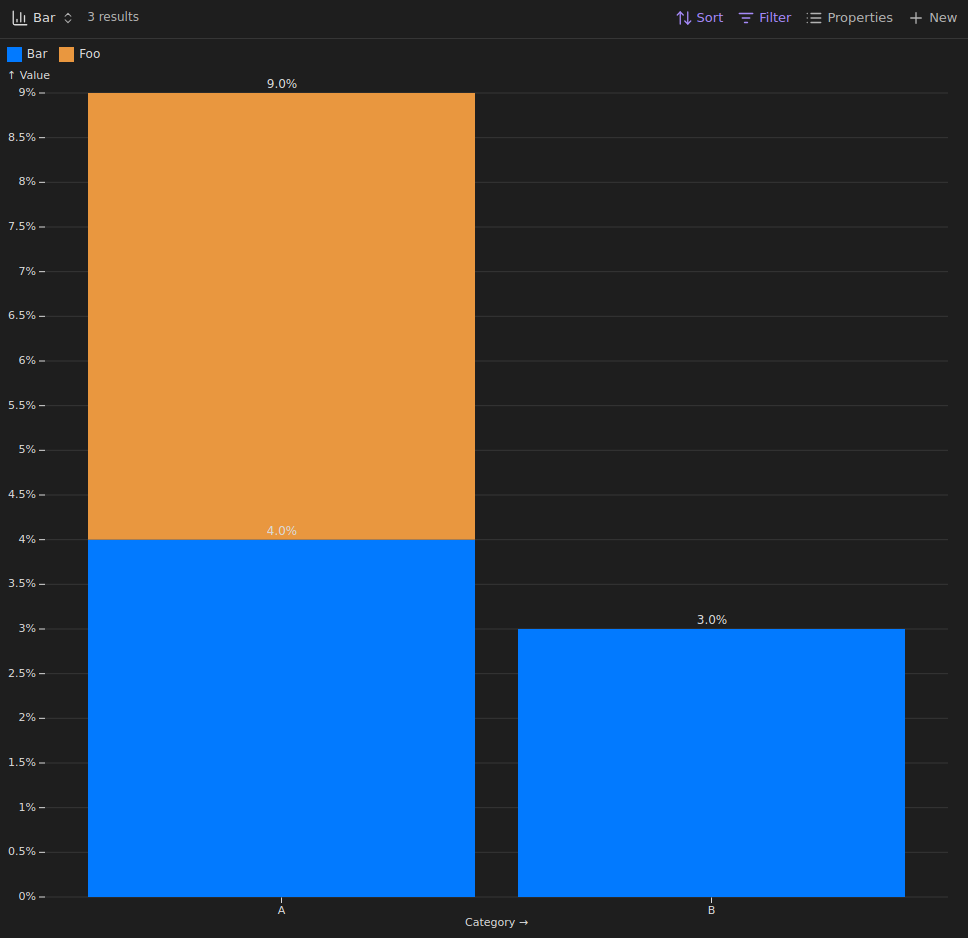
Bar Charts
Installation
Currently only via BRAT.
License
Contributions
Thank you for wanting to contribute to this project.
Contributions are always welcome. If you have an idea, feel free to open a feature request under the issue tab or even create a pull request.