Contribution Graph
 vran-dev54k downloads
Generate an interactive heatmap to visualize and track your productivity.
- Overview
- Scorecard
- Updates12
English | 中文文档
What
Contribution Graph is a plugin for obsidian.md which can generate interactive heatmap graphs like GitHub to track your notes, habits, activity, history, and so on.
Use Cases
- Habit Tracker: Count the number of tasks you complete every day. Different numbers will be marked in different colors.
- Note Tracker: Count the number of notes you create every day. Different numbers will be marked in different colors.
- Review Report: Count your notes or tasks for a certain period of time and generate a heat map for a more intuitive review
- and more...
Quick Start
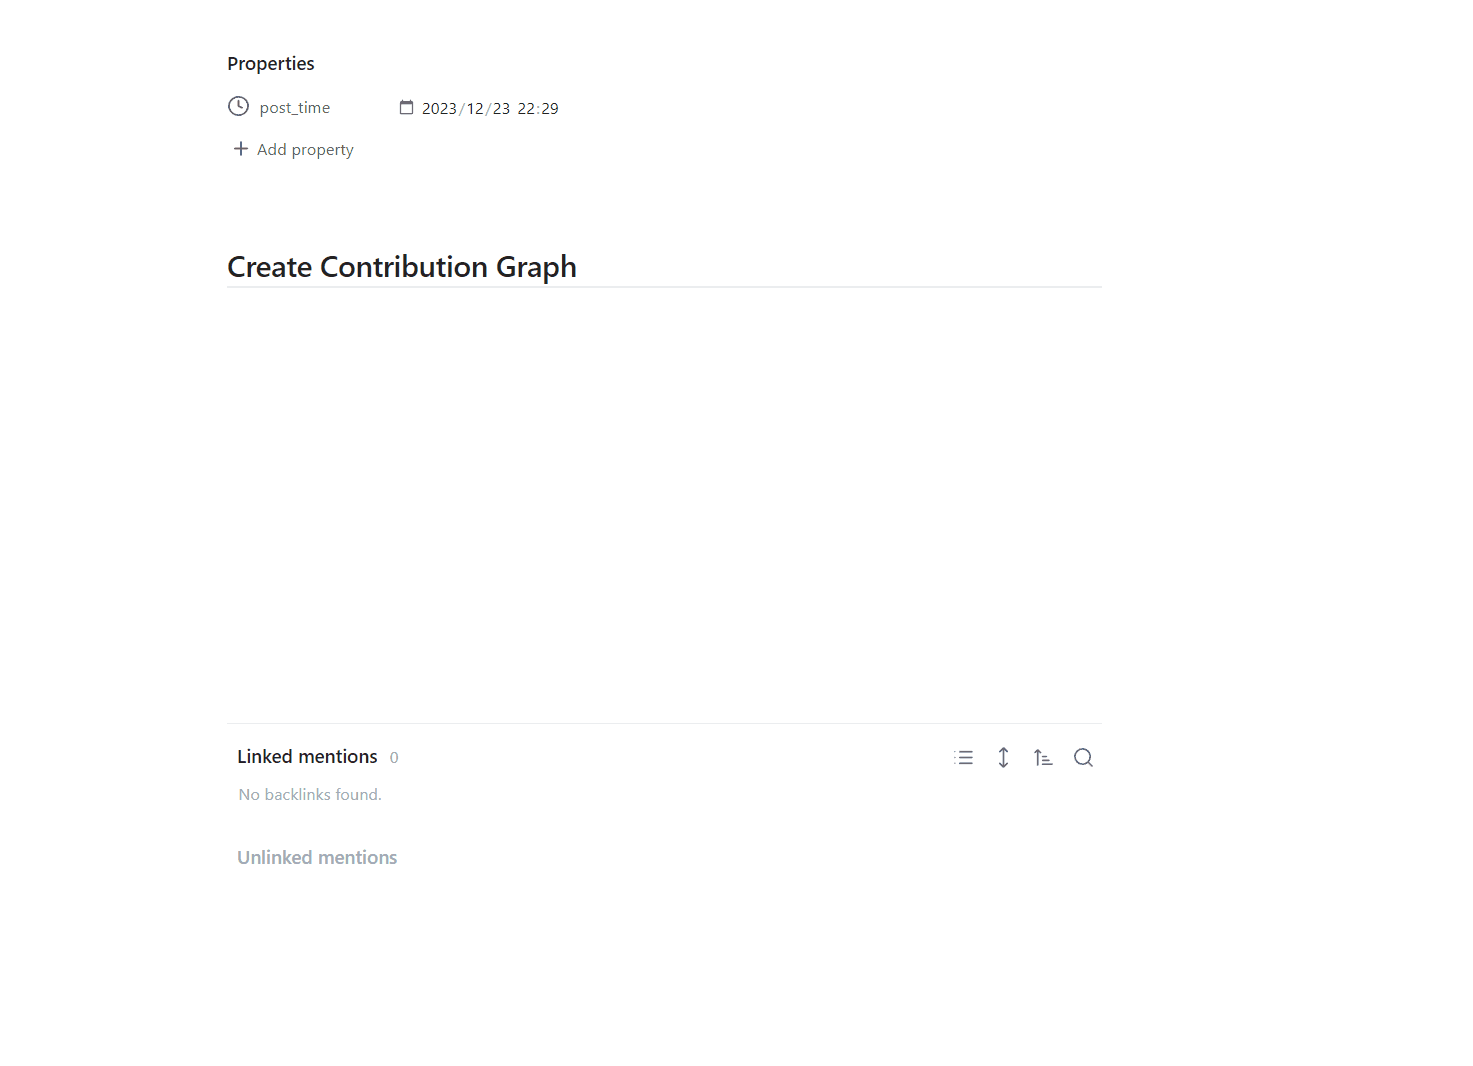
- Create empty note, then right-click
- Select Add Heatmap options
- Click the
savebutton, and then a heatmap will be created in note.
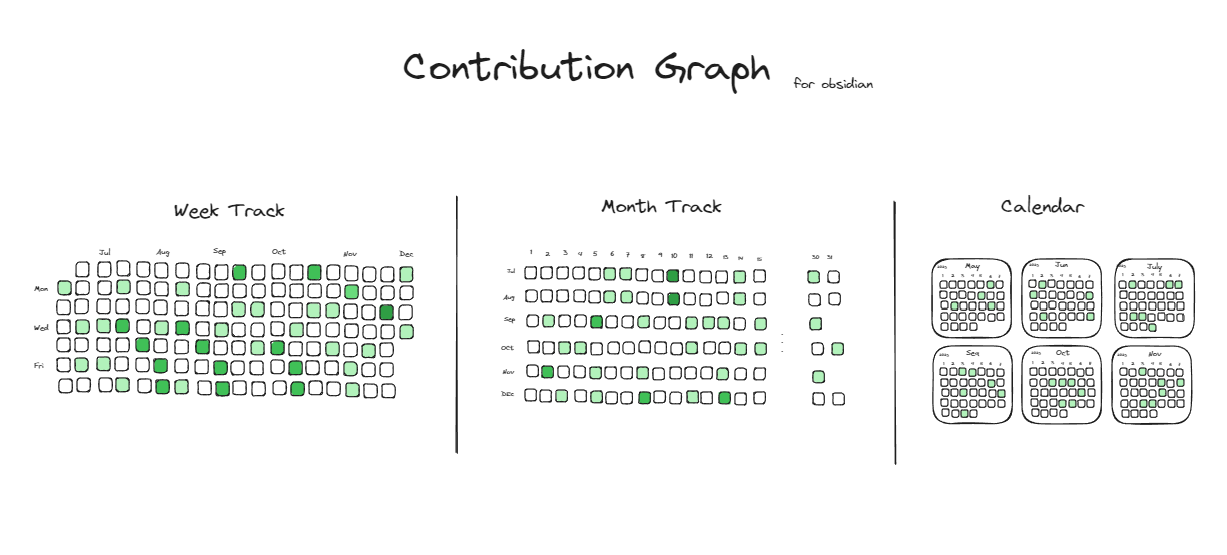
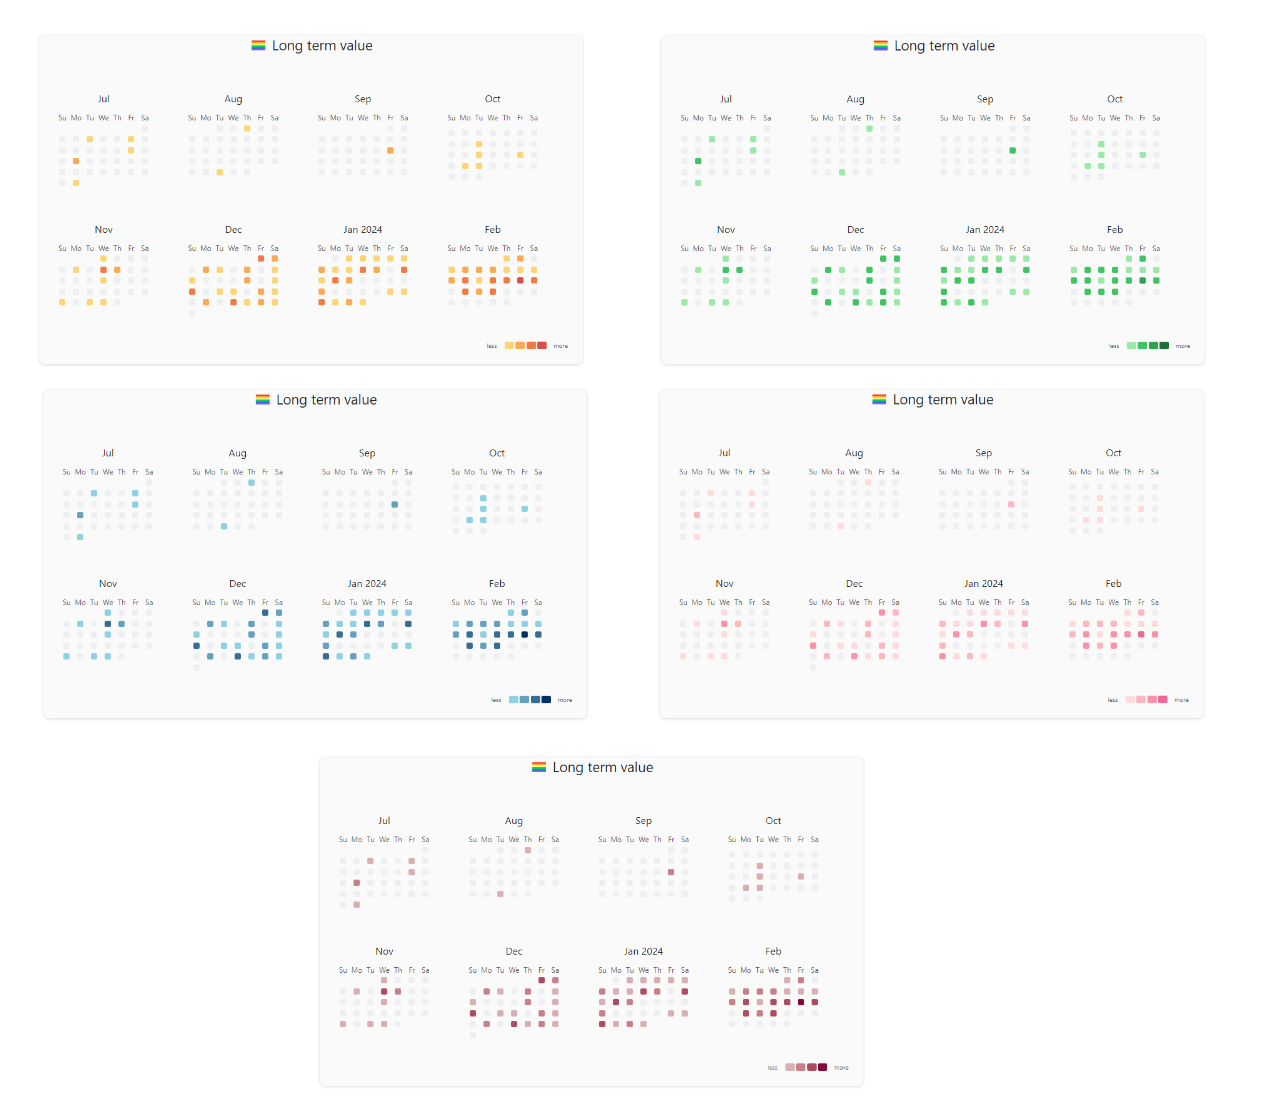
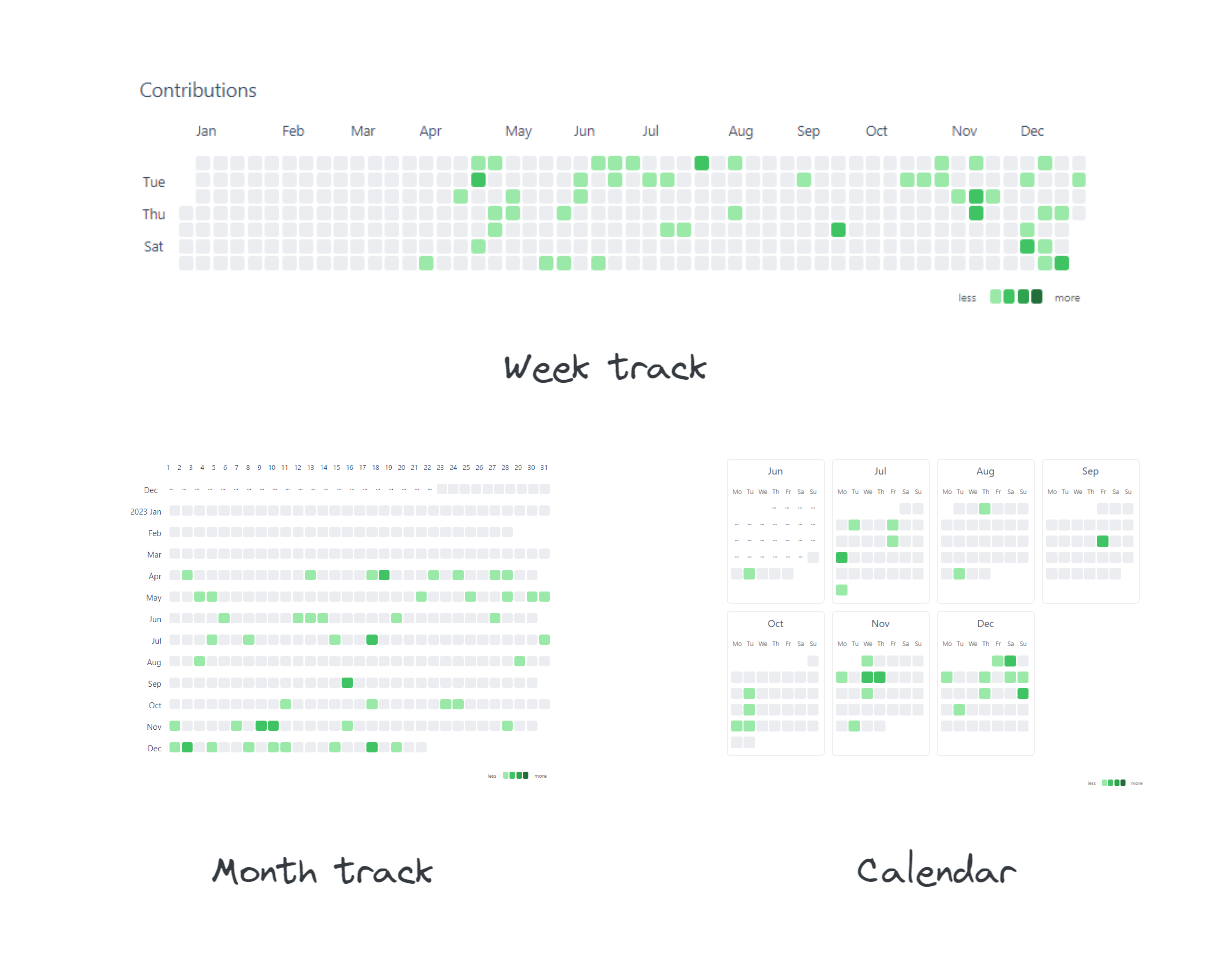
Themes
- Git Style
- Month Track
- Calendar
Features
- Multiple graph types, support week-track(default), month-track, and calendar view.
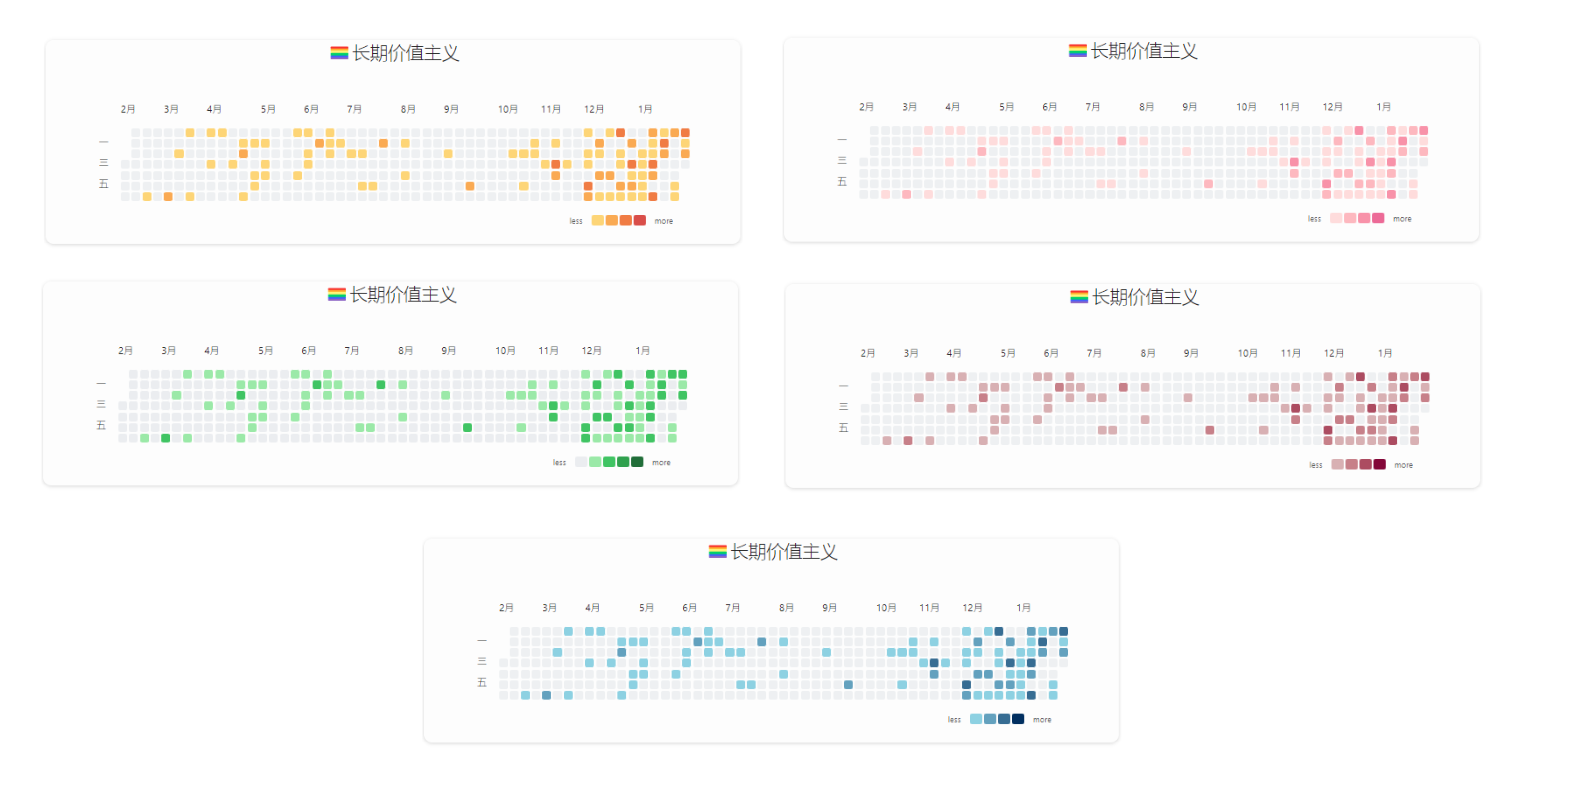
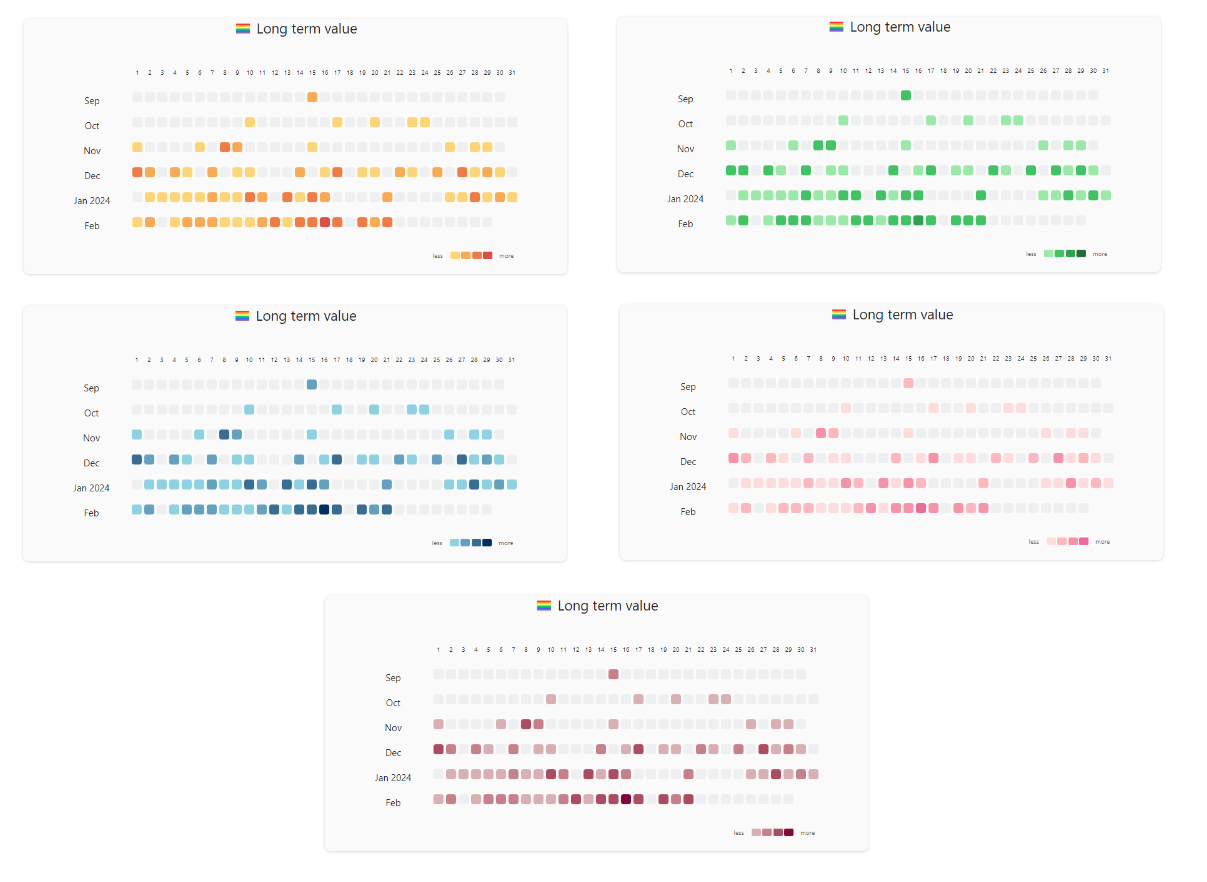
- Personalized style, you can configure cell colors and fill cells with emojis.
- Customizable dates,use fixed date range or latest date to generate graph
- Interactive charts, you can customize cell click event, hover to show statistic data
- Integrate with DataviewJS, use contribution graph's api to dynamically render charts
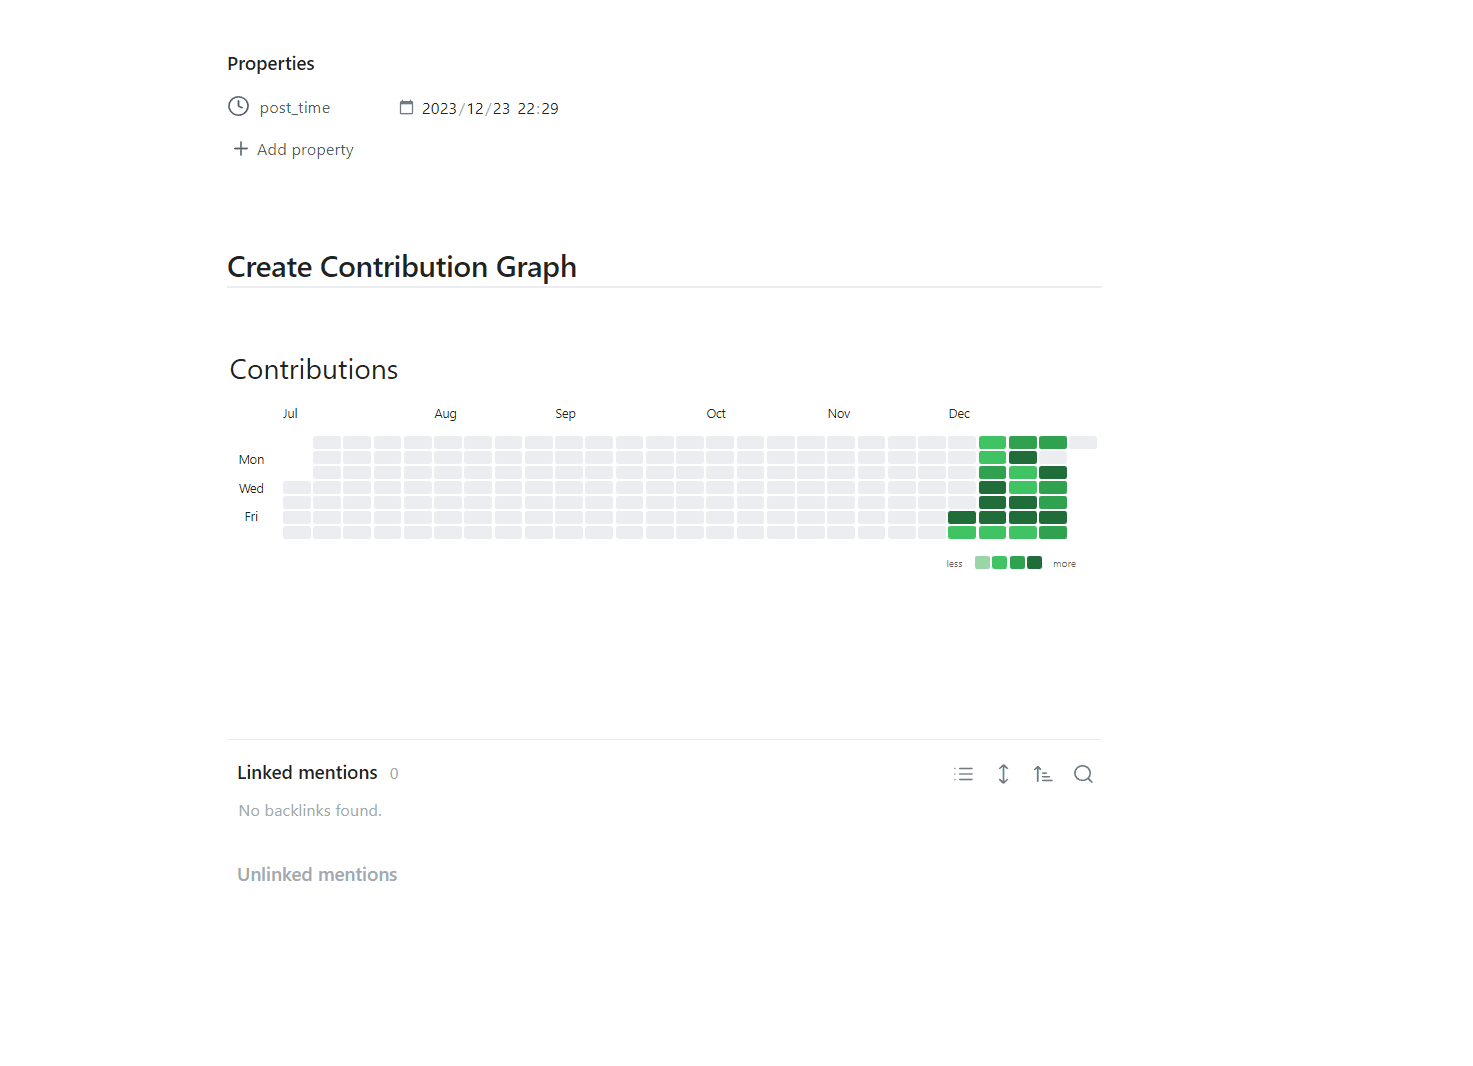
How to Modify Graph?
Just click the edit button at top right corner
Configurations
| name | description | type | default | sample | required |
|---|---|---|---|---|---|
| title | the title of the graph | string | Contributions | false | |
| titleStyle | the style of the title | object | false | ||
| days | Maximum number of days for the chart to display (starting from today) | number | 365 | true if miss fromDate and toDate | |
| fromDate | The start date of the chart | date, format yyyy-MM-dd | 2023-01-01 | true if miss days | |
| toDate | The end date of the chart | date, format yyyy-MM-dd | 2023-12-31 | true if miss days | |
| query | dataview query syntax, contribution graph will use it to count files | string | true | ||
| dateField | Date attributes of files used for data distribution | string | file.ctime | createTime | false |
| startOfWeek | start of week | number | 0 | false | |
| showCellRuleIndicators | Control the display and hiding of cell rule indicator elements | boolean | true | false | |
| cellStyleRules | cell style rule | array | false |
More Usage Guides
HealthGood
ReviewCaution
About
Generate interactive heatmap graphs like GitHub to track notes, habits, activity and history with daily counts shown in color-coded cells. Customize views (week, month, calendar), colors or emoji fills, date ranges and interactive cell click/hover behavior, and render graphs dynamically with DataviewJS.Details
Current version
0.10.0
Last updated
2 years ago
Created
3 years ago
Updates
12 releases
Downloads
54k
Compatible with
Obsidian 1.3.0+
Platforms
Desktop, Mobile
License
Apache-2.0
Sponsor