Gantt Tracker
 surranov454 downloads
Gantt charts for real project tracking: plan vs actual bars, automatic highlighting of delays, early finishes and pauses, vacation and day-off columns, per-day comments, sticky headers. Configured with a simple YAML code block.
- Overview
- Scorecard
- Updates4
Gantt charts for living with a plan, not just drawing one. A single code block turns YAML into a day-by-day chart of planned vs actual work — with delays, early finishes, pauses, vacations and per-day comments highlighted automatically.
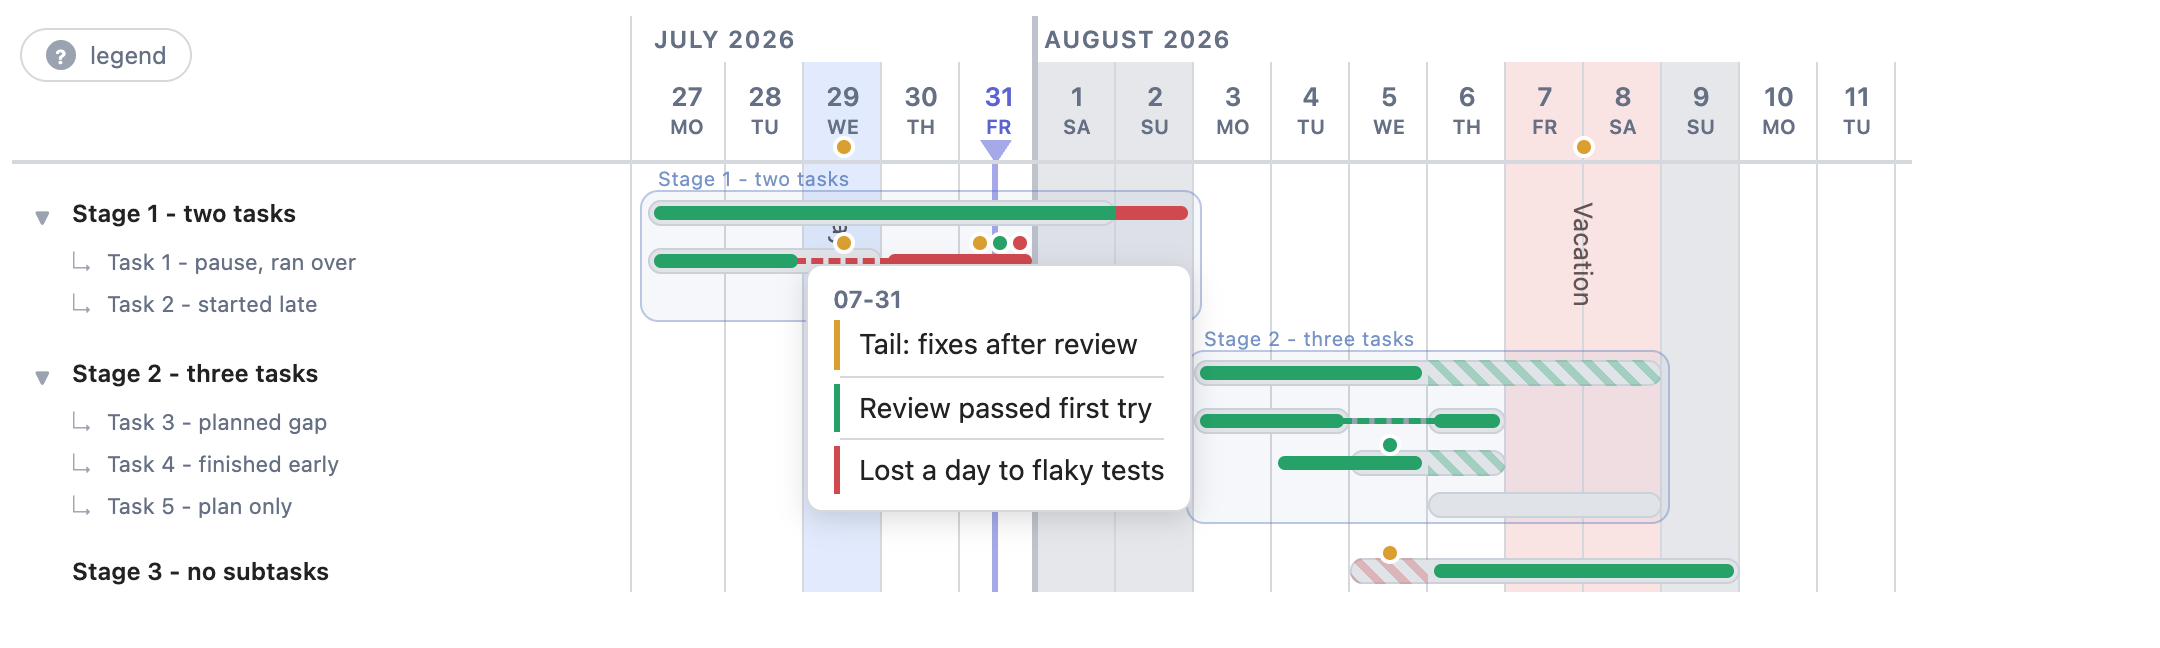
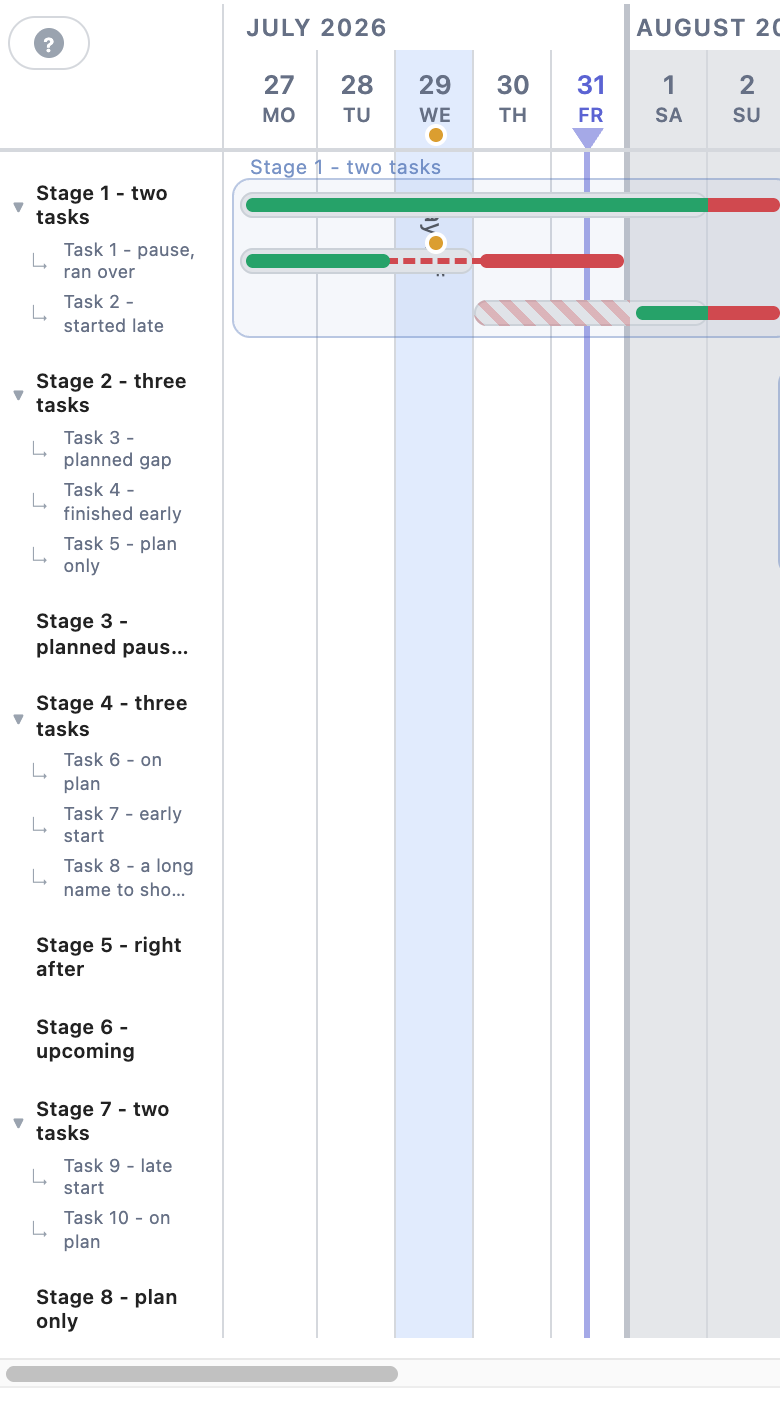
The same chart on a phone: compact sidebar, everything works by tap.
Why another gantt plugin?
Most gantt tools render a plan once. Gantt Tracker is built for tracking execution: you set the plan per stage, then append the actual dates day by day. The chart answers at a glance: where am I behind, where ahead, why did that slip happen, and how does my vacation cut the timeline.
- Plan vs actual on every row — the plan is a pill, the actual is a bar inside it.
- Automatic deviation coloring — nothing to mark up by hand:
- actual outside the plan → red;
- late start / early finish → red / green hatching on the plan;
- unplanned pause → red dashes, planned gap → neutral dashes;
- a plan with no actuals → overdue days (before today) hatched red.
- Stages with subtasks — frames around groups, sticky stage titles, touch-friendly collapse/expand.
- Background events — vacations, days off, releases: full-height tinted columns with their own comments; hover or tap a date to raise the event above the chart.
- Per-day comments — up to three typed notes per day (neutral, positive, negative) as colored dots; click opens a centered card in data order, multi-line text supported.
- Today line — with intraday position mapped to your working hours.
- Navigation — sticky sidebar and month headers, click a label to scroll to its bars.
Advantages
- Zero dependencies — no Dataview, no libraries, no build step; one
main.js+ onestyles.css. - Fully offline — nothing leaves your vault, no network requests at all.
- Plain text in, plain text out — the config is YAML inside your note; readable in any editor, friendly to git and sync.
- Mobile friendly — works on Obsidian mobile; the sidebar compacts itself on narrow screens.
- Theme-aware — colors derive from Obsidian CSS variables; event tints are translucent and read well in light and dark themes.
- AI-agent friendly — the format is documented in FORMAT.md and AGENTS.md, shipped inside the plugin folder so an agent working in your vault finds them instantly.
- Fast — a full board renders in about a millisecond.
Who is it for
- Developers and leads running a personal plan for a project: estimate stages, log actuals daily, see slippage before it bites.
- Anyone who liked Mermaid gantt but needs actuals, comments and day-level tracking on top of the plan.
- People who keep project journals in Obsidian and want the timeline to live next to the notes that explain it.
Quick start
Create a code block with the gantt-tracker language:
```gantt-tracker
start: 2026-07-27
days: 14
rows:
  - label: Stage 1 Design - 15h
    plan: [2026-07-27, 2026-07-29]
    fact: [2026-07-27, 2026-07-30]
  - label: Stage 2 Build - 12h
    plan: [2026-07-30, 2026-08-04]
```
Full example (every feature)
```gantt-tracker
start: 2026-07-27       # first day of the window
days: 14                # number of day columns
timezone: Europe/Moscow # today line clock (default: local)
events:
  - label: Vacation
    start: 2026-08-07
    end: 2026-08-08
    note: Approved before the project started
  - label: Day off
    start: 2026-07-29
    end: 2026-07-29
    color: blue         # red green blue gray purple yellow, or any CSS color
    note: Family day
rows:
  - label: Stage 1 - two tasks
    plan: [2026-07-27, 2026-08-01]
    fact: [2026-07-27, 2026-08-02]        # ran one day over: red tail
    children:
      - label: Task 1 - pause, ran over
        plan: [2026-07-27, 2026-07-29]
        fact: [[2026-07-27, 2026-07-28], [2026-07-30, 2026-07-31]]
        notes:
          "2026-07-29": "Pause: pulled into a production incident"
          "2026-07-31":
            neutral: "Tail: fixes after the security review"
            good: "Review passed first try"
            bad: "Lost a day to flaky tests"
      - label: Task 2 - started late
        plan: [2026-07-30, 2026-08-01]    # red hatch before the actual start
        fact: [2026-08-01, 2026-08-02]
  - label: Stage 2 - three tasks
    plan: [2026-08-03, 2026-08-08]
    fact: [2026-08-03, 2026-08-05]        # green hatch on the leftover plan
    children:
      - label: Task 3 - planned gap
        plan: [[2026-08-03, 2026-08-04], [2026-08-06, 2026-08-06]]
        fact: [[2026-08-03, 2026-08-04], [2026-08-06, 2026-08-06]]
      - label: Task 4 - started and finished early
        plan: [2026-08-05, 2026-08-06]
        fact: [2026-08-04, 2026-08-05]    # early start stays green
      - label: Task 5 - plan only, not started
        plan: [2026-08-06, 2026-08-08]    # overdue days get red hatching
  - label: Stage 3 - no subtasks
    plan: [2026-08-05, 2026-08-09]
    fact: [2026-08-06, 2026-08-09]
```
The complete field reference lives in FORMAT.md.
Gantt Tracker vs Mermaid gantt
| Mermaid | Gantt Tracker | |
|---|---|---|
| Plan | one set of bars | plan and actual per row |
| Deviations | — | automatic red/green coloring and hatching |
| Context | — | per-day comments, background events |
| Interaction | static SVG | comment cards, collapse/expand, scroll-to-row, event raise |
| Scheduling | after, business-day durations |
explicit dates (that's the point of tracking) |
Mermaid is great for sketching a plan in a minute. Gantt Tracker is for the month you spend executing it.
For AI agents
If you are an AI agent asked to update a chart: read AGENTS.md and FORMAT.md — both are shipped inside .obsidian/plugins/gantt-tracker/ in every vault, next to main.js. The chart config is plain YAML in a ```gantt-tracker code block; coloring is derived, never written by hand.
Install
From the community store: Settings → Community plugins → Browse, search for “Gantt Tracker” (or open the listing), install and enable. Requires Obsidian 1.8+.
Manual alternative: copy main.js, styles.css and manifest.json from the latest release into <vault>/.obsidian/plugins/gantt-tracker/ and enable Gantt Tracker in Settings → Community plugins.