TSDB
 Daniel Grossmann-Kavanagh1k downloads
Local time series database for storing your plugin's metrics. Embed real-time charts into your notes with PromQL.
- Overview
- Scorecard
- Updates15
TSDB is a local time-series database for Obsidian. It records metrics from this vault and from other plugins, stores them in SQLite-backed browser storage, and renders live charts from PromQL code blocks in notes.
The main workflow stays inside Obsidian: collect local metrics, query the local database, pin a time range while investigating, and keep dashboards as Markdown notes. Prometheus HTTP serving and external endpoint scraping are available in advanced settings.
Use TSDB in Obsidian
Select the ribbon icon or run Open metrics dashboard to view the built-in dashboard. Select Edit in my vault to create a Markdown dashboard note that you can edit like any other note.
TSDB records from these sources:
- Vault metrics: file operations, note counts, vault size, open notes, enabled plugins, and note view duration.
- Performance metrics: browser memory usage and selected Obsidian API timings.
- Plugin metrics: metrics registered by other Obsidian plugins.
- Prometheus scrape targets: optional external exposition endpoints.
The charting layer, dashboard, and optional HTTP API all query the same local database.
Storage
TSDB records metric samples into a SQLite database using wa-sqlite. The
database runs in a worker and persists in OPFS (Origin Private File System),
the browser-managed storage area available to Obsidian's renderer.
Metric data lives in OPFS, separate from the plugin files.
Each scrape batch is committed as a SQLite transaction. Retention pruning keeps the database within the configured history window. The default retention is 30 days; change it in Settings -> Community plugins -> TSDB -> Database.
Charting in notes
TSDB registers a promql Markdown code block processor. Add a fenced block to
any note and it renders as a live panel backed by the local database.
Time series
```promql
query: sum by (operation) (rate(obsidian_file_operations_total[5m]))
title: File operations per second
legend: "{{operation}}"
range: 3h
refresh: 30s
```
Stat
```promql
query: obsidian_vault_notes_total
type: stat
title: Notes
refresh: 60s
```
Table
```promql
query: scrape_samples_scraped
type: table
title: Scrape samples
refresh: 30s
```
Panel options:
query: a PromQL expression.queries: multiple expressions with optionallegendvalues.type:timeseries,stat, ortable.title: panel title.range: time range for time series panels, such as1hor3h.step: query step; omitted means automatic.refresh: refresh interval; omitted means render once.unit: display unit, includingbytes.legend: label template such as{{operation}} on {{instance}}.min,max,height: chart display controls.
Time range selection
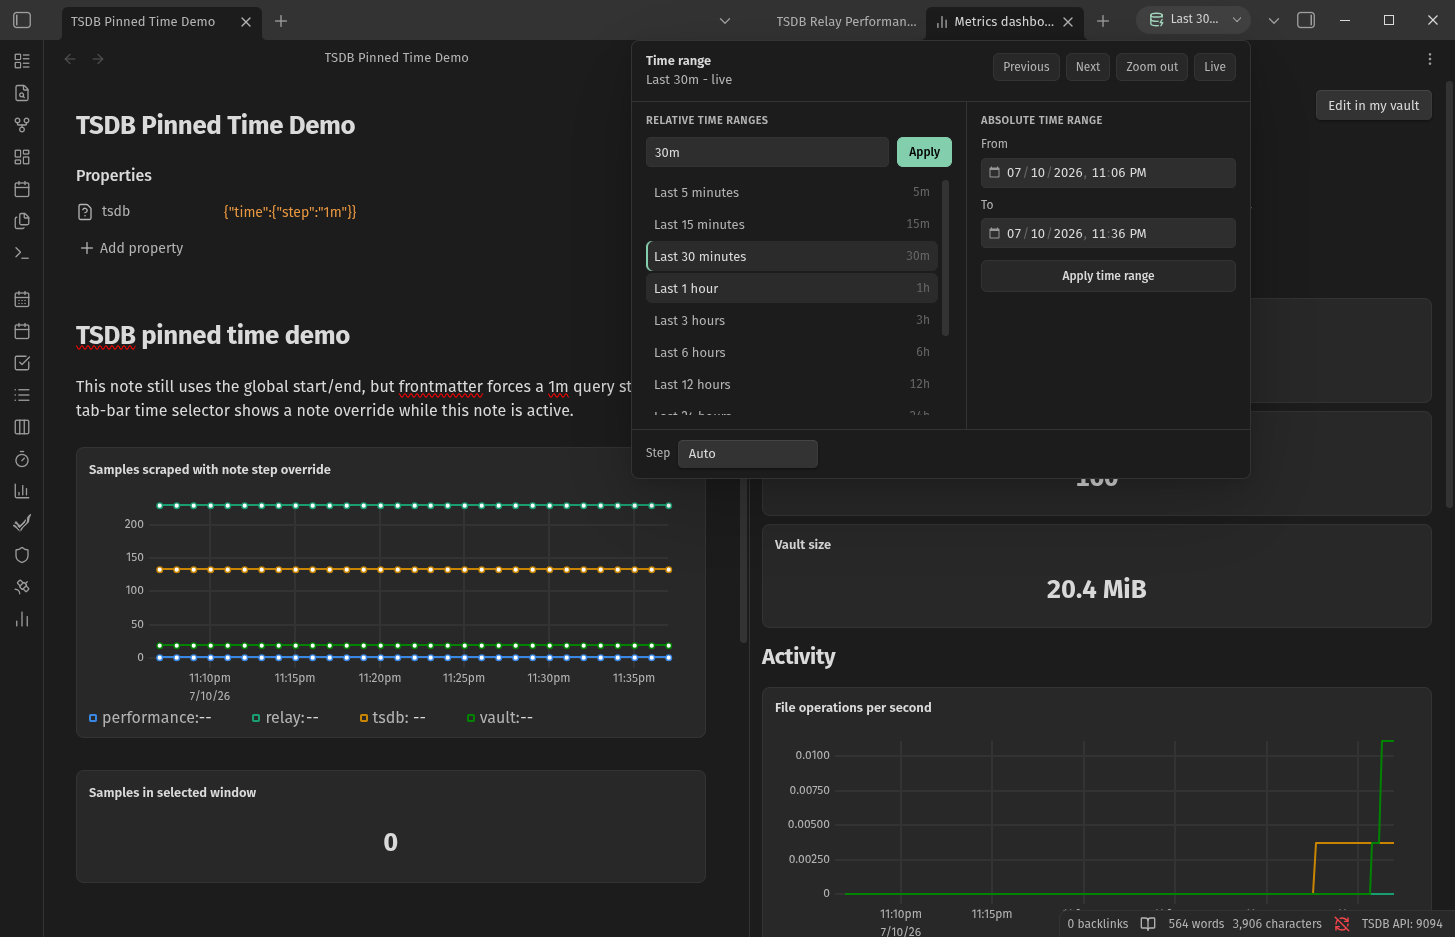
PromQL panels use the active dashboard time range. The selector lives in the workspace tab bar, next to Obsidian's view controls, so the same investigation window follows you across TSDB dashboard notes.
Dashboard frontmatter can pin a note to a specific query window:
tsdb:
  time:
    start: "2026-07-10T23:06:00-07:00"
    end: "2026-07-10T23:36:00-07:00"
    step: 1m
Pinned notes still use the global selector UI. The pinned values apply while that note is active.
Querying
The charting layer and dashboard query the local TSDB directly. The same engine also powers the optional Prometheus-compatible HTTP API.
Supported PromQL subset:
- Selectors with
=,!=,=~,!~, range selectors such as[5m], andoffset. rate,irate,increase,delta,idelta,changes,resets, and*_over_timefunctions for avg, min, max, sum, count, last, present, stddev, stdvar, and quantile.histogram_quantile,abs,ceil,floor,round,sqrt,exp,ln,log2,log10,sgn,clamp,clamp_min,clamp_max,scalar,vector,time,absent,sort, andsort_desc.- Aggregations:
sum,avg,min,max,count,stddev,stdvar,quantile,topk, andbottomkwithbyandwithout. - Binary operators: arithmetic, comparisons including
bool,and,or,unless, and one-to-one vector matching withonandignoring.
Unsupported PromQL features include subqueries, @ modifiers, group_left,
group_right, label_replace, and label_join.
Plugin registration
Other plugins register metrics by claiming a named store. A store is recorded
into the local database at its own interval, and the store name becomes the
job label for stored samples.
Copy obsidian-metrics.d.ts into your plugin for type-safe access.
import { Plugin } from "obsidian";
import {
    IObsidianMetricsRootAPI,
    IObsidianMetricsAPI,
    MetricInstance,
    ObsidianMetricsPlugin,
} from "./obsidian-metrics";

export default class MyPlugin extends Plugin {
    private metrics: IObsidianMetricsAPI | undefined;
    private documentSize: MetricInstance | undefined;

    async onload() {
        this.registerEvent(
            this.app.workspace.on("tsdb:ready", (api: IObsidianMetricsRootAPI) => {
                this.registerMetrics(api);
            })
        );

        const tsdb = this.app.plugins.plugins["tsdb"] as
            | ObsidianMetricsPlugin
            | undefined;
        if (tsdb?.api) {
            this.registerMetrics(tsdb.api);
        }
    }

    private registerMetrics(rootApi: IObsidianMetricsRootAPI) {
        const api = rootApi.getStore("my-plugin", {
            intervalSeconds: 30,
            displayName: "My plugin metrics",
            description: "Document size and activity metrics.",
        });

        this.metrics = api;
        this.documentSize = api.createGauge({
            name: "my_document_size_bytes",
            help: "Size of documents in bytes.",
            labelNames: ["document"],
        });
    }

    updateDocumentSize(document: string, bytes: number) {
        this.documentSize?.labels({ document }).set(bytes);
    }
}
Registration is idempotent. tsdb:ready fires after Obsidian's workspace layout
and the local database are ready. If TSDB reloads, it fires again and your plugin
should recreate its store and metric references.
Metric types
TSDB exposes the familiar Prometheus metric types through prom-client:
const counter = api.createCounter({
    name: "requests_total",
    help: "Total requests.",
    labelNames: ["route"],
});
counter.inc(1, { route: "search" });

const gauge = api.createGauge({
    name: "queue_depth",
    help: "Current queue depth.",
});
gauge.set(12);

const histogram = api.createHistogram({
    name: "operation_duration_seconds",
    help: "Operation duration.",
    labelNames: ["operation"],
    buckets: [0.01, 0.05, 0.1, 0.5, 1, 5],
});
const stop = histogram.startTimer({ operation: "index" });
// do work
stop();
Convenience helpers are also available:
api.counter("button_clicks_total", "Button click count.").inc();
api.gauge("active_documents", "Open document count.", 3);
api.histogram("request_duration_seconds", "Request duration.");
Settings
Open Settings -> Community plugins -> TSDB.
Key settings:
- Sources: enable or disable local metric sources, set recording intervals, and add Prometheus scrape targets.
- Database: set retention and view the active OPFS database status.
- HTTP API: enable the local Prometheus-compatible server and set the port or port range.
- Advanced: set the metric prefix.
The HTTP server is disabled by default. Local recording and note charting do not require it.
Advanced: Prometheus interop
TSDB can both expose a Prometheus-compatible server and scrape Prometheus endpoints. These features are optional and use local HTTP by default.
Expose a Prometheus server
Enable Serve metrics over HTTP in settings to bind a local server. The
default port range is 9090-9099, so several vaults can run at the same time.
Available endpoints:
| Endpoint | Notes |
|---|---|
/metrics |
Prometheus text exposition for current in-process metrics |
/health and /-/healthy |
Health checks |
/api/v1/query |
Instant queries with query and optional time |
/api/v1/query_range |
Range queries with query, start, end, and step |
/api/v1/series |
Series discovery with match[] selectors |
/api/v1/labels |
Label name discovery |
/api/v1/label/<name>/values |
Label value discovery |
/api/v1/status/buildinfo |
Build information |
/api/v1/status/tsdb |
Local TSDB status |
/api/v1/export |
JSON-lines export |
Grafana can use TSDB as a Prometheus datasource by pointing it at the bound
base URL, for example http://localhost:9090.
Because the server can bind any port in the configured range, TSDB also exposes a Chrome DevTools Protocol helper:
window.__tsdb?.getInfo();
// { vault, vaultId, pluginVersion, serverRunning, port, metricsPath, baseUrl }
The same helper exposes getStats(), getScrapeStatuses(), query(expr), and
queryRange(expr, startMs, endMs, stepMs) for local tooling and tests.
With the worker-OPFS backend, PromQL evaluation runs in the storage worker so
only the final query result is transferred to Obsidian's renderer.
Scrape Prometheus endpoints
Add scrape targets in settings with one or more target URLs, such as:
http://localhost:9100/metrics
Each target is scraped into the local database. TSDB adds Prometheus-style
job and instance labels, preserves colliding target labels as
exported_job and exported_instance, and records synthetic scrape health
series:
upscrape_duration_secondsscrape_samples_scraped
External scraping is useful when you want Obsidian to keep a local history of a nearby app, development service, or machine exporter without running a separate Prometheus instance.
Developing this plugin
This plugin directory builds an Obsidian community plugin. The release
artifacts are main.js, manifest.json, and styles.css.
npm install
npm run build:tsdb-wasm
npm run build
npm run dev
npm test
The Wasm build uses Docker, pins Emscripten and the wa-sqlite source revision,
and installs the generated .mjs/.wasm pair into node_modules. Builds
verify that this custom artifact is present before bundling.
Run release checks with:
npm run release
main.js is a generated release artifact and is ignored by git.
Project structure
tsdb/
+-- src/
|   +-- main.ts              # Plugin lifecycle and wiring
|   +-- settings.ts          # Settings model and defaults
|   +-- labels.ts            # Label sets and matchers
|   +-- types.ts             # Public metric API types
|   +-- exporter/            # prom-client registry, public API, built-ins
|   +-- scrape/              # Exposition parser and scrape scheduler
|   +-- storage/             # wa-sqlite TSDB, OPFS worker, recovery WAL
|   +-- promql/              # PromQL AST, parser, and engine
|   +-- panels/              # Markdown panel config and rendering data
|   +-- api/                 # HTTP server and /api/v1 routes
|   +-- ui/                  # Settings, modal, and dashboard view
+-- tests/                   # Vitest suites
+-- obsidian-metrics.d.ts    # Public type declarations
+-- manifest.json            # Plugin manifest
+-- package.json             # npm scripts and dependencies
License
MIT License