Tag Size History
 zachfara9 downloads
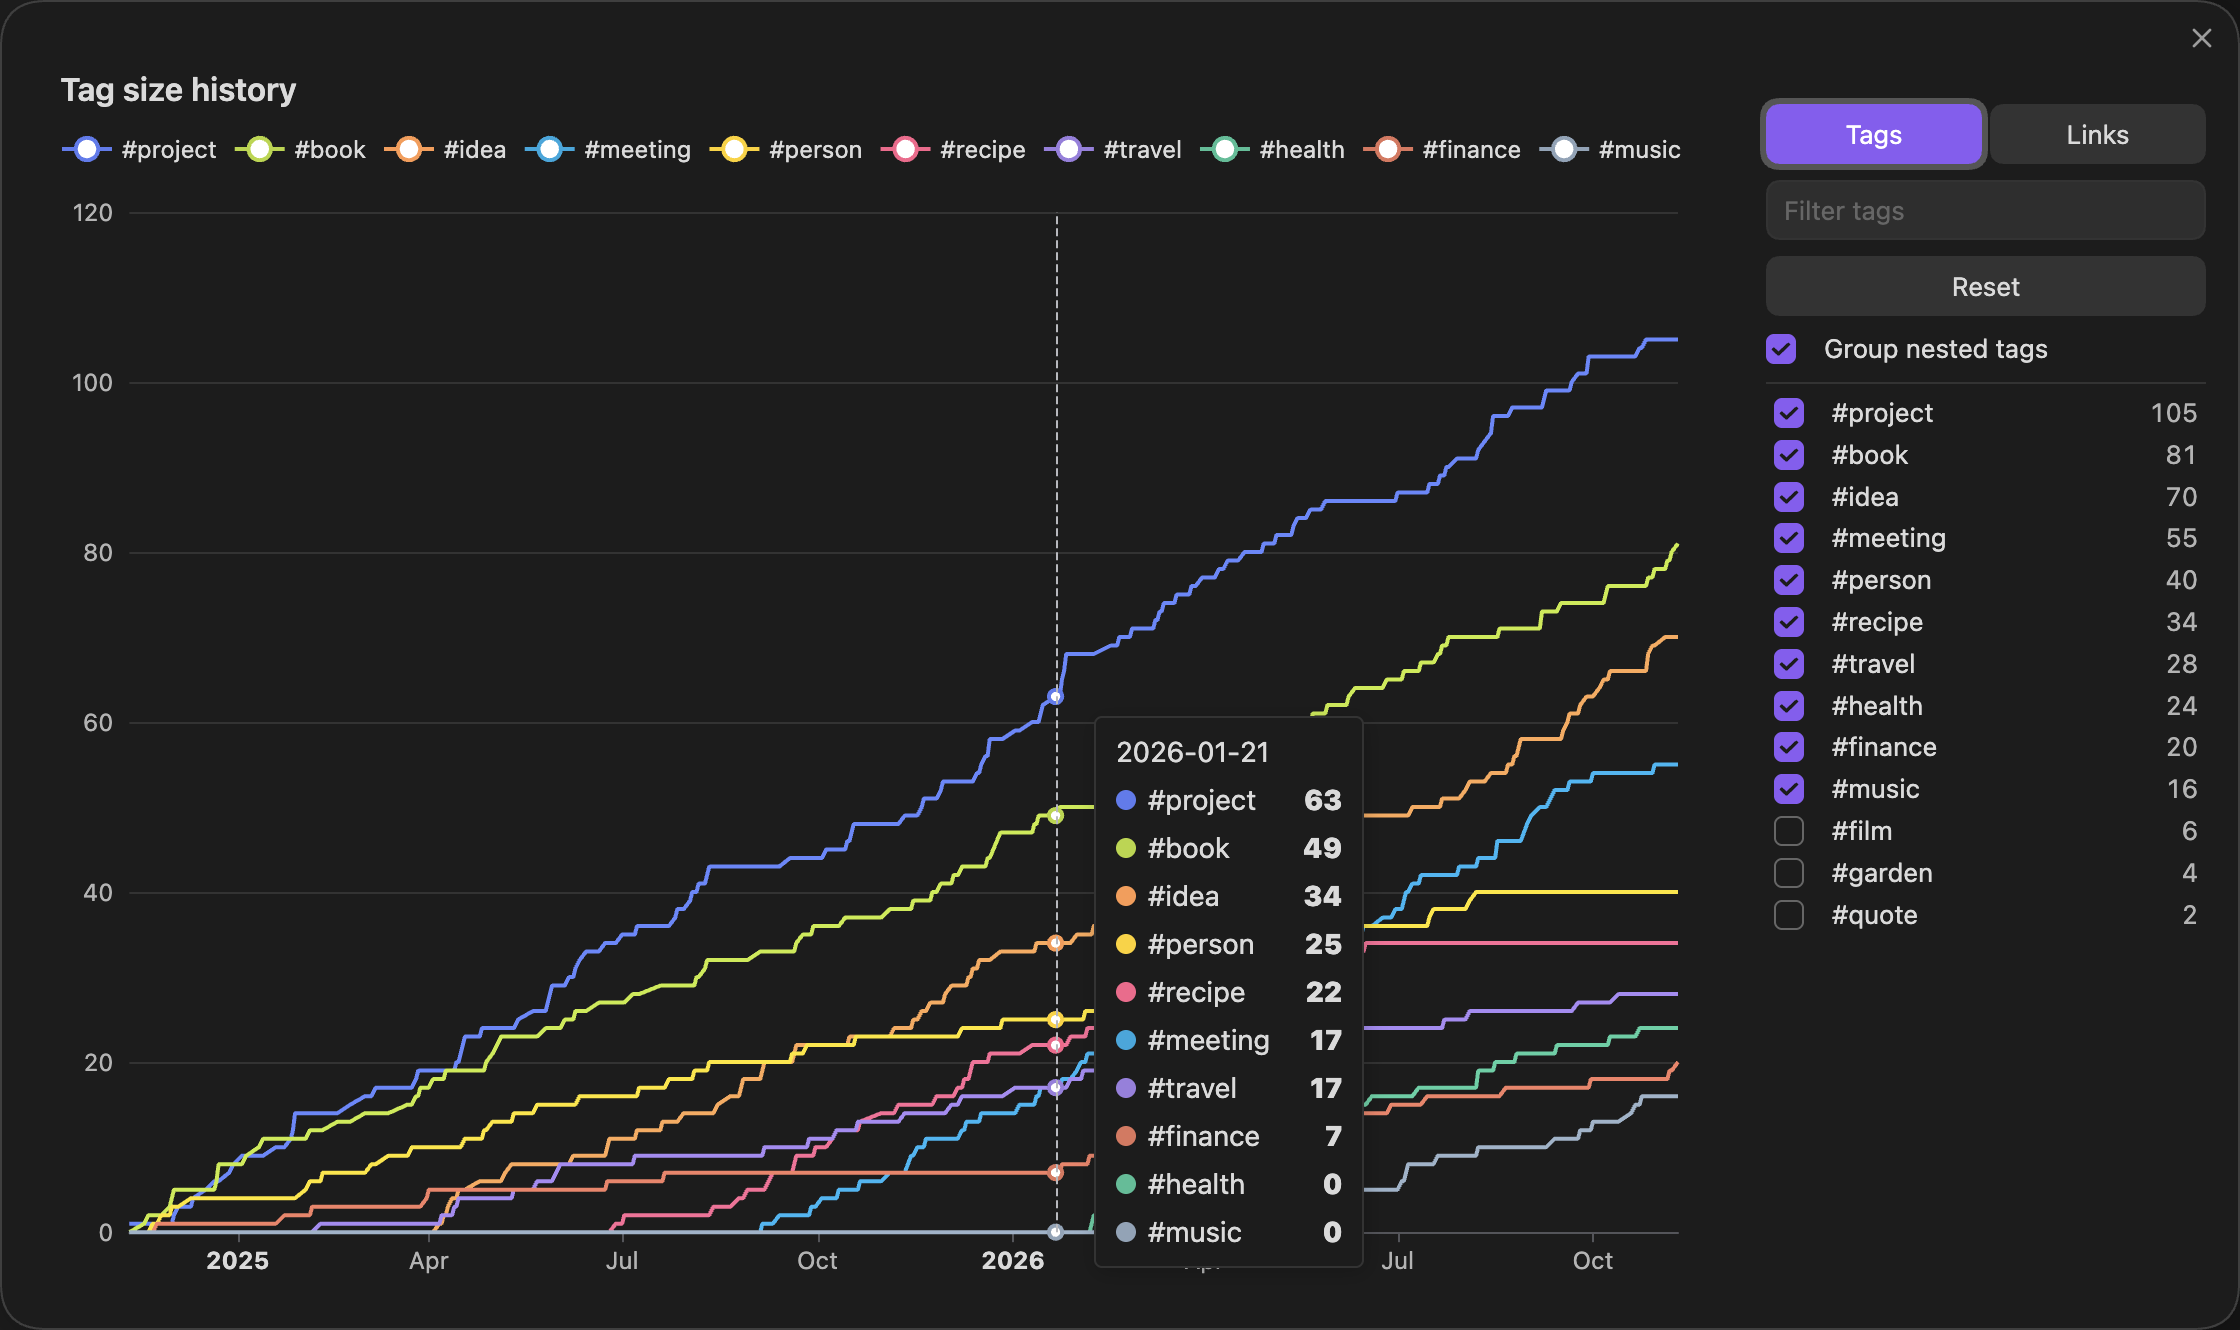
Graph of the number of notes with each tag over time.
- Overview
- Scorecard
- Updates4
See how your tags have grown. Tag Size History is an Obsidian plugin that draws one line per tag, showing how many notes carry that tag over time. It can do the same for links: one line per note, showing how many notes link to it. It is inspired by Vault Size History by Technerium.
Using it
Click the chart icon in the ribbon, or run Tag Size History: Open chart from the command palette.
- The chart starts with your ten largest tags.
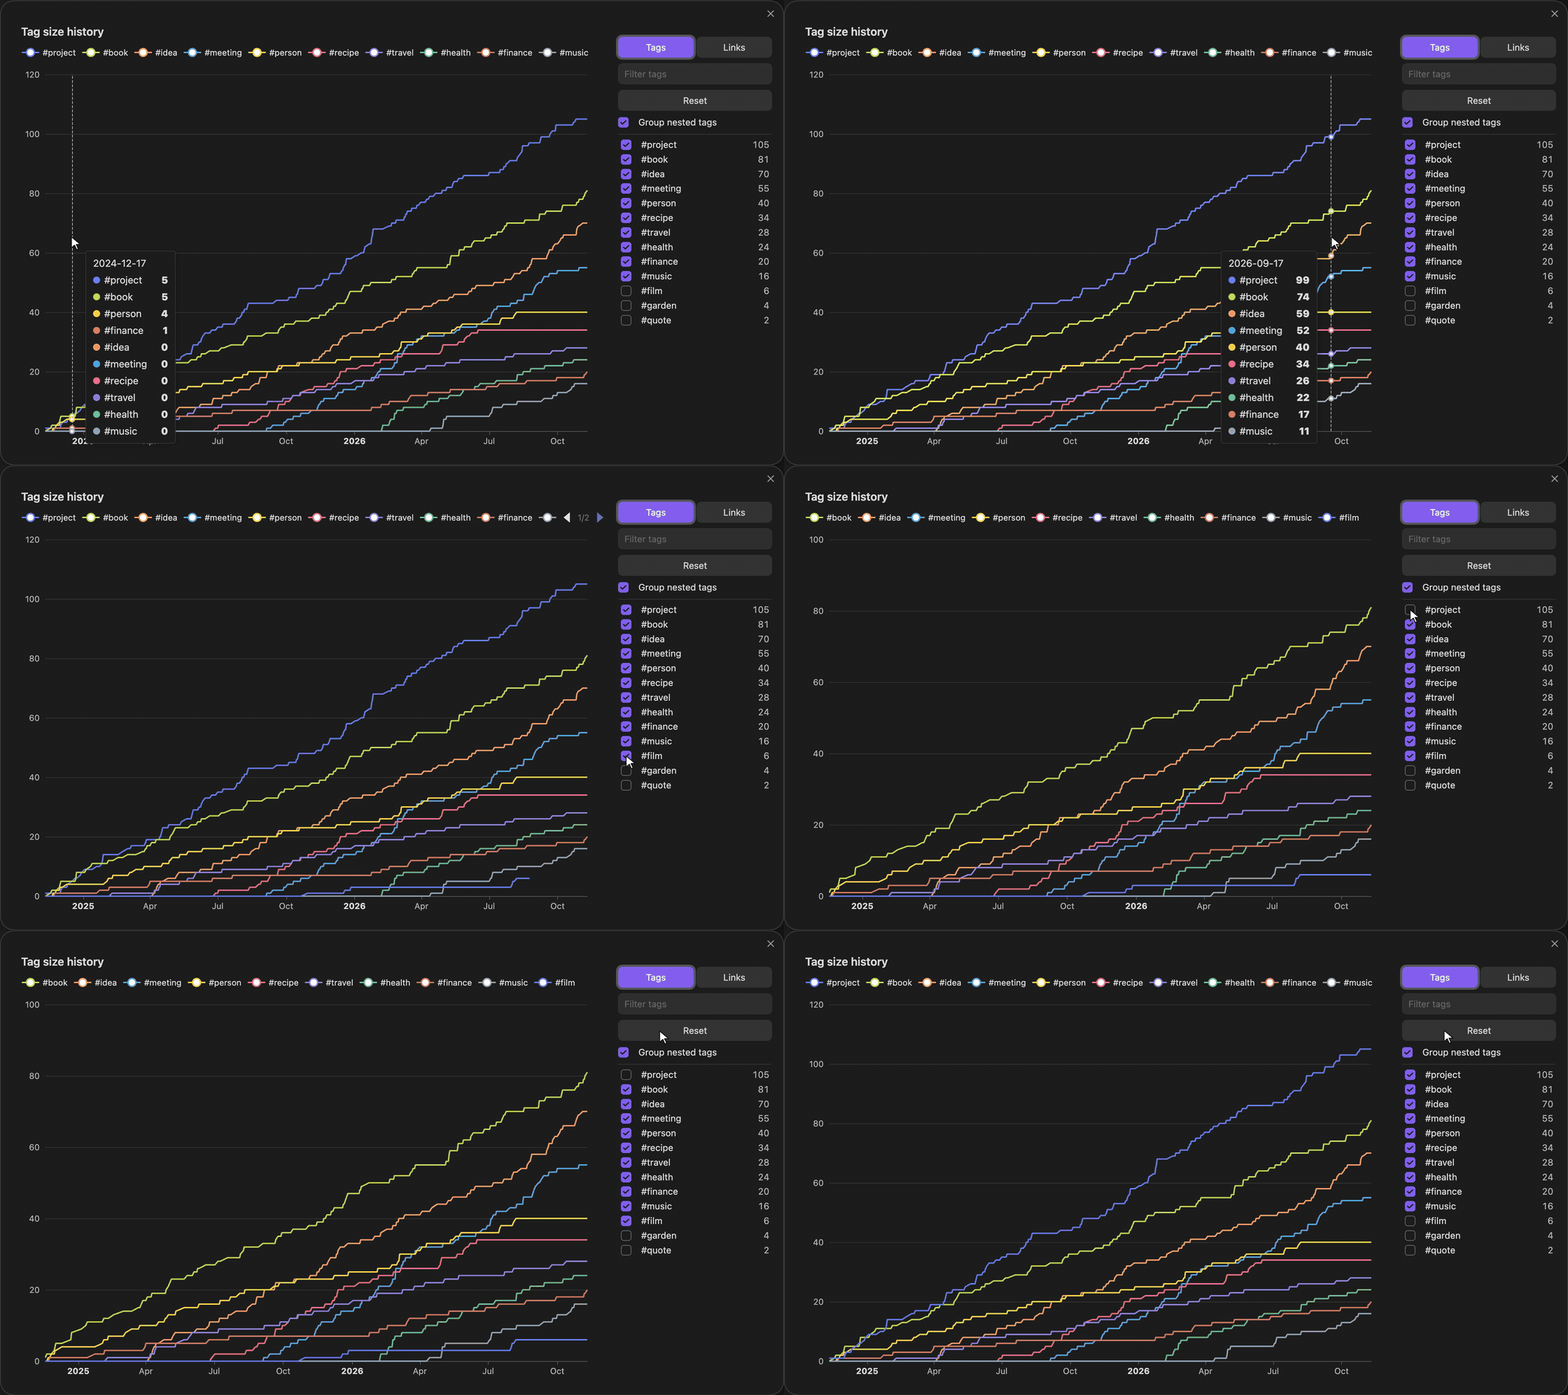
- Hover to see every tag's note count on that date.
- Use the panel on the right to switch any tag on or off. Each tag keeps its colour while others come and go. Type in the box to filter the list. Your choices are remembered. Reset goes back to the largest tags.
- Group nested tags decides how
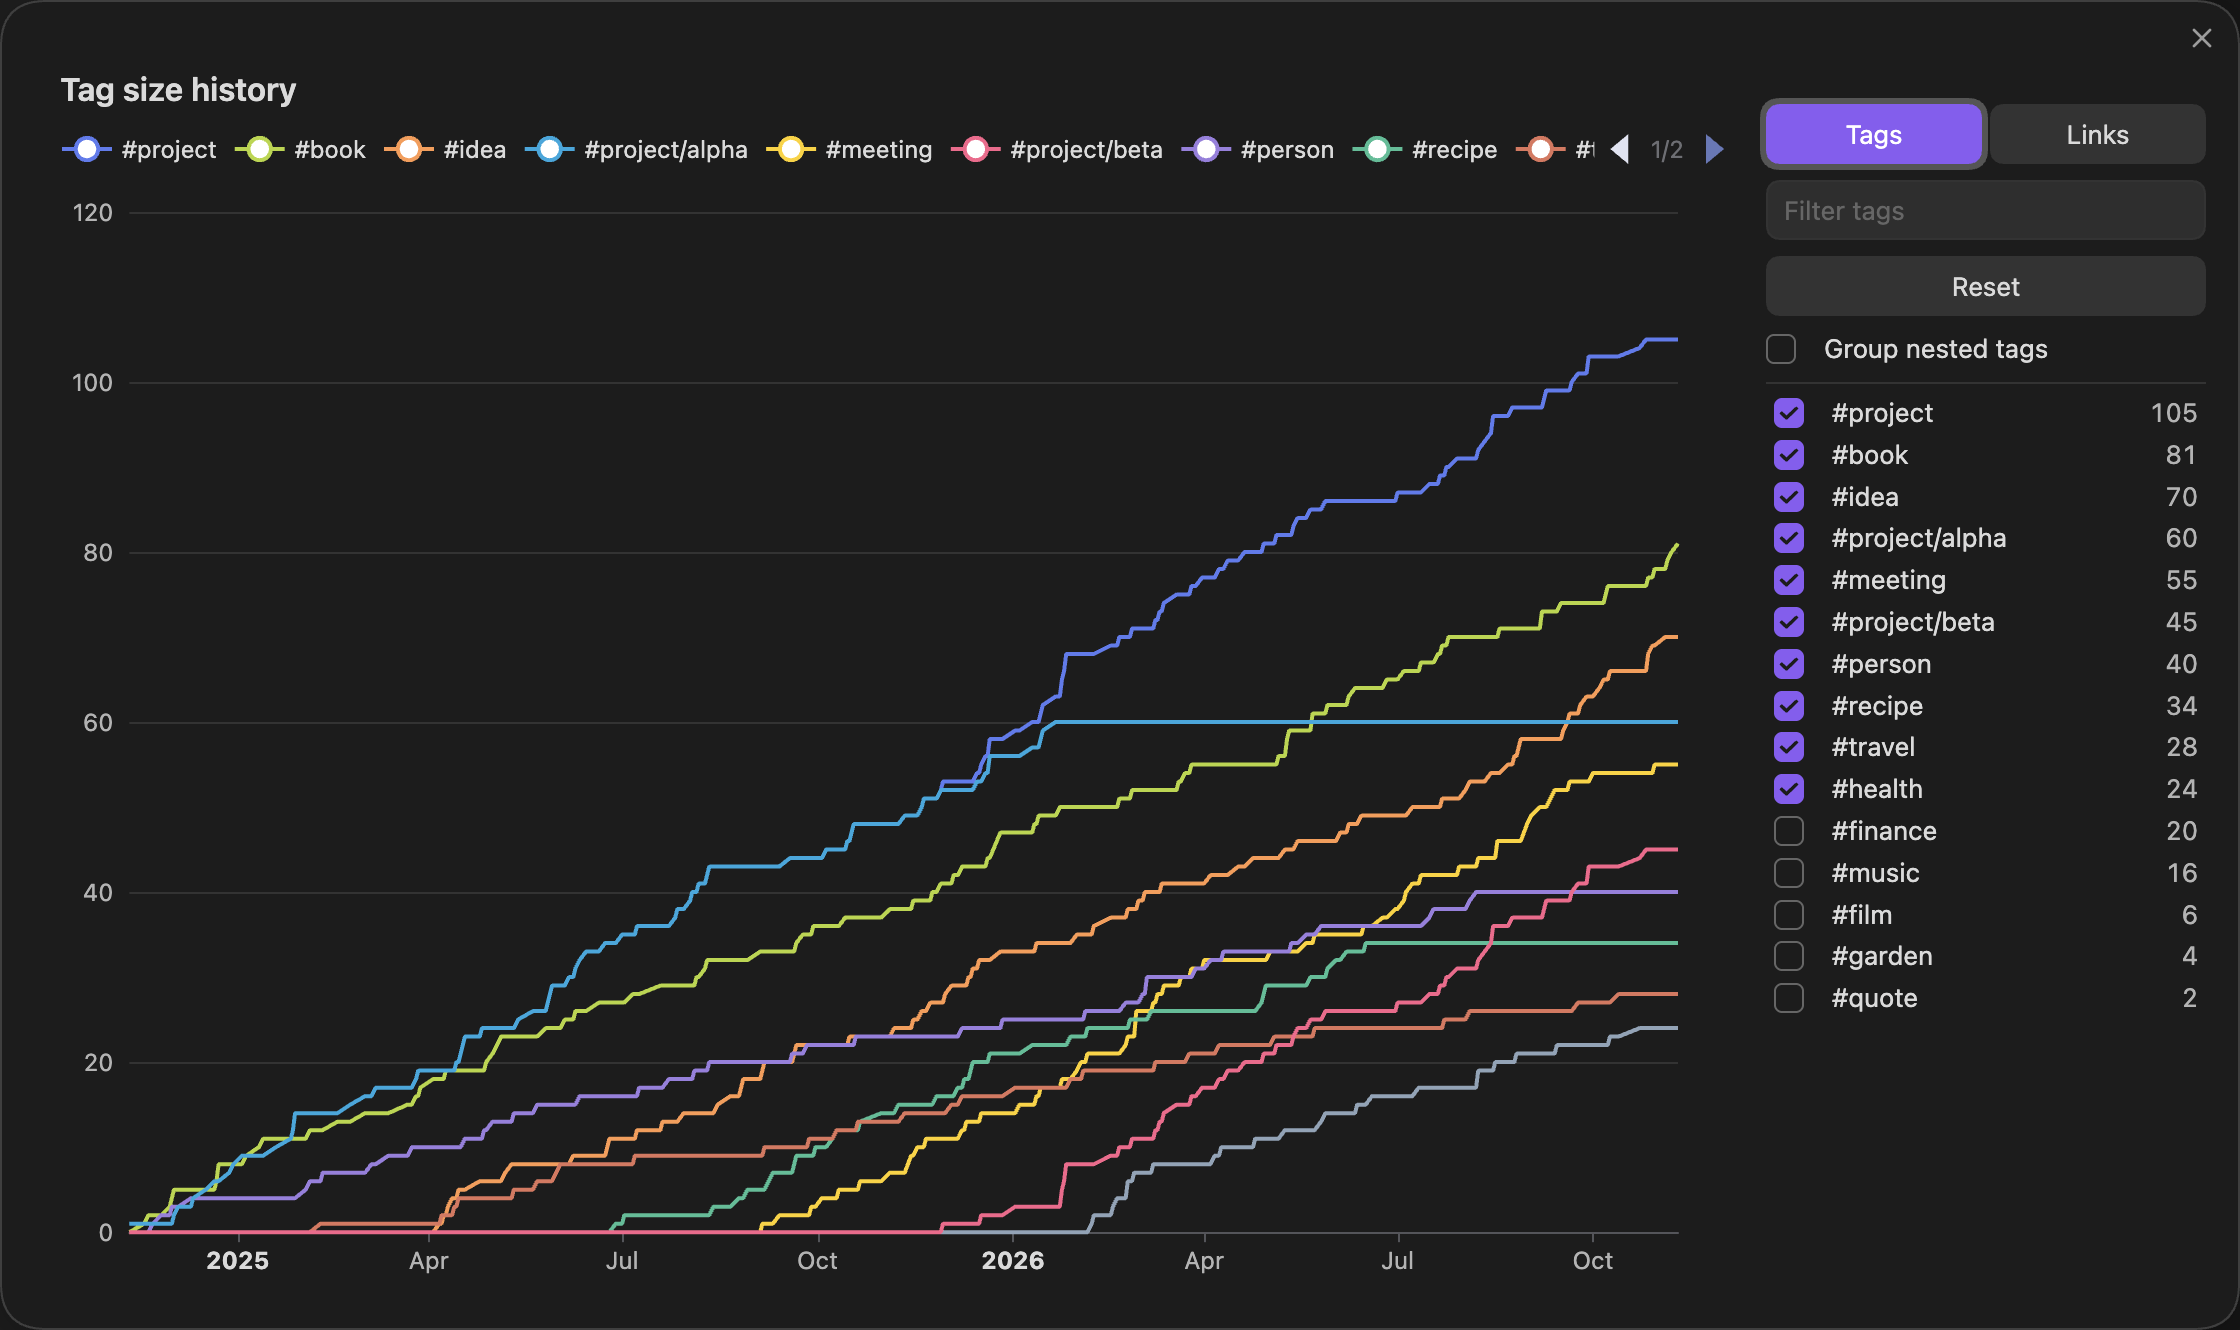
#project/alphais counted. On, it counts toward#projectonly. Off, it also gets a line of its own.
When the pop-up opens, the lines draw in from left to right:
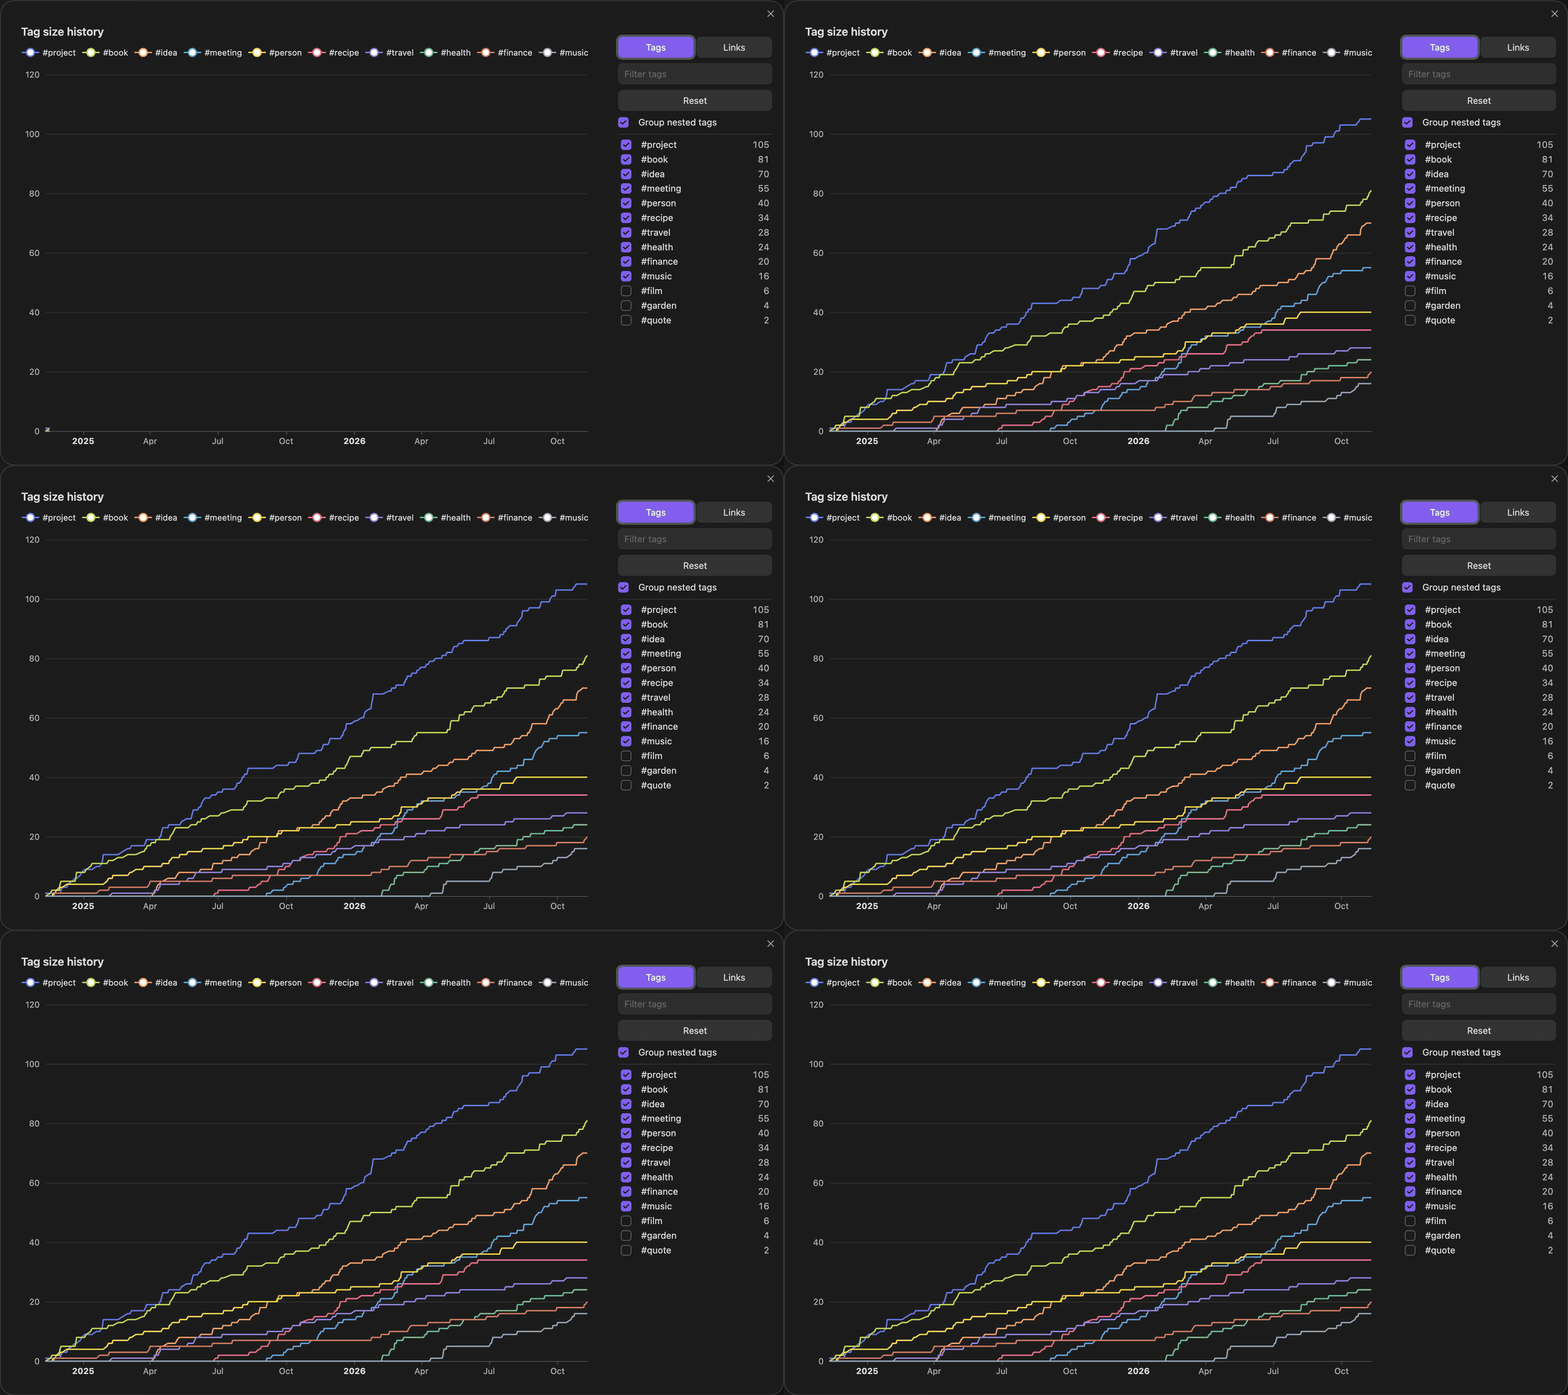
Hovering, switching tags and Reset:
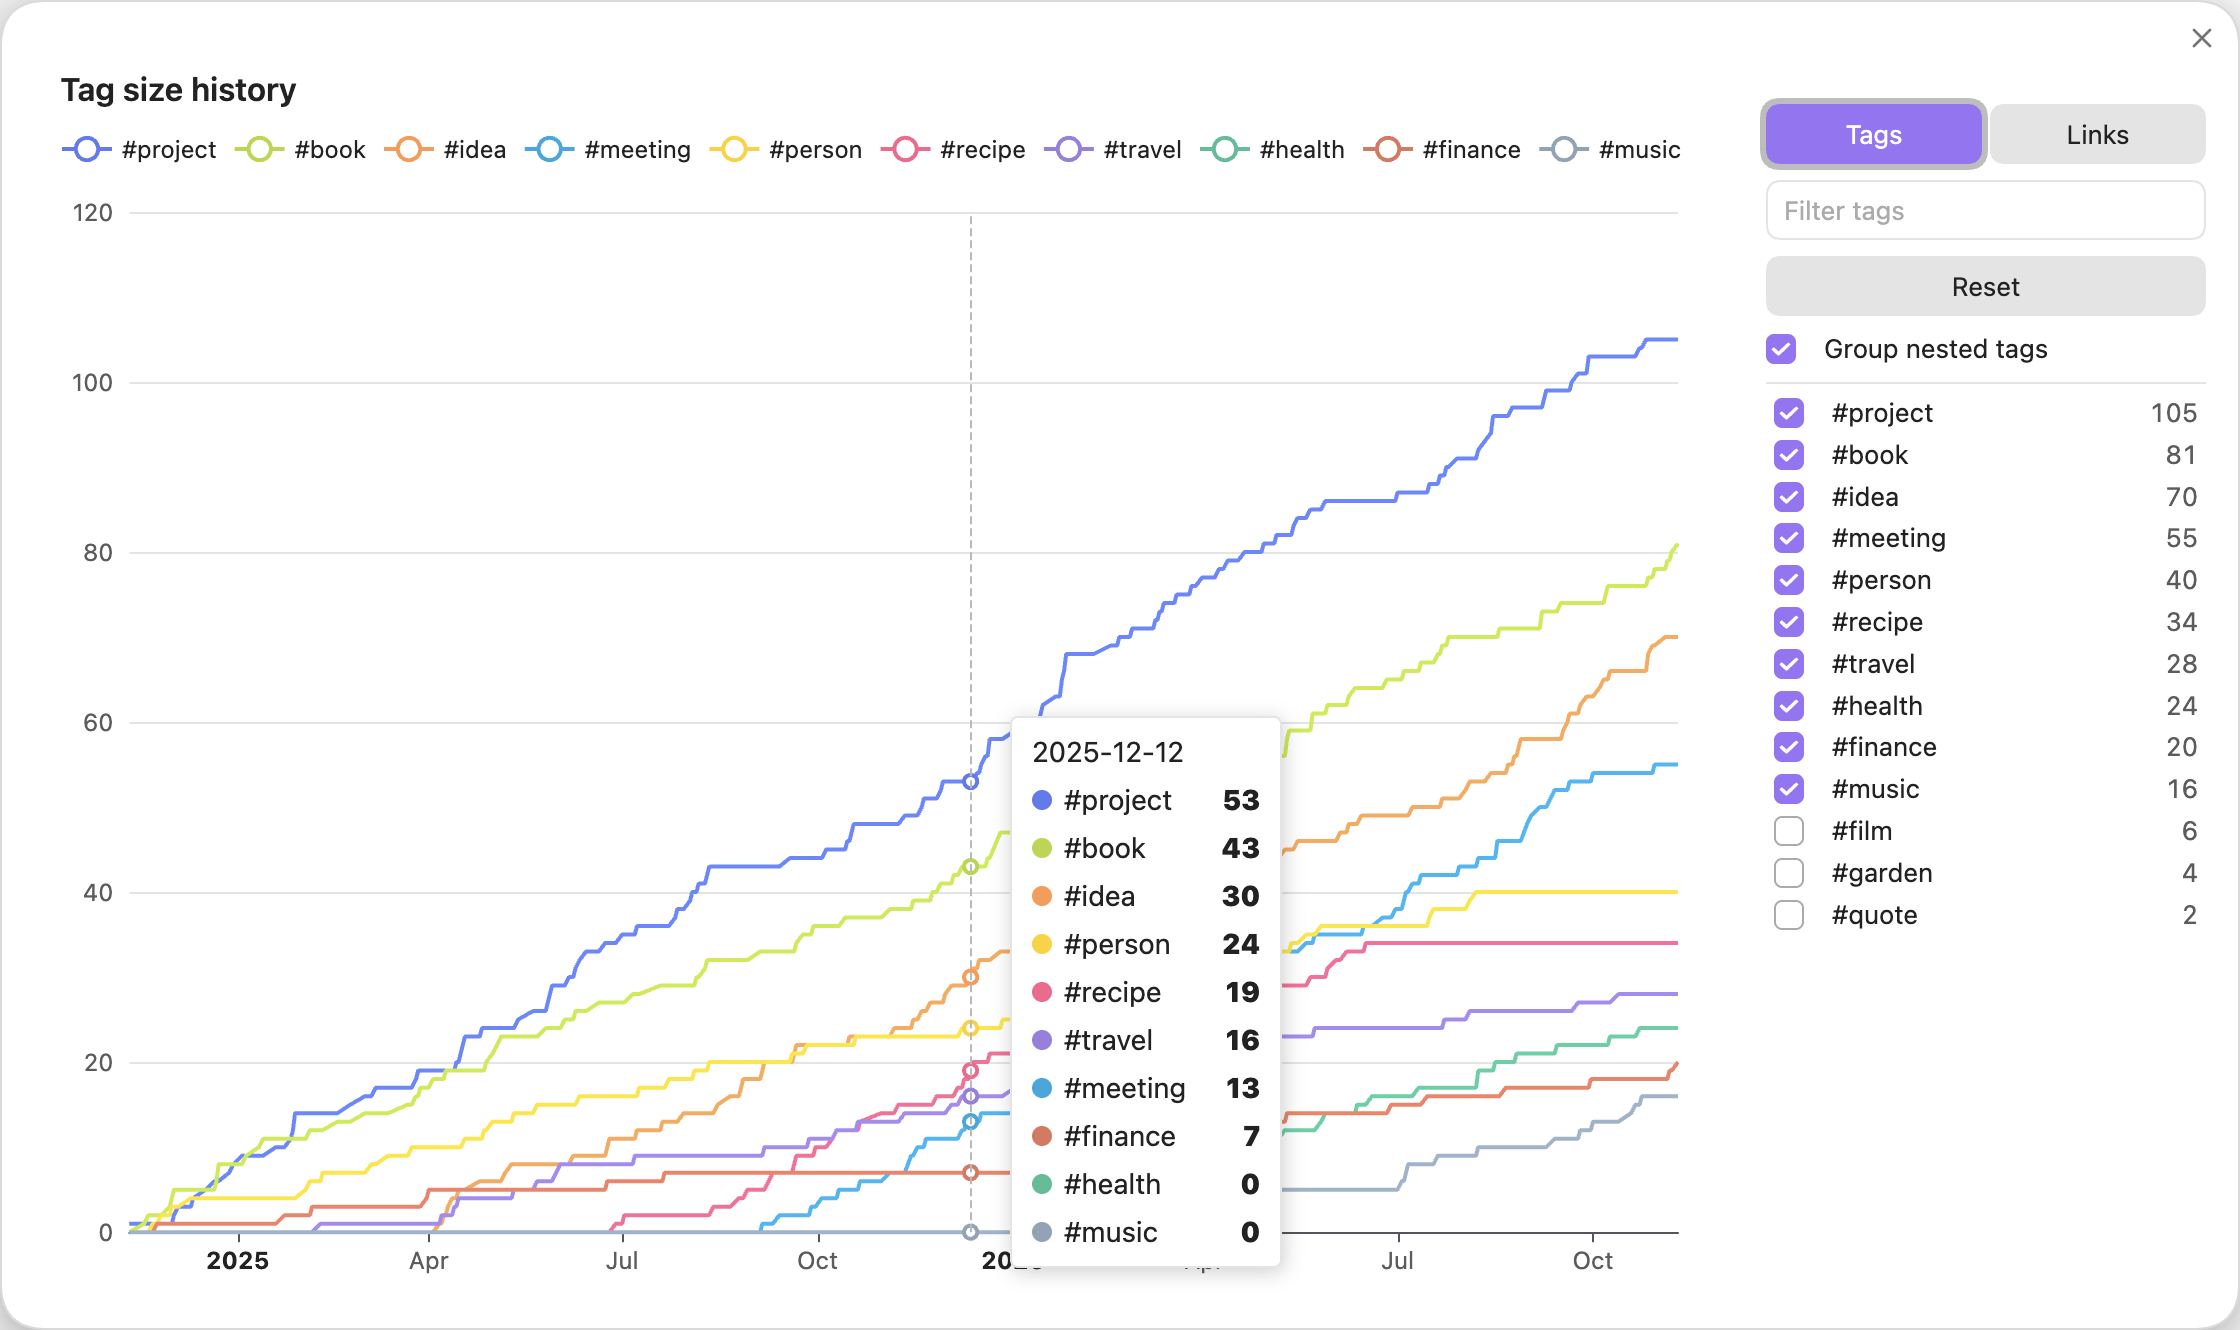
The chart follows your theme, light or dark.
Links mode
Press Links in the panel to chart links instead of tags. Each line is one of your notes, and it shows how many notes link to it over time, so you can see which notes grew into hubs and when. The largest are shown first, and you can switch any note on or off as with tags.
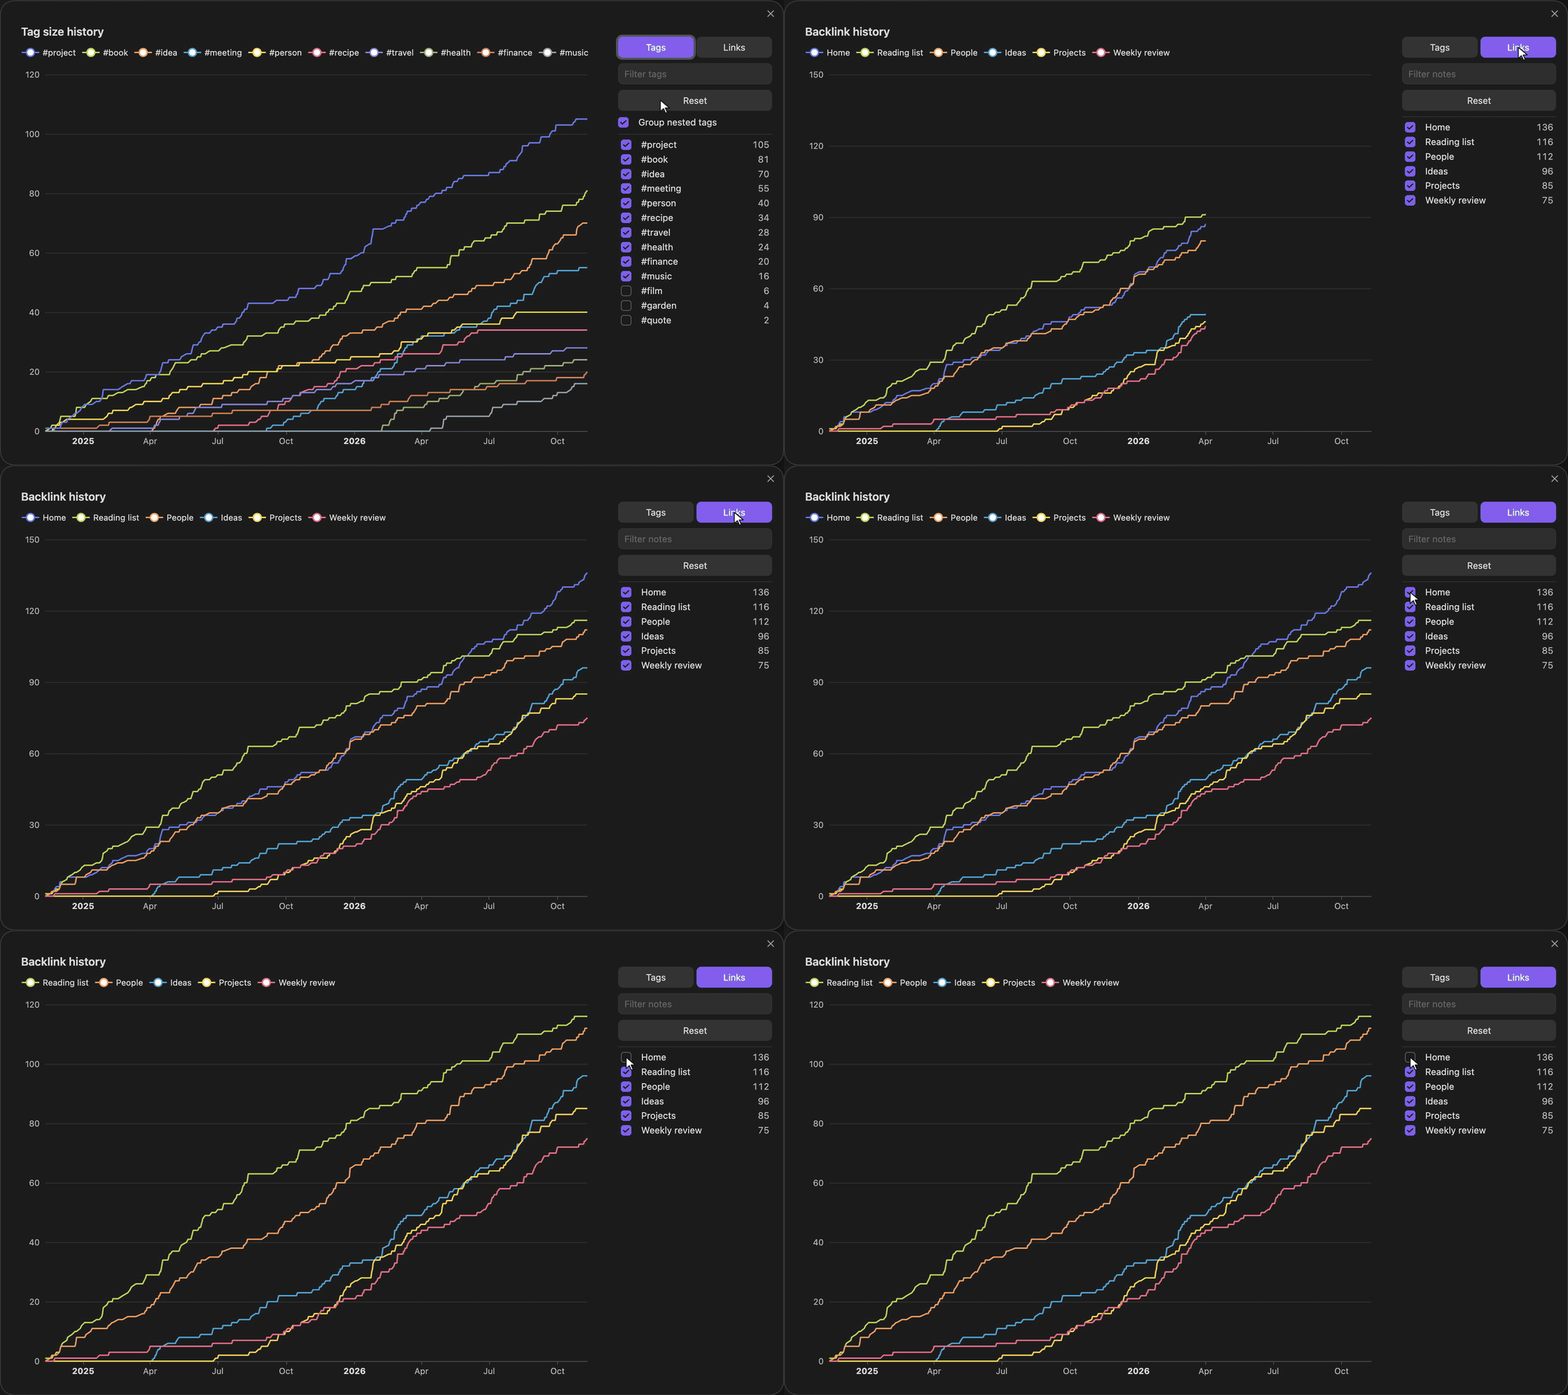
A linking note counts once, from its own date, however many links it has to the same note.
Nested tags
With Group nested tags off, nested tags get lines of their own:
Settings
| Setting | What it does | Default |
|---|---|---|
| Date source | The date from which a note counts toward its tags: when it was created, when it was last modified, or a date in a frontmatter property. | Created |
| Frontmatter property | The property that holds the date, when the date source is a frontmatter property. A note without a date there uses its creation time. | created |
| Number of lines | How many of the largest tags, or most-linked notes, the chart shows. | 10 |
| Group nested tags | Count nested tags toward their top-level tag only. | On |
The plugin works offline. It reads only the notes in your vault, sends nothing anywhere, and saves only its own settings.
How the history is worked out
The plugin does not record anything over time. Each time you open the chart, it reads every note's tags and date, and counts a note toward its tags from that date onward. So the full history is there the first time you open it.
This has two limits:
- It cannot know when a tag or a link was added to a note. A tag added last week to a note from 2022 counts from 2022.
- Deleted notes are not counted.
If file creation times in your vault are wrong, for example after copying the vault or syncing it to a new machine, put the date in a frontmatter property and set Date source to Frontmatter property.
Installing
Needs Obsidian 1.13 or later.
In Obsidian, open Settings, Community plugins, Browse, search for Tag Size History, then install and enable it. Or use its page in the directory: community.obsidian.md/plugins/tag-size-history.
To build it yourself and copy it into a vault:
npm install
scripts/deploy.sh /path/to/your/vault
Then turn on Tag Size History under Settings, Community plugins.
Development
make setup            # install and enable the git hooks
make check            # format, lint, types, dead code, boundaries, layout, tests, build
make obsidian-check   # run the plugin in a real, throwaway Obsidian
DESIGN.md says what the plugin does, AGENTS.md has the rules of the repo, and docs/decisions/ records how and why.
Credit
Tag Size History takes its idea and the look of its chart from Vault Size History by Technerium, which graphs the number of files in a vault over time. This plugin does the same for tags. It shares no code with Vault Size History.
The chart is drawn with Apache ECharts, which is bundled into the plugin under the Apache License 2.0.
Licence
MIT