Habit Tracker Dashboard
 Hossein Fard1k downloads
Track your habits from note properties with beautiful dashboards, heatmaps, charts, and streaks.
- Overview
- Scorecard
- Updates16
English | فارسی
Habit Tracker Dashboard
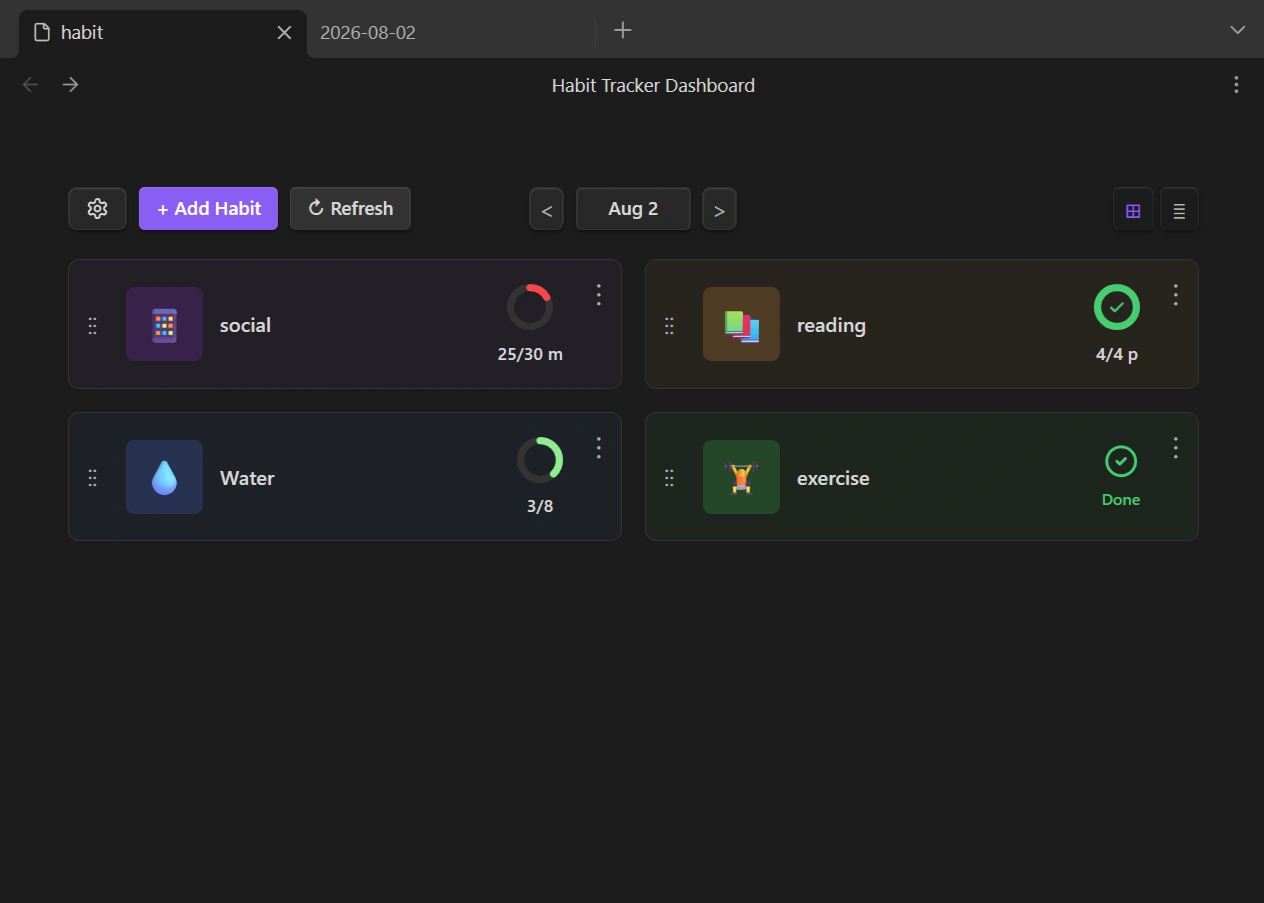
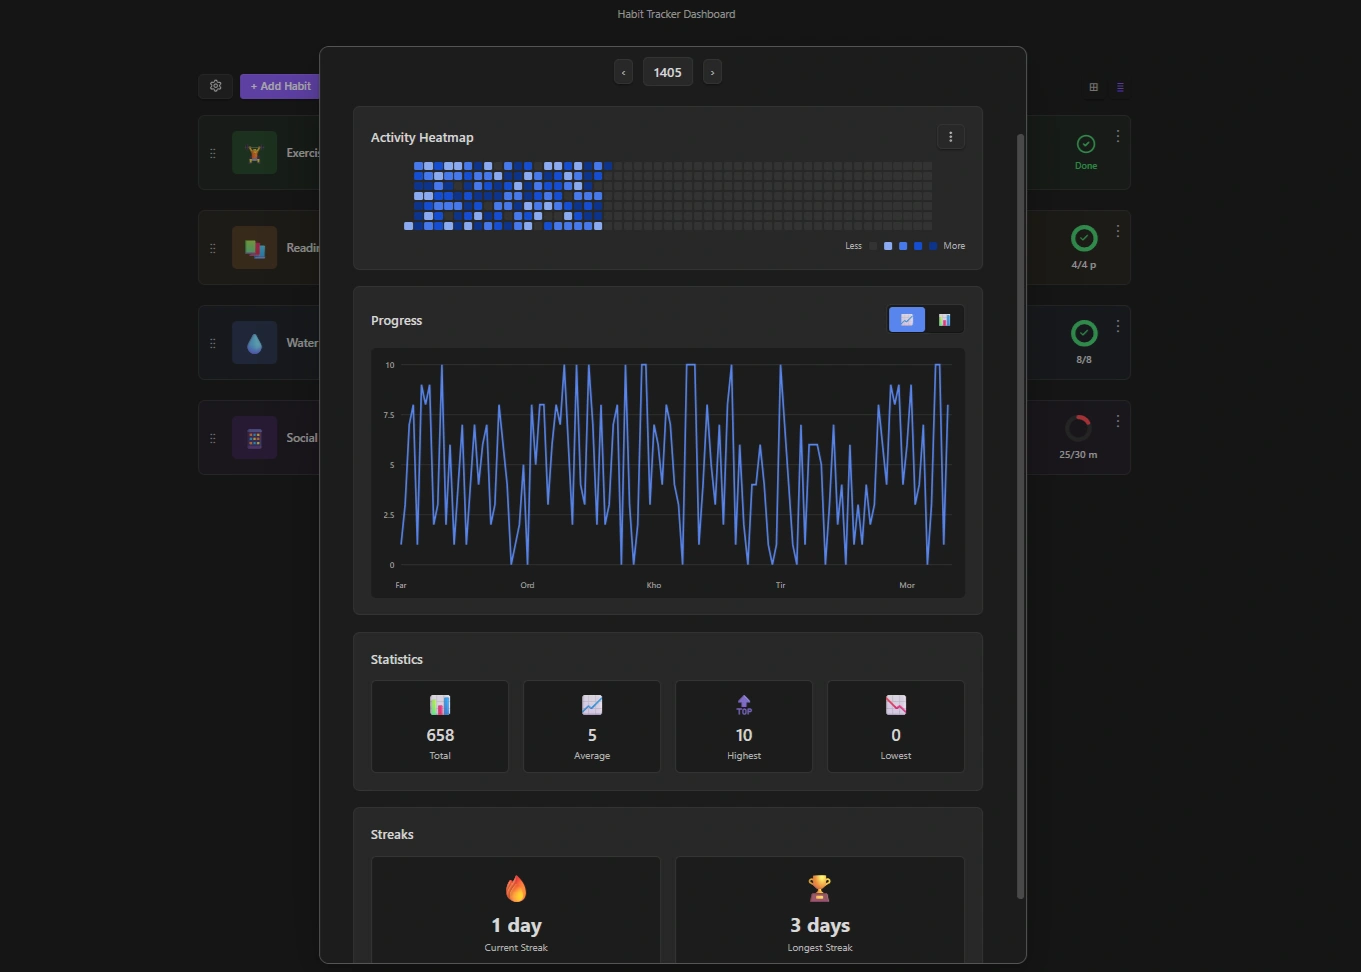
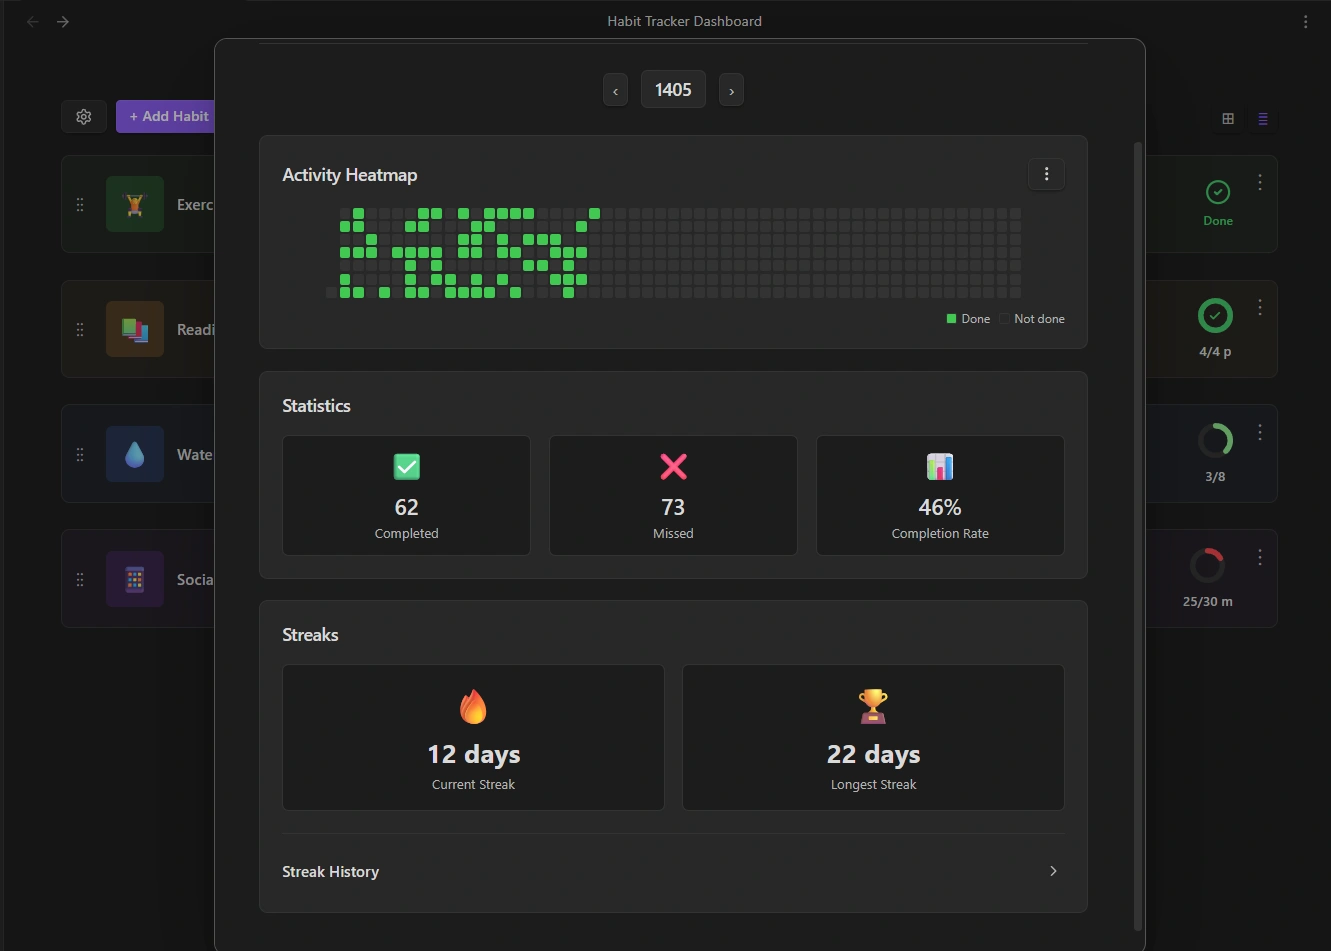
This plugin reads habit data from your note properties and displays it through visual dashboards.
Features
📅 Daily Dashboard: Track your daily habits, view completion status, and navigate through previous days.
🔥 Heatmap Calendar: Visualize your habit activity throughout the year with a GitHub-style contribution calendar.
📈 Line and Bar Charts: Analyze habit trends and progress over time with interactive charts.
📊 Detailed Statistics: View total counts, averages, maximum and minimum values, and completion rates.
🔗 Habit Streak Tracking: Monitor current streaks, longest streaks, and streak history.
Usage
1. Add Habit Data to Your Daily Notes
First, record your habits in the properties of your daily notes.
---
exercise: true
reading: 30
---
2. Create a dashboard
Click the plugin icon in the ribbon, or run "Habit Tracker Dashboard: Create new habit tracker" from the Command Palette.
Enter a name for your dashboard file and click Create.
3. Configure the Data Source
Open Tracker Settings (⚙️) and choose:
- Where your daily notes are located (Tag or Folder)
- How dates should be extracted (File name or Frontmatter)
⚠️ Dates must use the Gregorian format (YYYY-MM-DD) for the selected date source. e.g. 2026-05-08
4. Create Your Habits
Click Add Habit and enter your habit information.
Choose the habit type based on the property type in your daily notes:
- Boolean: For habits with checkbox properties. e.g. Exercise
- Numeric: For habits with number properties. e.g. Reading
You can customize options such as target values, units, and visualization settings for numeric habits.
That's it! The dashboard will automatically read your daily notes.
Settings & Behavior
Completion Conditions
For numeric habits, choose how completion is evaluated:
- At least (≥): Reach or exceed the target (e.g. 30+ minutes)
- At most (≤): Stay at or below the target (e.g. ≤2000 calories)
- Exactly (=): Match the target exactly
Visualization
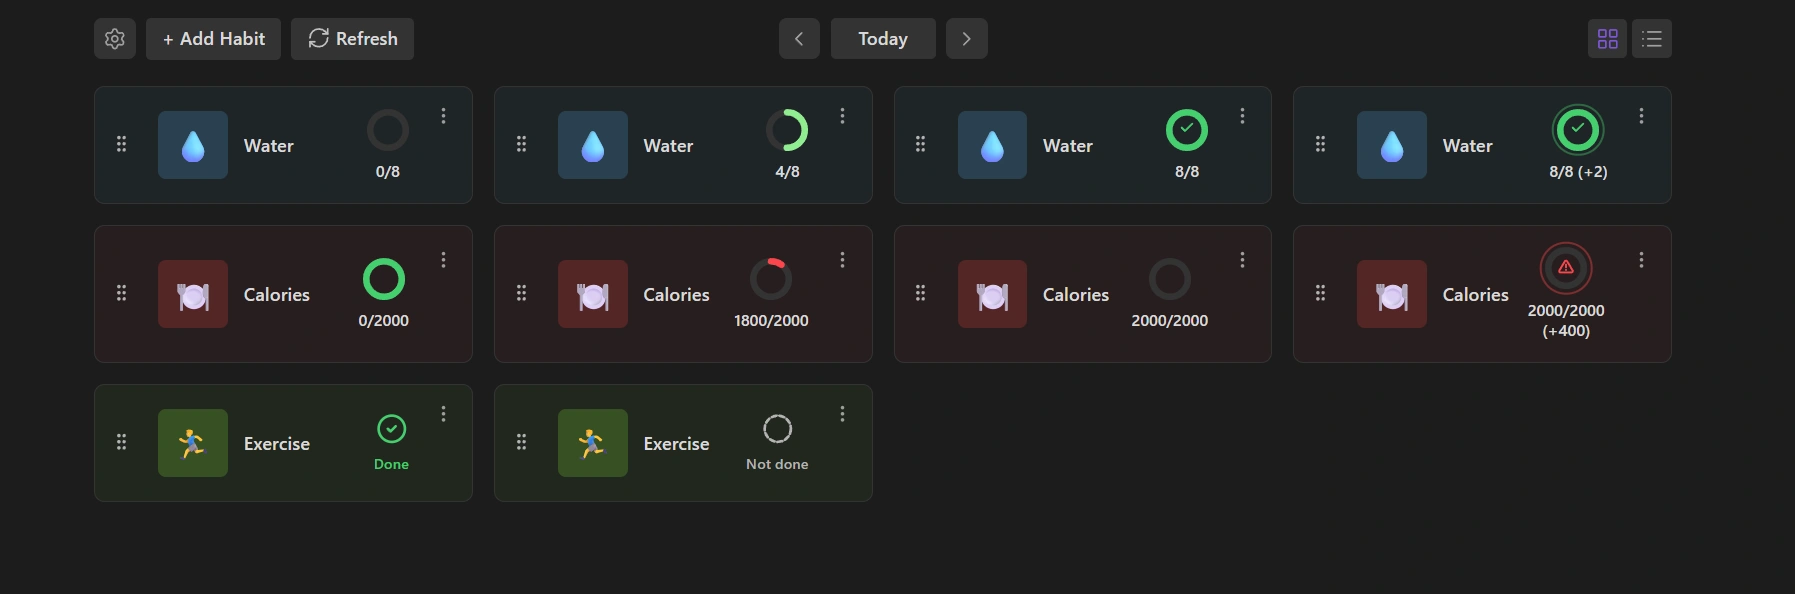
Numeric Habits
The visualization depends on the selected completion condition.
At Least (≥)
Higher values are better.
- 0: Empty donut.
- Half of the target: Half-filled donut.
- Target reached: Full donut with a check mark.
- Above the target: An outer ring appears and the extra amount is shown (e.g. +2).
At Most (≤)
Lower values are better.
- 0: Full donut.
- As the value increases: The donut gradually empties and shifts toward orange.
- Target reached: Empty donut.
- Above the target: A warning ring appears with a ⚠️ icon.
Exactly (=)
The donut represents whether the value matches the target exactly.
- Below the target: The donut remains empty.
- At the target: The donut is full and displays a check mark.
- Above the target: A warning ring appears and the habit is not considered complete.
Boolean Habits
Boolean habits have a simple two-state visualization:
- Completed: A check icon is displayed.
- Not completed: A circle icon is displayed.
Refresh
To improve performance and avoid continuously scanning files, the plugin stores habit data in a temporary cache.
If you manually edit your daily notes, click Refresh (🔄) to re-scan the files and update the dashboard with the latest changes.
Grace Days
Allow a streak to continue after a limited number of consecutive missed days.
- 0 = No missed days allowed; the streak resets immediately.
- 1+ = Allow the specified number of missed days before the streak resets.
Minimum Streak Length
Only streaks with at least this many days are shown in Streak History.