
- Overview
- Scorecard
- Updates8
Visualise your Habits based on DataViewJS in Obsidian
Use:
- Annotate the data you want to track in your daily notes (see Dataview annotation documentation)
- Create a DataviewJS block wherever you want the Habit Tracker to display.
- Collect the data you want to display using DataviewJS
- Pass the data into Habit Tracker using renderHabitTracker()
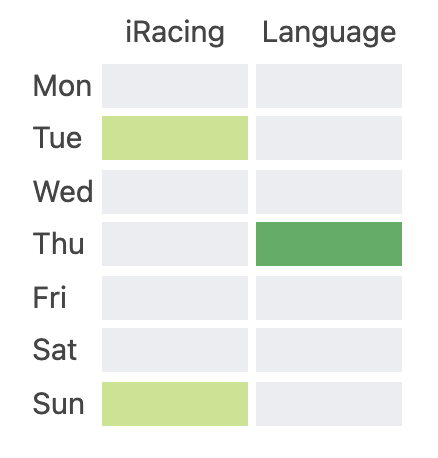
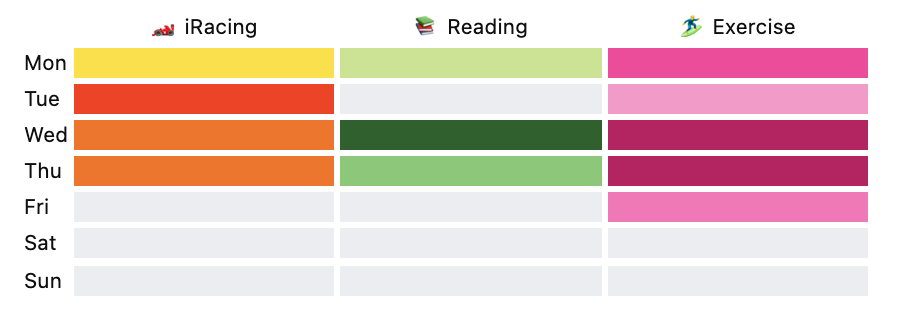
Full Example Code:
```dataviewjs
const weekData = {
    year: 2022,
    week: 25,
    habits: [
        {
            colors: ["#c6e48b", "#49af5d"],
            name: "iRacing",
            entries: [
                {
                    date: "2022-06-26",
                    value: 30
                },
                {
                    date: "2022-06-21",
                    value: 45
                }
            ]
        },
        {
            colors: ["#49af5d", "#c6e48b"],
            name: "Language",
            entries: [
                {
                    date: "2022-06-23",
                    value: 30
                }
            ]
        }
    ]
}

renderHabitTracker(this.container, weekData)

```
Known Limitations
- It currently only supports up to 7 habits.
Attribution
This Plugin has been created on the foundation of the Heatmap Calendar by Richard Slettevoll
Changelog:
[0.3.3] - 2022-07-07
- Further clean up as per Request
[0.3.2] - 2022-07-04
- Removed settings references
- Make the EL and UL creation cleaner
[0.3.1] - 2022-07-04
- Remove conflict with Heatmap calendar due to same named css classses
[0.3.0] - 2022-07-01
- Fixed a bug where a value wasn't assigned to the right color
- Added tests for two core logic functions
- Added rollup for better file management
[0.2.0] - 2022-06-30
- Added the concept of intensities.
- Provide a value to the entity
- Provide multiple colors to map the values equidistant to the colors based on the min and max value
[0.1.0] - 2022-06-26
- initial release
HealthFair
ReviewCaution
About
Visualize habit progress as a heatmap-style tracker using DataviewJS data from your notes. Map numeric intensities to color gradients, render up to seven habits with renderHabitTracker(), and insert the tracker inside a DataviewJS block.Details
Current version
0.3.4
Last updated
4 years ago
Created
4 years ago
Updates
8 releases
Downloads
10k
Compatible with
Obsidian 0.12.0+
Platforms
Desktop, Mobile
License
Apache-2.0