Graph Spawn
 Taylor Scott245 downloads
Seeds each disconnected cluster of the graph at its own starting position, so components do not spawn on top of each other and stay tangled.
- Overview
- Scorecard
- Updates1
Obsidian starts every graph node at the same point. This spreads the clusters out first.
 |
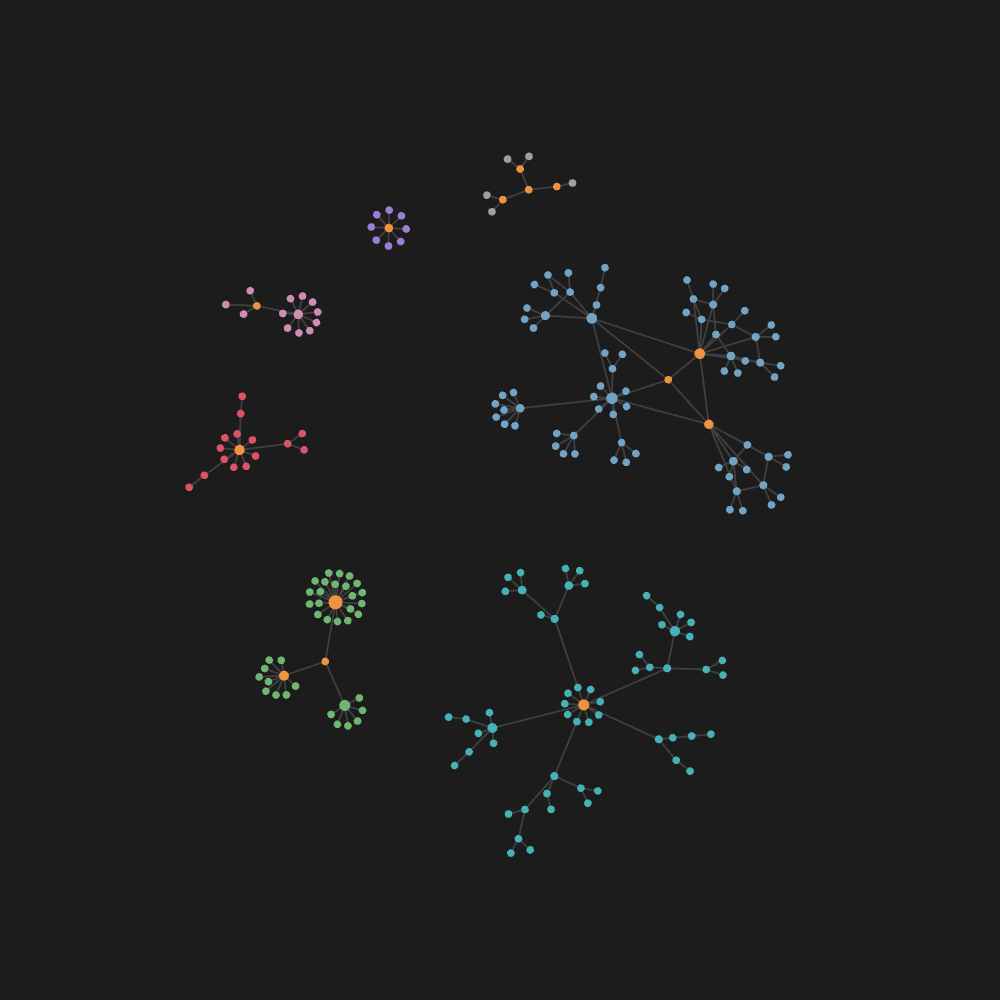 |
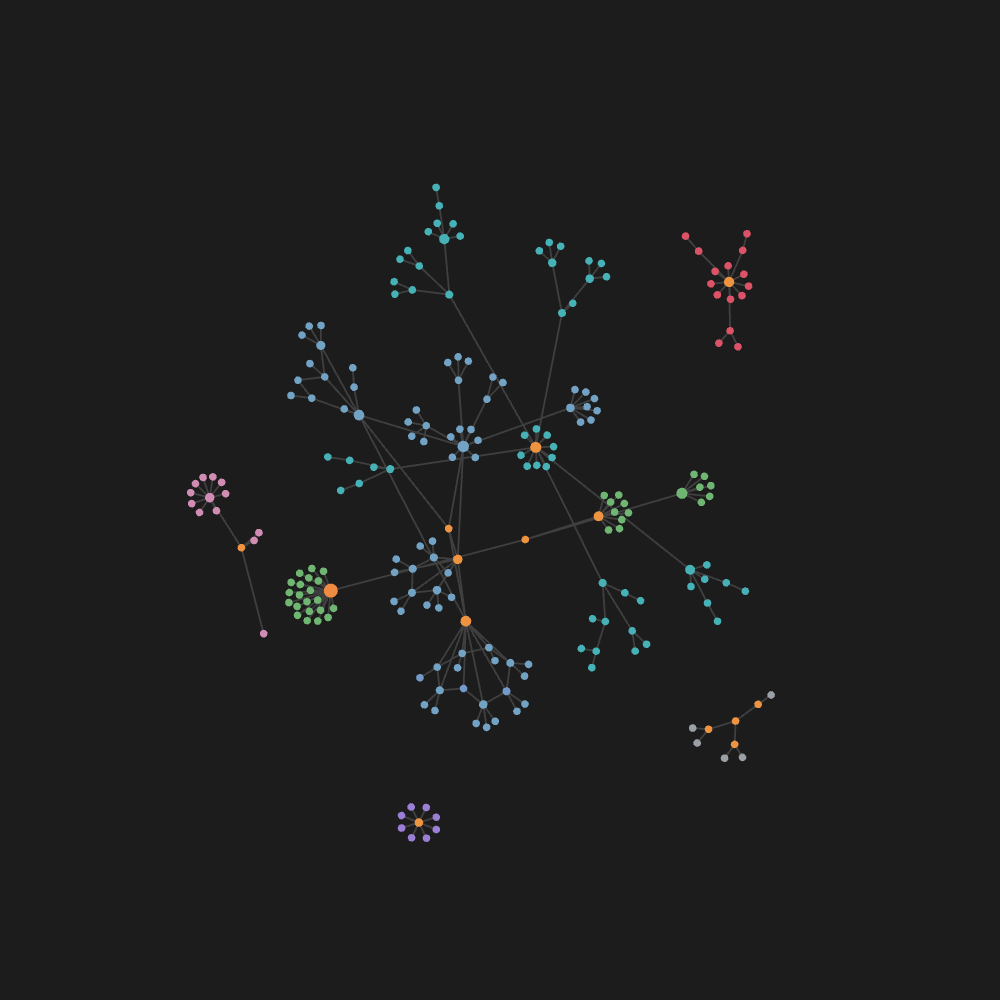
| Before — same vault, default settings | After |
Same vault, same forces, same colours. On the left, two large groups are threaded through each other in the middle and a third is split across two places on the canvas. On the right each group has its own space, and the colours — which map to top-level folders — are no longer interleaved.
If your graph is a forest — several groups of notes with no links between them — you have probably watched the groups come apart half-tangled and stay that way. Turning Center force down spreads everything out. Turning Repel force up inflates every group equally. Nothing separates the groups as groups, and it is not obvious why.
The cause
It is not the forces. It is where the nodes start.
Obsidian's graph simulation runs in a worker, sim.js, which is d3-force with a small
message handler on the front. Every node it has not seen before is created like this:
{ id: i, x: 0, y: 0, vx: 0, vy: 0, fx: null, fy: null }
The origin. Not a random scatter — every node in the vault, in every disconnected group, stacked on one point. They come apart only because floating-point noise breaks the symmetry, and whatever interleaving falls out of that first instant is permanent: a force layout has no move that pulls two tangled components through each other. They can only push apart, and by then they are already threaded together.
So this is an initialisation problem wearing the costume of a force problem, which is why the four sliders cannot fix it and why cycling them only helps by accident.
The fix
The same worker accepts positions on the way in. Its nodes payload is a map of
id → [x, y], and a supplied pair is used as-is. So:
- Union-find the components from the links the graph is actually drawing.
- Sort them largest first and lay their centres on a ring, sized so the two biggest clear each other.
- Scatter each component's nodes across a disc of radius
175 × √(n/π)— roughly where the simulation was going to settle it anyway, so nothing lurches on the first tick. - Post it, and let Obsidian's own forces take over.
Your force settings are never touched. This only changes where things start.
Install
No release binary — the plugin is main.js, there is no build step and no dependency.
git clone https://github.com/tjqscott/obsidian-graph-spawn.git <vault>/.obsidian/plugins/graph-spawn
Then enable Graph Spawn under Settings → Community plugins, and reopen the graph.
Use
It seeds a graph view when it opens, and again whenever the number of clusters changes — a new root appearing, or two merging. Adding a note inside an existing cluster changes the node count but not the cluster count, and is ignored, because throwing a settled graph back to the start is worse than the problem being solved.
The command Graph Spawn: Respawn clusters apart forces it at any time.
What it does not do
- Nothing is hardcoded. No folder list, no cluster names, no fixed count. Components come from the drawn edges, so a filtered graph is separated as filtered.
- Cluster positions are not stable across structural change. Ordering is by size, so if
one group overtakes another they swap places on the ring. The scatter itself is
deterministic — a seeded generator, not
Math.random— so the same graph settles to the same picture. - It does not untangle a single connected hairball. If your vault is one component, there is nothing to separate and this will do nothing for you. It is for forests.
Stability
This drives an undocumented internal protocol: leaf.view.renderer.worker. Two constraints
that protocol imposes, both silent if you get them wrong — worth knowing if you fork this:
- Any node id missing from the payload is deleted from the simulation. Post all of them.
linksis only replaced when the message carries it, so sendingnodesalone leaves edges untouched.
If Obsidian changes the protocol, the failure mode is that nothing happens. It will not break your graph or your vault.
Licence
MIT.