Bases heatmap view
 serafinovsky888 downloads
Github-style heatmap visualization for any date-based property in your Bases tables. Track activity, habits, progress, or any numeric/date-related data with color-coded squares.
- Overview
- Scorecard
- Updates3
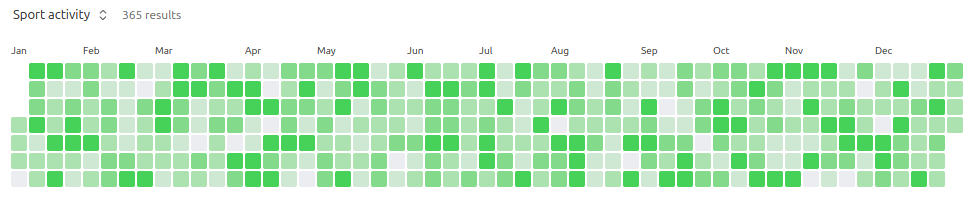
GitHub-contributions-style heatmap for any date-based property in your Bases tables. Track activity, habits, and progress with color-coded squares.
How to use
- Configure the filter to show the records you want
- Create a new view and select Heatmap
- Select the property to display on the map and adjust other settings
- You're all set

Template
This plugin is based on cookiecutter-obsidian-plugin.
License
MIT
82%
HealthExcellent
ReviewCaution
About
Display GitHub-contributions-style heatmaps for any date-based property in Bases tables. Track activity, habits, and progress with color-coded squares and filters to focus on the records that matter.Details
Current version
1.0.2
Last updated
3 months ago
Created
4 months ago
Updates
3 releases
Downloads
888
Compatible with
Obsidian 1.10.0+
Platforms
Desktop, Mobile
License
MIT
Author