Agate
 Philipp Kats127 downloads
Visualize your notes and Bases with Vega and Vega-Lite, from simple bar charts to interactive maps, networks, and custom graphics.
- Overview
- Scorecard
- Updates10

Agate
Agate brings Vega and Vega-Lite visualizations to Obsidian. Create charts from Bases views that follow your notes, filters, and groups, or define your own visualizations in an agate code block.
Start with a ready-made chart, then customize it as needed—from simple comparisons to maps, timelines, networks, and dashboards.
Website · Quickstart · Gallery · Guide · Changelog
What would you chart?
If your notes have properties, you already have the data. A few ideas, from sensible to slightly obsessive:
- Learning. One note per practice problem, with a score before and after reading up. See which topics are getting better and which you keep avoiding.
- Board games. Which games on the shelf actually get played, how long a "quick game" really takes, and who keeps winning.
- Reading. Pages per month, ratings by genre, and the books you started in March and never finished.
- Work and side projects. Which meetings eat your Tuesdays, and how many side projects are "in progress" (all of them).
- Recipes. Cooking time against how often you actually make a dish, and the cuisine you keep saving but never cook.
- D&D campaigns. Sessions, NPCs and factions as linked notes: who knows whom, who betrayed whom, and the party's route across the map.
- Travel. Give place notes coordinates and link them from trip notes, and your trips become routes on a globe you can spin (gallery).
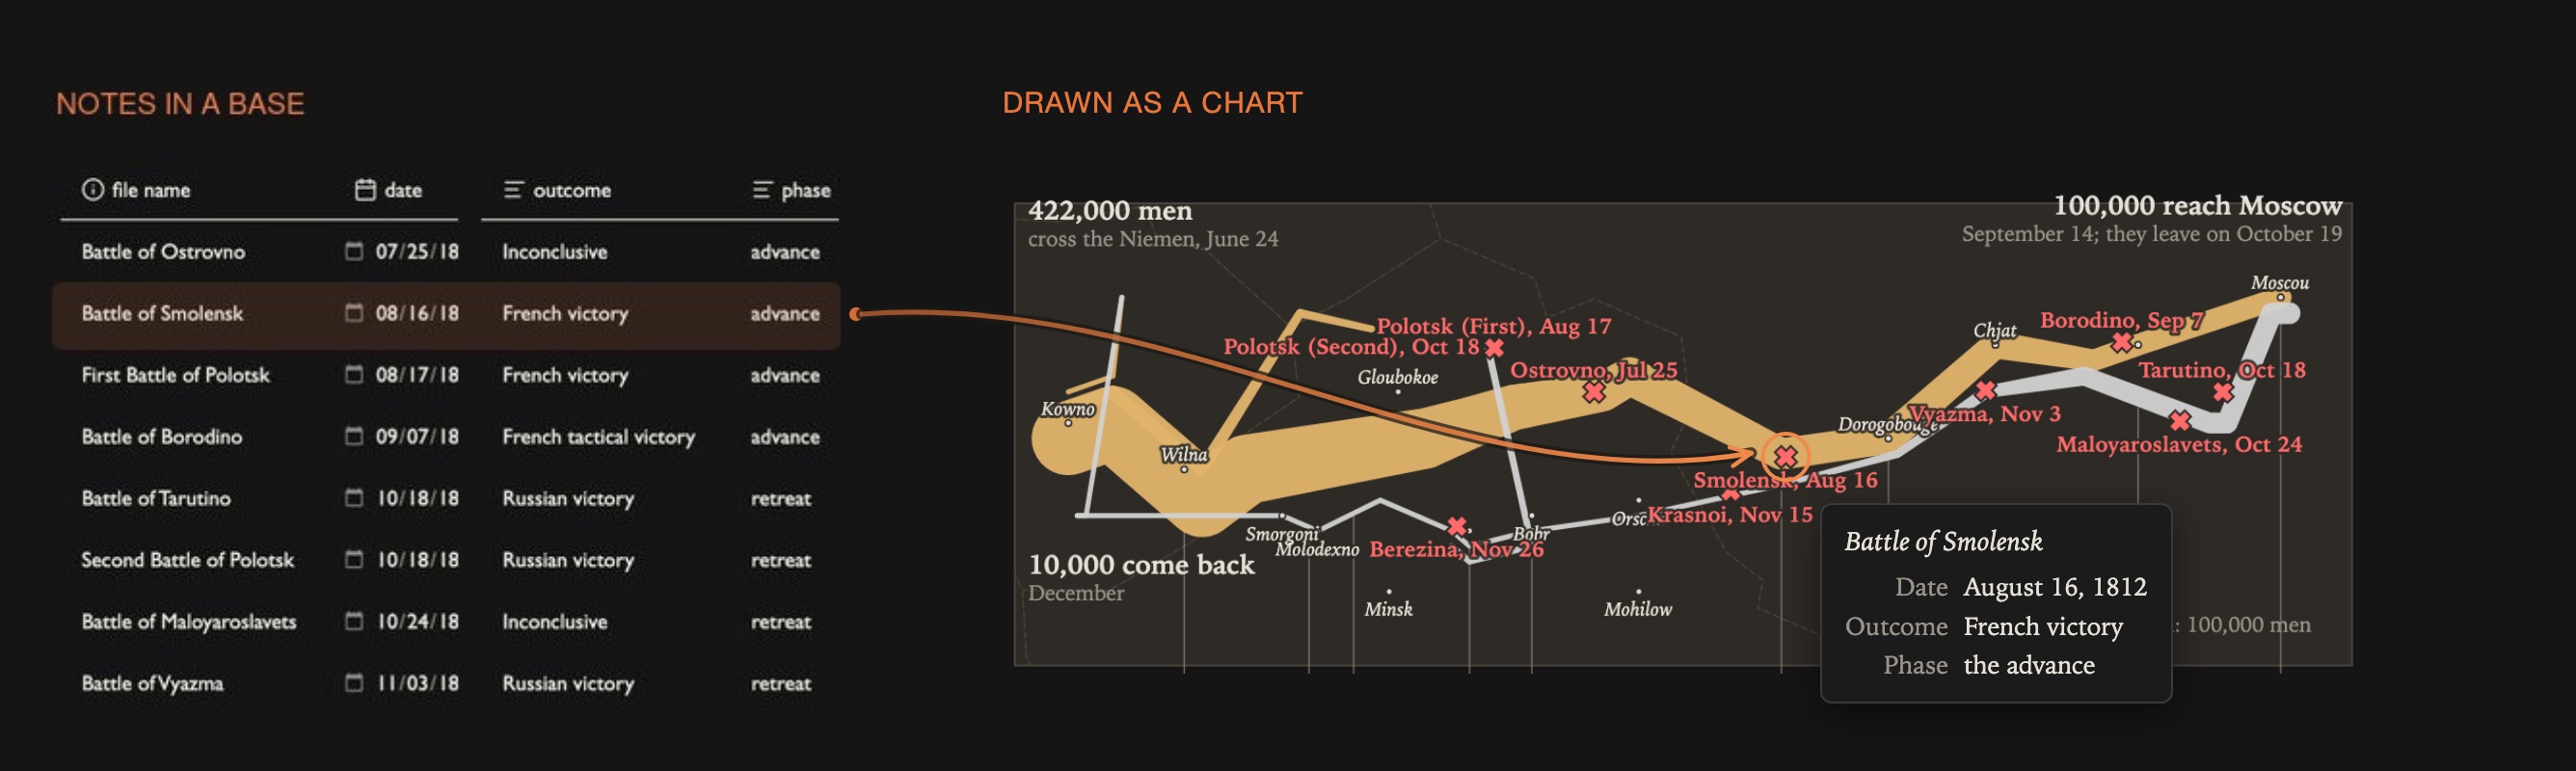
- History. Battle notes with dates, places and outcomes, drawn as Minard's map of Napoleon's 1812 campaign. That's the picture above.
- Habits and mood. A daily note with a few numbers adds up to a year of streaks and slumps.
- The vault itself. How your notes link to each other, and which folders take up the most space.
What it does
- Chart as a Bases view. Add an Agate chart view to any base. It appears wherever a base does: its own tab, embedded in a note (
![[Books.base#Ratings]]), the sidebar, Canvas. The Bases toolbar's filter, sort and grouping drive the chart. - Charts in a note, with an
```agatecode block (or```vega, once enabled in settings): a spec file, rows from a base, or a self-contained spec. - Full support for Vega and Vega-Lite specs, so no option list to outgrow: maps and globes, networks of linked notes, folder sunbursts, timelines, sankeys, linked dashboards.
- Extras on top of plain Vega:
- Per-note data. A note can point to its own CSV, JSON or URL, e.g. a time series for each stock or city note (guide).
- Your vault as data. Links between notes and the folder tree are datasets, so you can draw link graphs, arc diagrams, sunbursts and treemaps that follow the base's filter (guide).
- Click to open. Clicking a point, bar or node opens its note.
- Big numbers. Live totals and averages shown as note text instead of a chart (guide).
- Map tiles under your marks, with API keys kept in Obsidian's secret storage (guide).
- Hatched and dotted fills for print-style charts (guide).
- Looks like your vault: the
autotheme follows your Obsidian theme and light/dark mode, with chart colors made for popular themes (Minimal's color schemes, Catppuccin, Nord, Gruvbox and more, see Themes); Vega's stock themes and your own theme files are there too. - Built with LLMs in mind. Write everything by hand, or let an assistant do it: LLMs know Vega-Lite well, so any of them can create a chart or tailor a custom theme for you.
Install
In Obsidian: Settings → Community plugins → Browse, search for Agate, install and enable it. Needs Obsidian 1.13 or later with the core Bases plugin on. Works on desktop and mobile.
Then follow the quickstart: 26 book notes to a bookshelf chart in about fifteen minutes. The guide covers everything else.
Network use
Agate makes no network requests by default. Everything it draws comes from your vault.
- Load remote data (off by default) lets a spec load data files and images from
http(s)URLs: remote CSV or JSON, map tiles under a route, pictures in image marks. Agate fetches only the URLs written in your specs, from whichever service they name; it sends no other data and has no telemetry. - API keys (Advanced settings) are kept in Obsidian's secret storage and sent only to the one host you allow for each key.
- Images inside tooltips are an exception: vega-tooltip shows them as ordinary
<img>elements, so a spec that puts an image URL in a tooltip loads it on hover even with Load remote data off.
Making charts
- Pick a recipe: an empty Agate view offers thirteen ready-made charts. Agate asks which property goes where and writes the spec.
- Ask an assistant: Copy prompt for an LLM copies your base's properties, sample rows and Agate's rules for any chat assistant; Paste spec checks the reply and saves it as the view's chart.
- With an AI agent that works on your vault (Claude Code and others): give it the
agate-chartskill. It knows Agate's conventions and extras and checks a spec renders before handing it over. Copy theskills/agate-chartfolder into your agent's skills folder, for example~/.claude/skills/. - By hand: specs are plain JSON, or YAML if you prefer. Install the JSON Editor community plugin to edit JSON inside Obsidian (or Code Editor for JSON and YAML); Edit spec on a chart opens its spec beside it, and every save redraws the chart.
Works with
- Vega Visualizations (
```vega/```vega-liteblocks): both plugins can be on. Without it, a setting lets Agate handle those blocks too. - Other plugins can extend Agate through
app.plugins.plugins.agate.api(data schemes, expression functions, themes, spec preprocessors); see ADR 0001, D7.
Known limits are in the guide's troubleshooting section and why-agate.md.
Development
Node 22.12+ (.nvmrc), Obsidian 1.13+.
npm install
make demo            # regenerate the demo vault, build, link the plugin into it
npm run dev          # rebuild main.js on change
make check           # typecheck, lint, tests (what CI runs)
Open demo-vault/ in Obsidian: the gallery's notes plus test notes under tests/ (start with tests/Test guide.md). make help lists every target. Architecture and decisions: docs/adr/; testing: docs/testing.md; backlog: docs/future-features.md; releasing: docs/releasing.md (make release VERSION=x.y.z).
License
MIT. Vega, Vega-Lite and vega-embed are bundled under their own BSD-3-Clause licenses; see THIRD_PARTY_NOTICES.md.