Tag Graph
 Elliott Park266 downloads
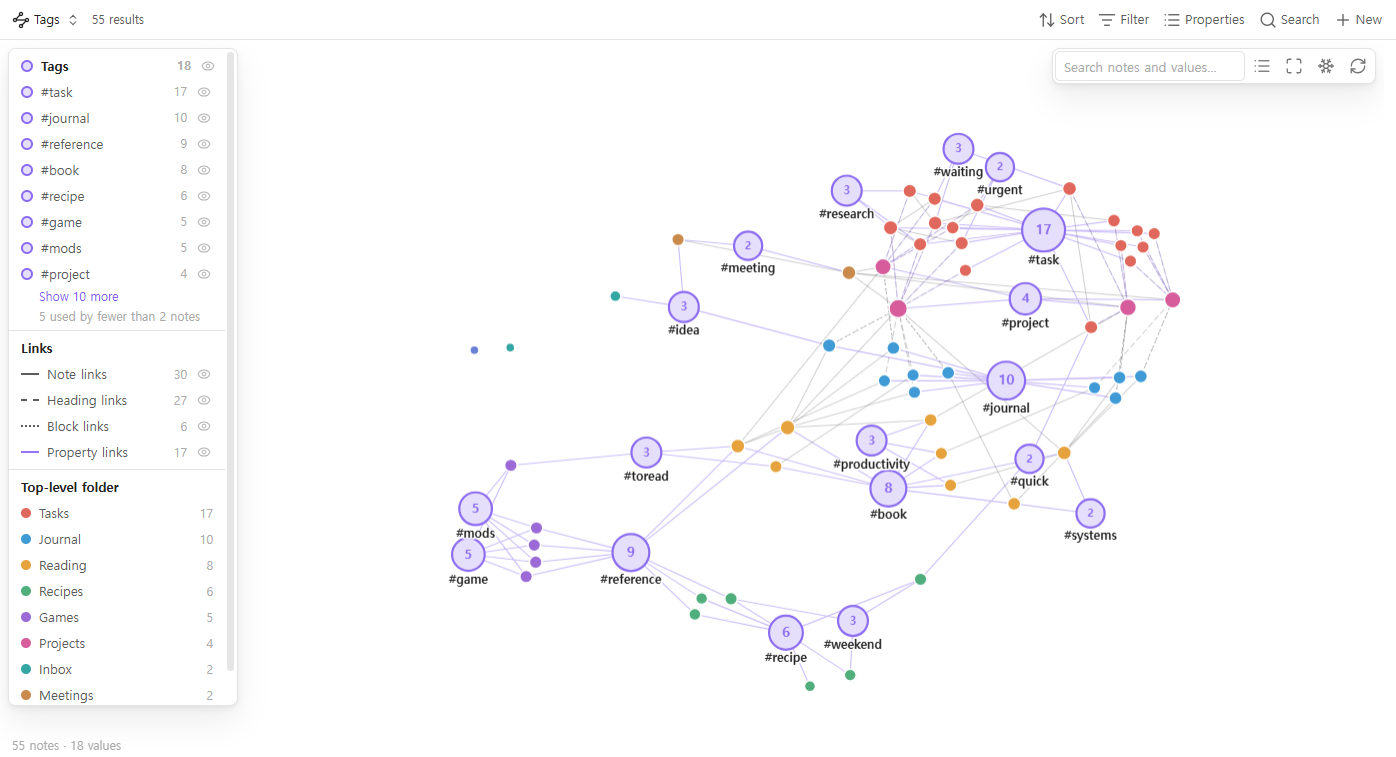
Graph view for Bases where tags, folders and properties become hubs. Drag notes to tag them, merge or rename tags, hide rare tags, split tags by folder, and filter heading or block links.
- Overview
- Scorecard
- Updates5
A graph view for Bases where tags, folders and properties are the nodes — and where you tag, retag and merge by dragging.
Every tag (or folder, or status, or project, or any property) becomes a hub,
and every note that has it is pulled towards it. Notes that never link to each
other still end up side by side when they share a tag, so a vault held together
by tags and properties finally has a shape you can see. And the graph is not
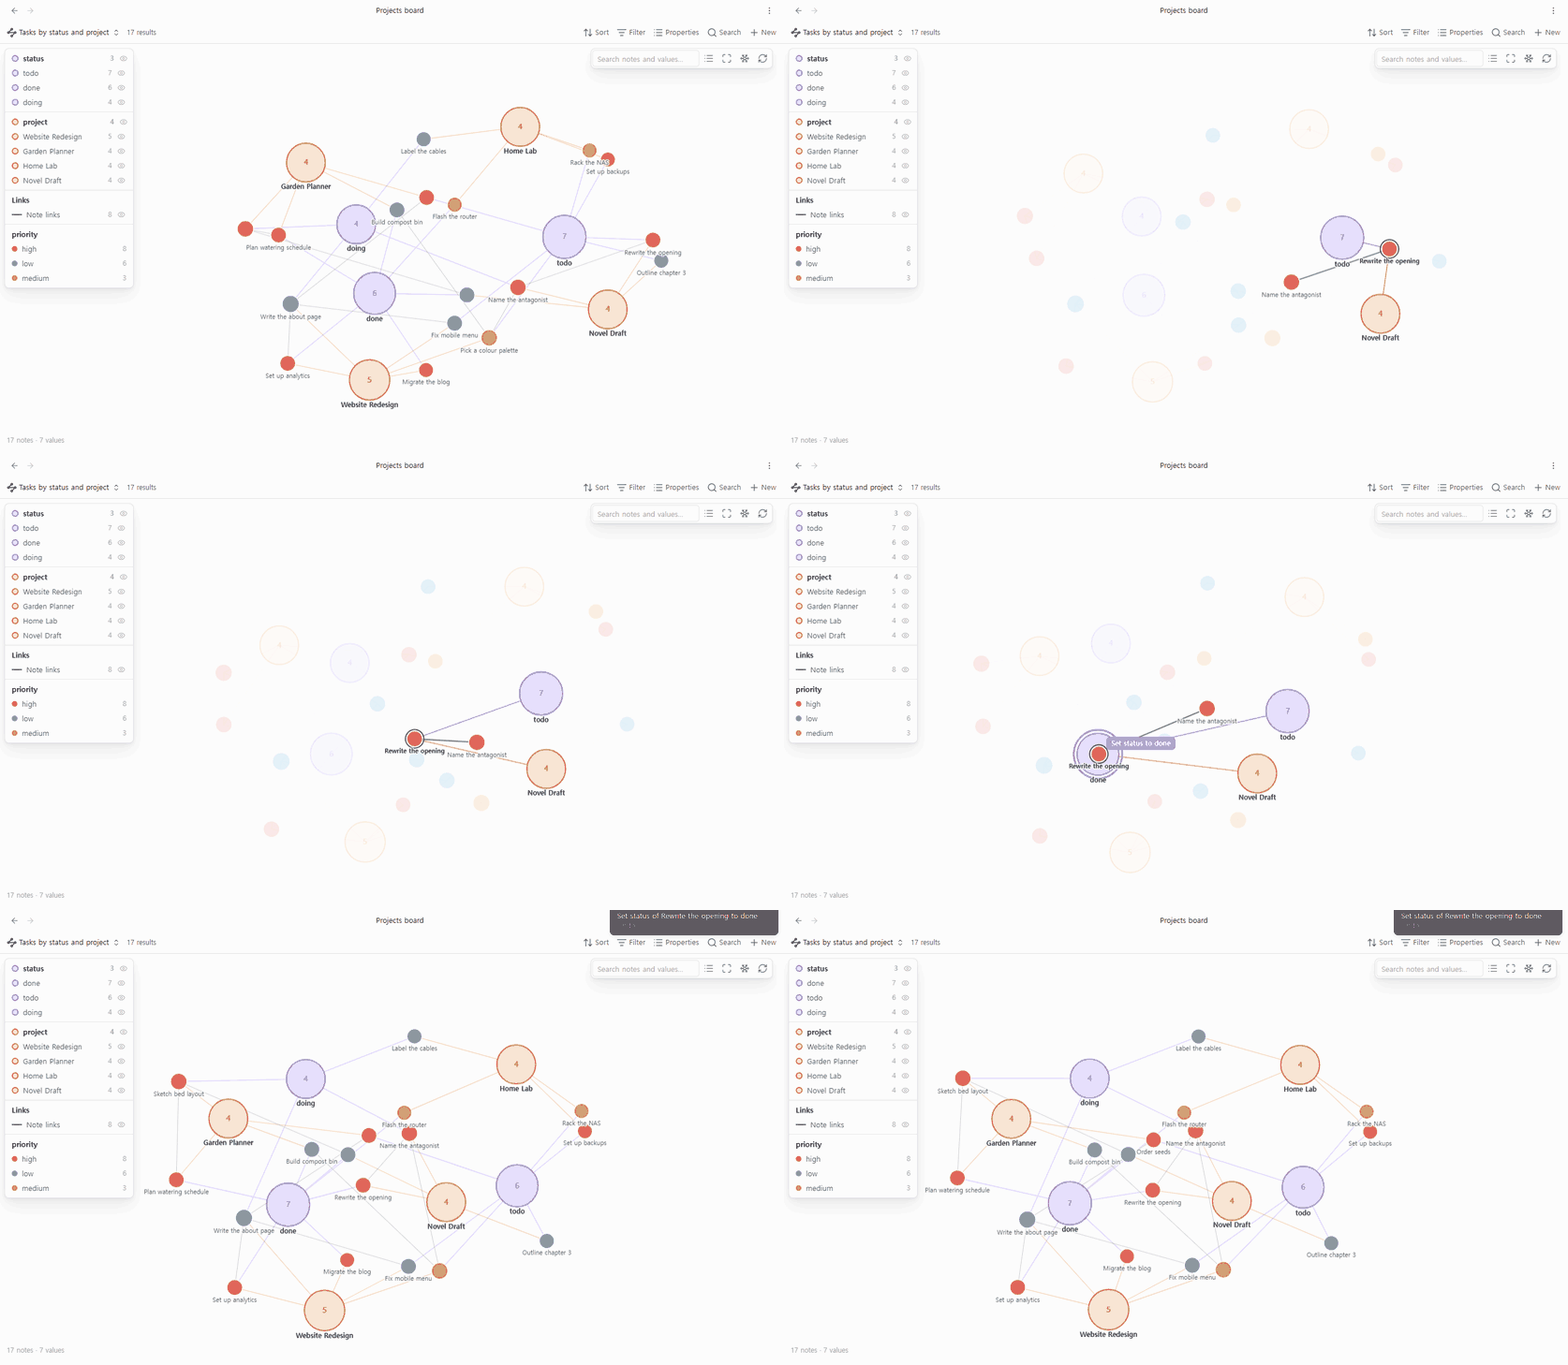
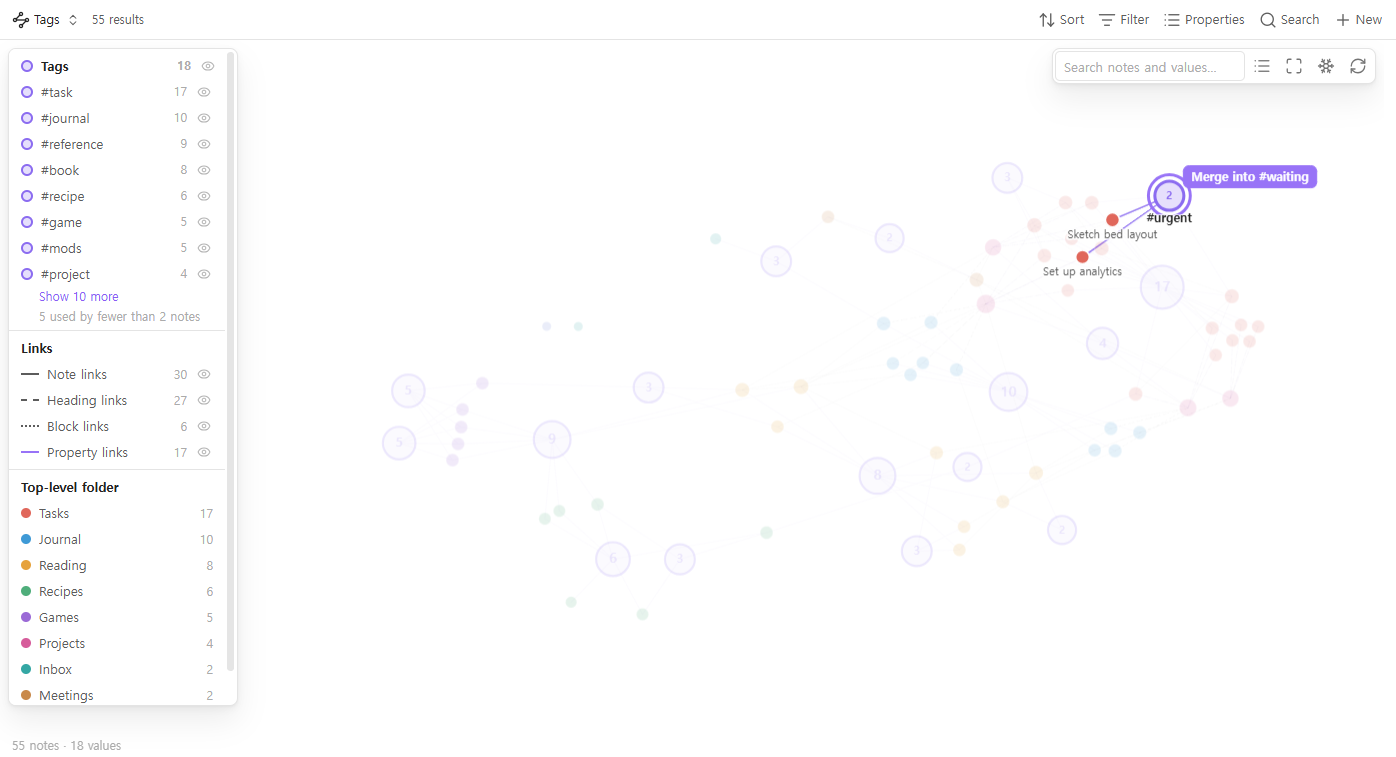
read-only: drop a note on a tag to tag it, drop one tag on another to merge them.
Built from what people asked for
Tag Graph started from reading six months of feature requests on the Obsidian forum (April–October 2026) and collecting the graph and tag requests that were still open. Each row is a real thread; the right column is what Tag Graph does about it.
| What people asked for | What Tag Graph does |
|---|---|
| Filter the graph by tag frequency — hide tags used only once, so typo tags stop cluttering the graph | Hide values used by fewer notes than n (default 2). The legend says how many were hidden. |
Folder-aware tags — see which folder a reused tag like #toread was used in, without typing #games/toread by hand |
Split values by folder: one hub for the tag, plus a sub-hub for each folder it is used in. |
| Toggle graph groups on and off quickly | An eye icon on every tag and every property in the legend. Click a tag to highlight its notes. |
| Multi-coloured nodes — a note with several tags should show all their colours | A pie slice per value, up to four. |
| Tell heading and block links apart · hide frontmatter links | Note, heading ([[a#b]]), block ([[a#^c]]), property and embed links are drawn differently, and each kind can be switched off. |
| Search that highlights instead of hiding | Matches get a ring, the rest stays on screen, dimmed. Enter zooms to the matches. |
| Freeze the graph — stop it rearranging itself | A seeded layout that opens the same way every time, edits that only move the note you changed, and a Freeze button. |
| Use Bases filters in the graph instead of typing search syntax | It is a Bases view: the base's filters decide what is drawn. Graph one project, one folder or one query. |
| A graph view you can work in · a quicker way to add tags | Drag to tag. Drop notes on tags and properties to change them, merge tags by dropping one on another — see below. |
Drag to tag
The graph is a way to change your notes, not only to look at them.
| Drag | onto | does |
|---|---|---|
| a note | a tag or value | adds it (a list property gets it appended; a single-value property like status is set to it) |
| a note | a folder | moves the note into that folder |
| a note | a note that is a value (e.g. a project note) | sets that property to a link to it |
| a note | another note | adds a link to the other note in a property you choose (related by default) |
| a tag | another tag | merges them: every note in the base gets the second tag instead of the first |
Right-click a tag or value to rename it across the notes in the base — in
the tags property and in #tags written in the note text — or to create a
new note that already has it. Right-click a note to remove one of its tags
or values.
Every edit shows a notice with Undo, and Undo last edit is a command too. Undo only goes ahead if the files are still exactly as the edit left them.
More than tags
Tags are the first hub property, but you can pick up to four: any note property
(status, project, author, area…), formulas, file.folder or file.ext.
A property that holds links, such as project: "[[Home Lab]]", joins its notes
straight to the project note when that note is in the graph.
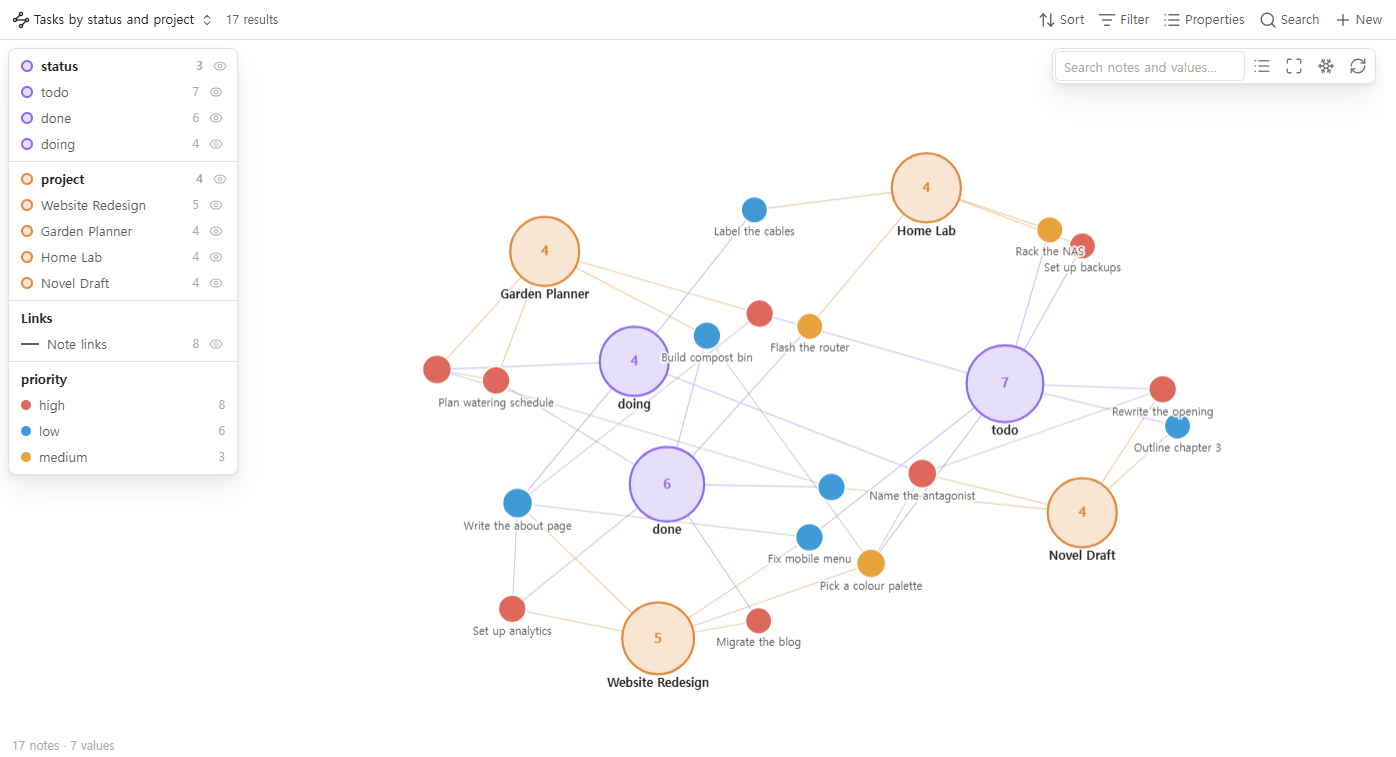
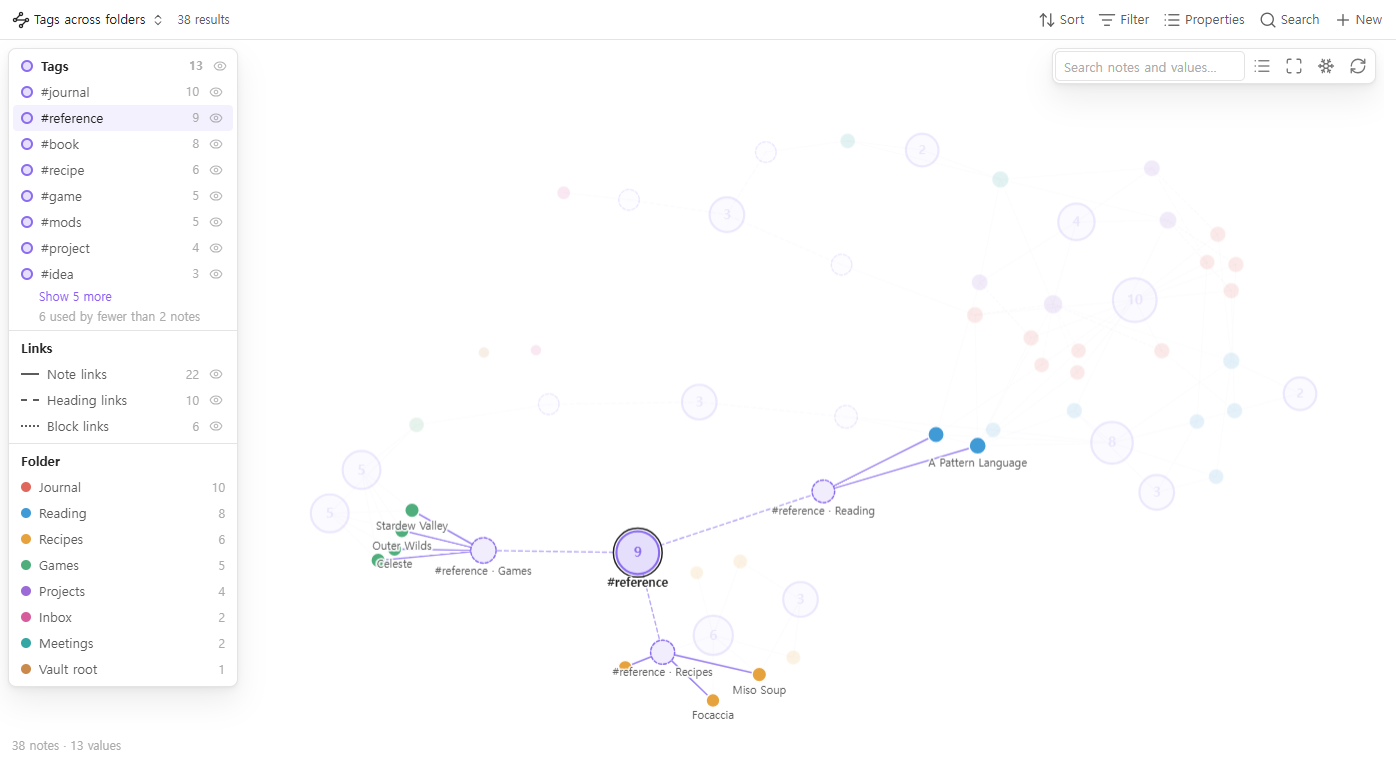
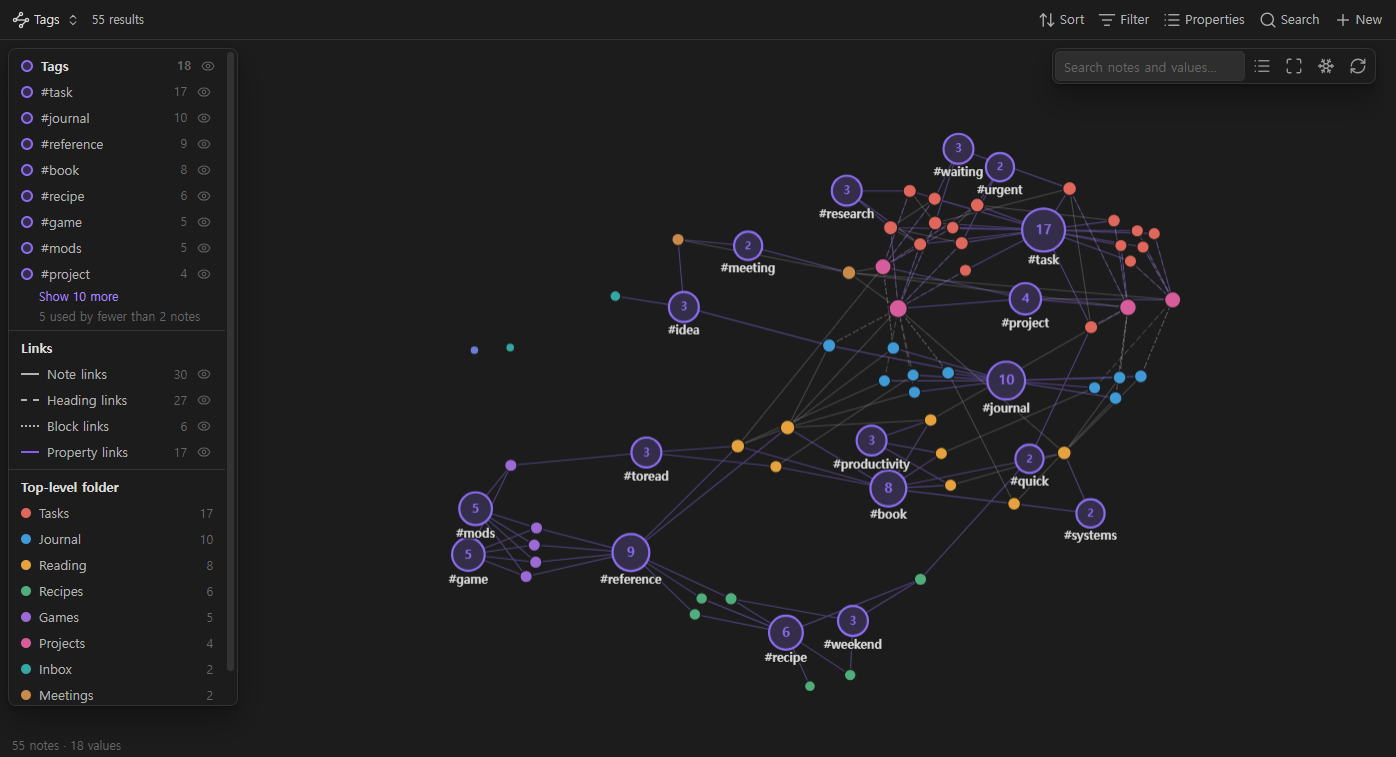
Notes are coloured by any property you choose, by the base's grouping, or — by default — by top-level folder, so where a note lives shows at a glance.
It follows your theme, light or dark:
Getting started
- Install Tag Graph from Settings → Community plugins. The Bases core plugin must be on.
- Run Tag Graph: Create a base with a tag graph from the command palette.
Or open any
.basefile, select Add view, and choose Tag graph. - That's it: tags are the hubs until you pick other hub properties in the view options.
Using the graph
- Click a note to open it (Ctrl/Cmd-click: new tab). Ctrl/Cmd-hover for a page preview.
- Click a tag to highlight its notes. Double-click it to zoom to them. The same works in the legend, and hovering a legend row previews its notes on the graph.
- Hover a node and its connections fade in while the rest fades back — quickly, but without a jolt.
- Drag to edit. While you drag, the note's own connections stay highlighted and the target under the pointer holds still.
- Scroll to zoom, drag the background to pan. Esc cancels a drag and clears the highlight.
- On a phone or tablet: pinch to zoom, tap a note to see its tags, tap again to open it, long-press for the menu.
View options
| Option | Default | |
|---|---|---|
| Property 1–4 | Tags, none, none, none | Note properties, formulas, file.tags, file.folder, file.ext |
| Hide values used by fewer notes than | 2 | A value that is itself a note in the graph is always drawn |
| Split values by folder | off | |
| Colour notes by | grouping, else top-level folder | |
| Show notes with no connections | on | |
| Note dropped on note links it in | related |
Leave empty to switch off |
Graph settings
The gear button in the graph's toolbar opens the controls you know from
Obsidian's own graph view, with the same ranges and defaults. Changes show
while you drag a slider and are saved with the view, in the .base file.
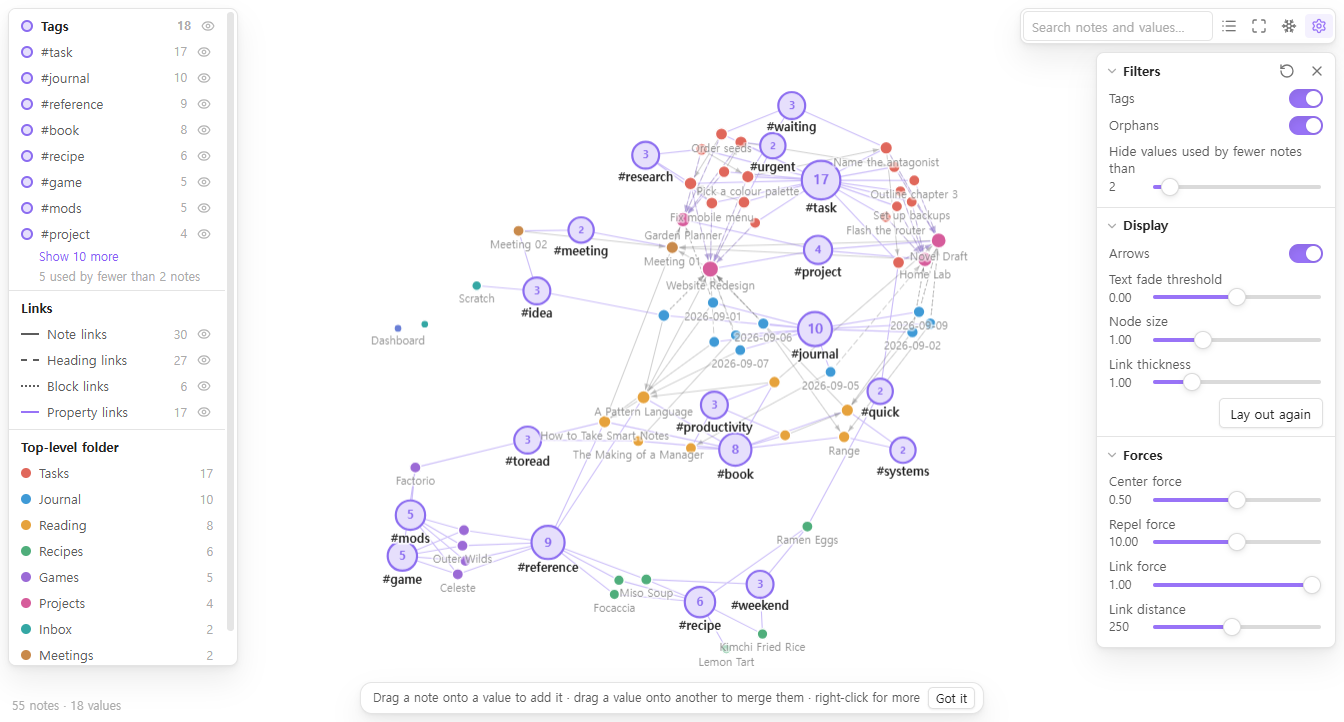
| Section | Controls |
|---|---|
| Filters | Each hub property on or off (e.g. Tags), orphans, the rare-value cut-off |
| Display | Arrows (on note-to-note links; both ways when the notes link each other), text fade threshold, node size, link thickness, lay out again |
| Forces | Center force, repel force, link force, link distance |
The ↻ button puts every control back to its default.
Settings
- Confirm before changing many notes (on) — before a merge that touches more than one note.
- Confirm before moving files (on) — before a drop on a folder moves a note.
- Change tags in the note text too (on) — renames, merges and removals also
change
#tagsin the body, not only thetagsproperty. Only the exact tag is changed:#todo/subis a different tag from#todo. - Animate the layout (on) — off lays the graph out before showing it and then keeps it still.
- Show the editing hint (on).
The interface is in English and Korean, following Obsidian's language.
What it touches
- Reads the notes the base returns, and their metadata from Obsidian's cache.
- Writes only when you drop, rename, merge, remove or create — and only to
the notes the base returns. A rename never reaches notes outside the base.
Frontmatter is changed through Obsidian's own
processFrontMatter; moves go through Obsidian's file manager, so links are updated as your settings say. - No network. The plugin makes no requests and loads no code at runtime.
d3-force is bundled into
main.js.
Limits
- Calculated values (formulas, and file properties other than tags and folder) are drawn but cannot be changed by dragging.
- Undo covers the last edit only.
- Built for bases of up to a few thousand notes. On 3,000 notes the first layout takes about a quarter of a second.
Feedback
Found a bug, or a request this should answer? Open an issue.
Building
npm install
npm test
npm test type-checks, builds main.js, runs the unit tests in
scripts/test.mjs (graph model and frontmatter edits) and checks the bundle for
network calls, innerHTML, console.log and manifest consistency.
npm run demo-vault -- <dir> writes the sample vault used for the screenshots.
License
MIT © Elliott Park. Includes d3-force and its dependencies (ISC) — see THIRD-PARTY-NOTICES.md.