Simple Gantt
 nexsis400 downloads
Plan projects on a clean Gantt chart: phases, tasks, milestones, deadlines, key dates and locations, with one-line quick add and print-ready export.
- Overview
- Scorecard
- Updates29

Simple Gantt
A calm, beautiful Gantt chart for Obsidian.
Plan a project, or a whole dissertation year, on one timeline. Your plan stays a normal note, and one click gives you a print-ready chart for your report.
See it in action · Features · Quick add · Keyboard & mouse · Your data · Install · Support
- ⚡ One line to add anything. Type
Interviews 3–28 May #dataand it lands in the right phase on the right dates. Deadlines, milestones, places and journal notes work the same way. - 🖐️ Feels like Canvas. Drag empty space to move around, drag bars to move them, select several at once, and link steps so a delay pushes what comes after. Ticking something off gets you confetti.
- 📄 Just a note. Each timeline is a Markdown note with readable YAML. It syncs, works with git, and is still there if you ever uninstall the plugin. No accounts, no network.
See it in action
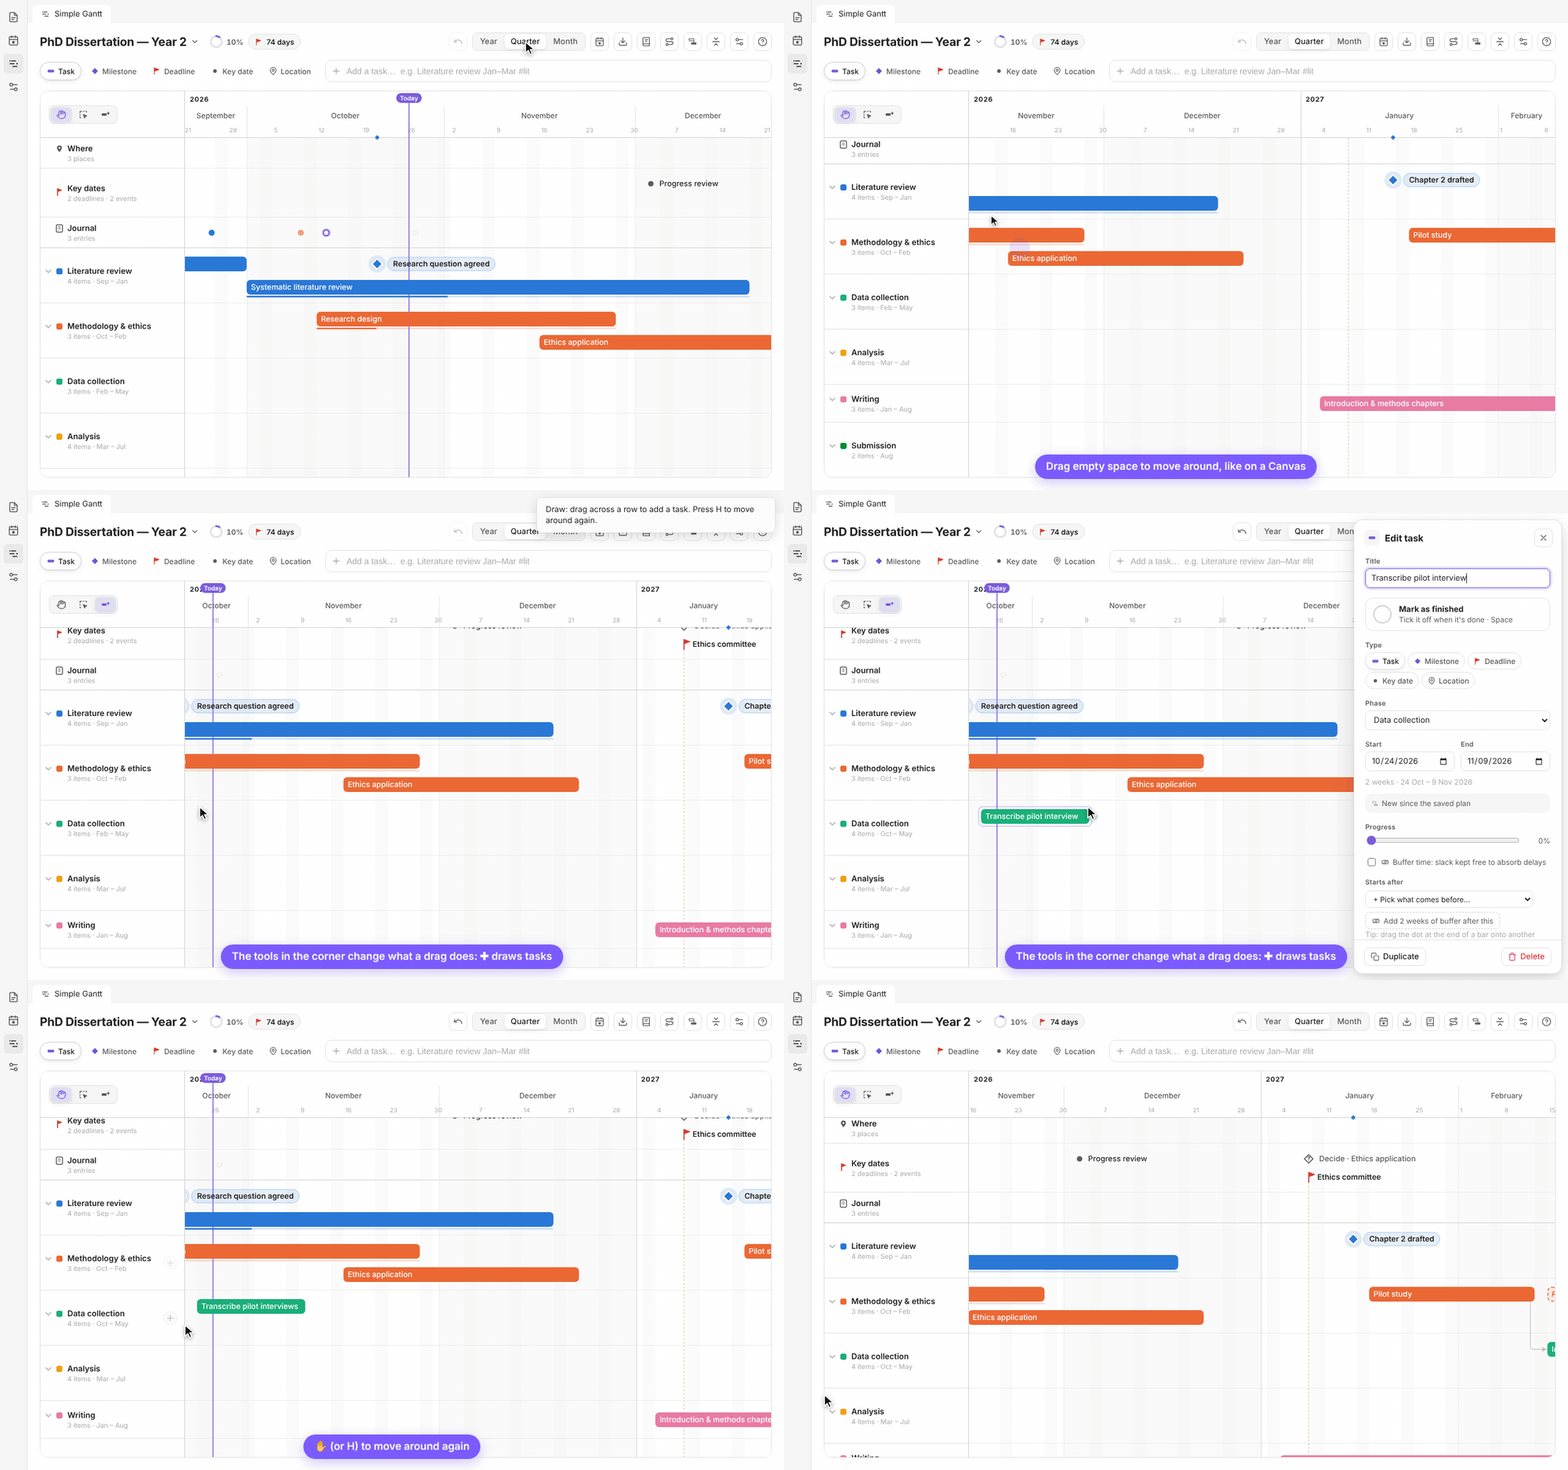
Move around like on a Canvas
Drag any empty space to move around the chart (or use the middle mouse button). The tools in the chart's top-left corner switch what a drag does: ✋ move around (H), ⬚ select (V) or ✚ draw tasks (D).
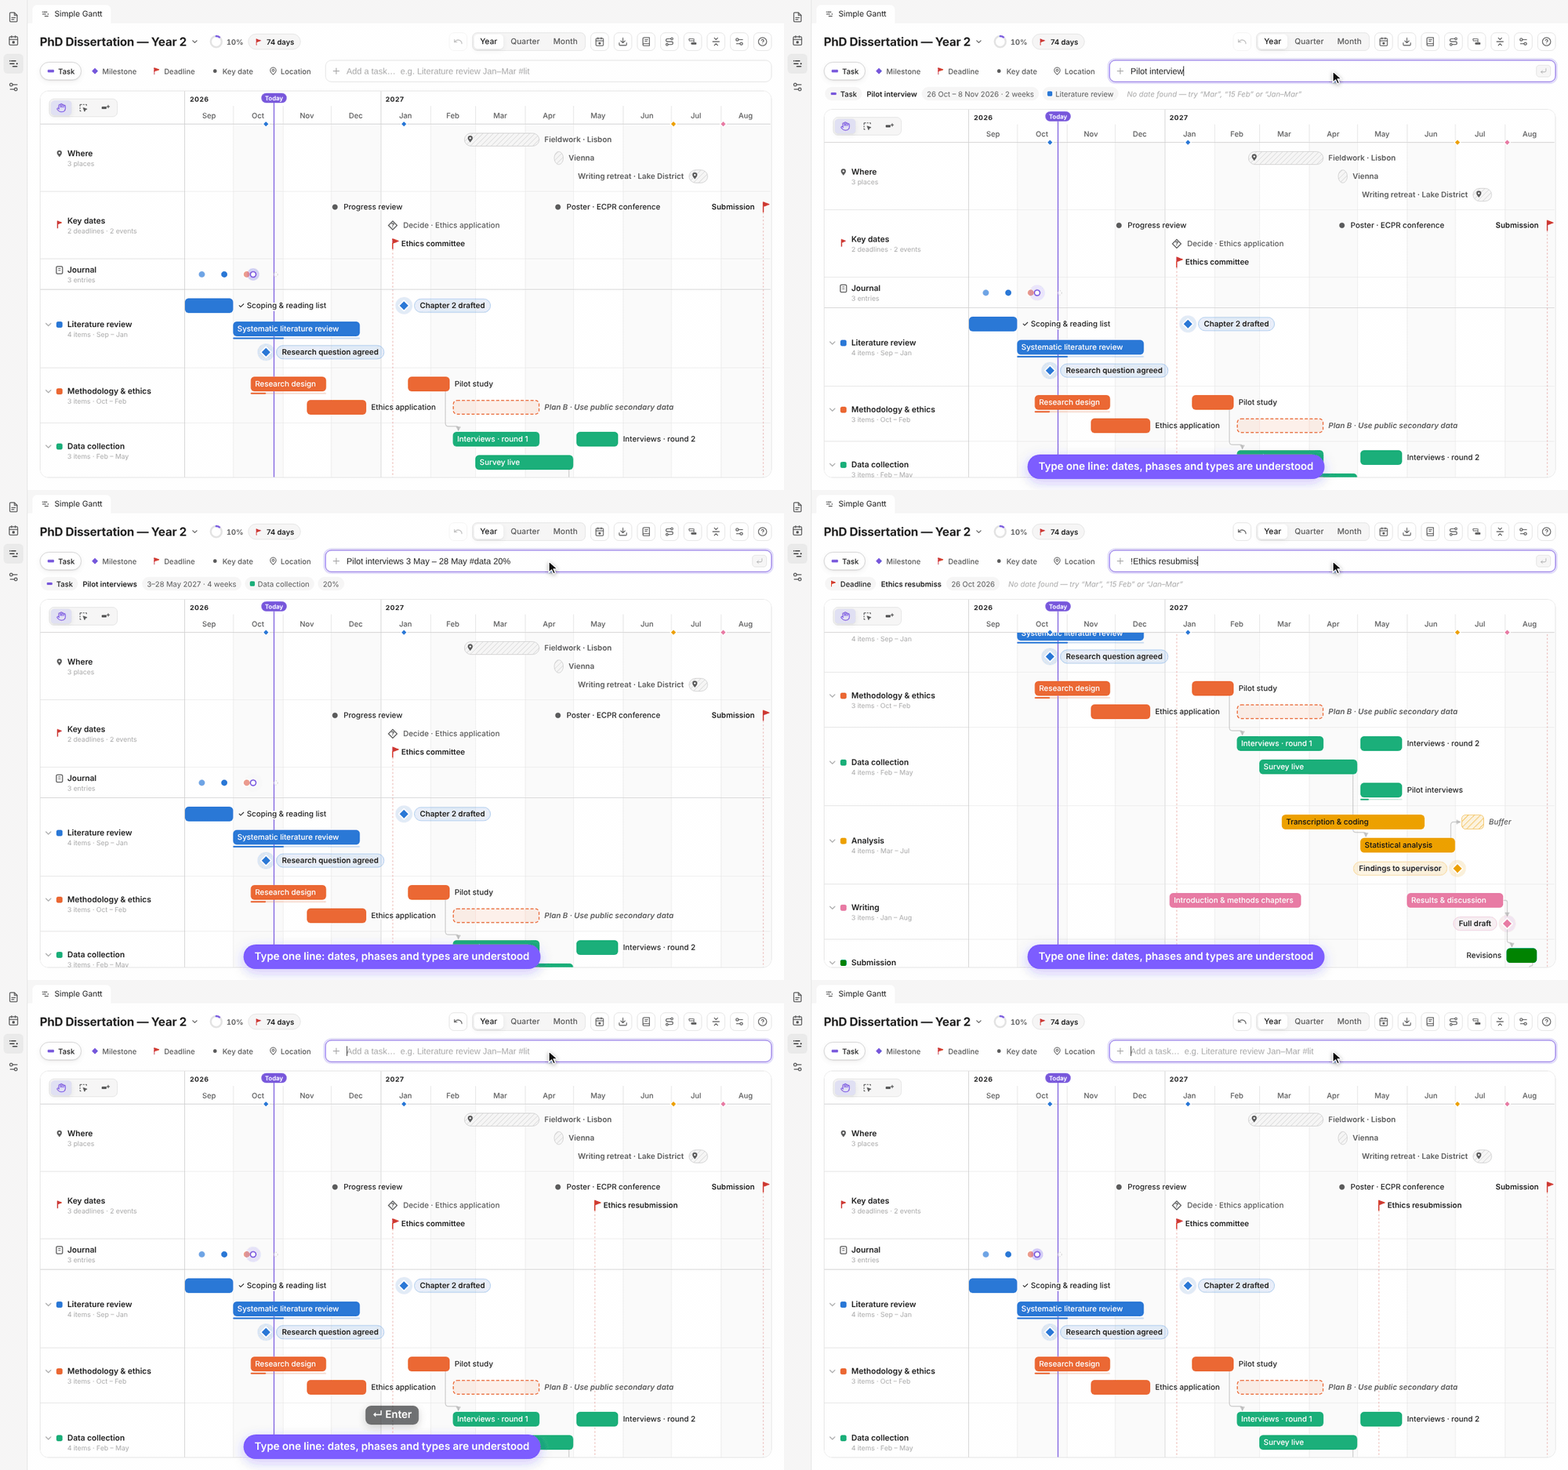
Add things in one line
The live preview shows exactly what you'll get before you press Enter.
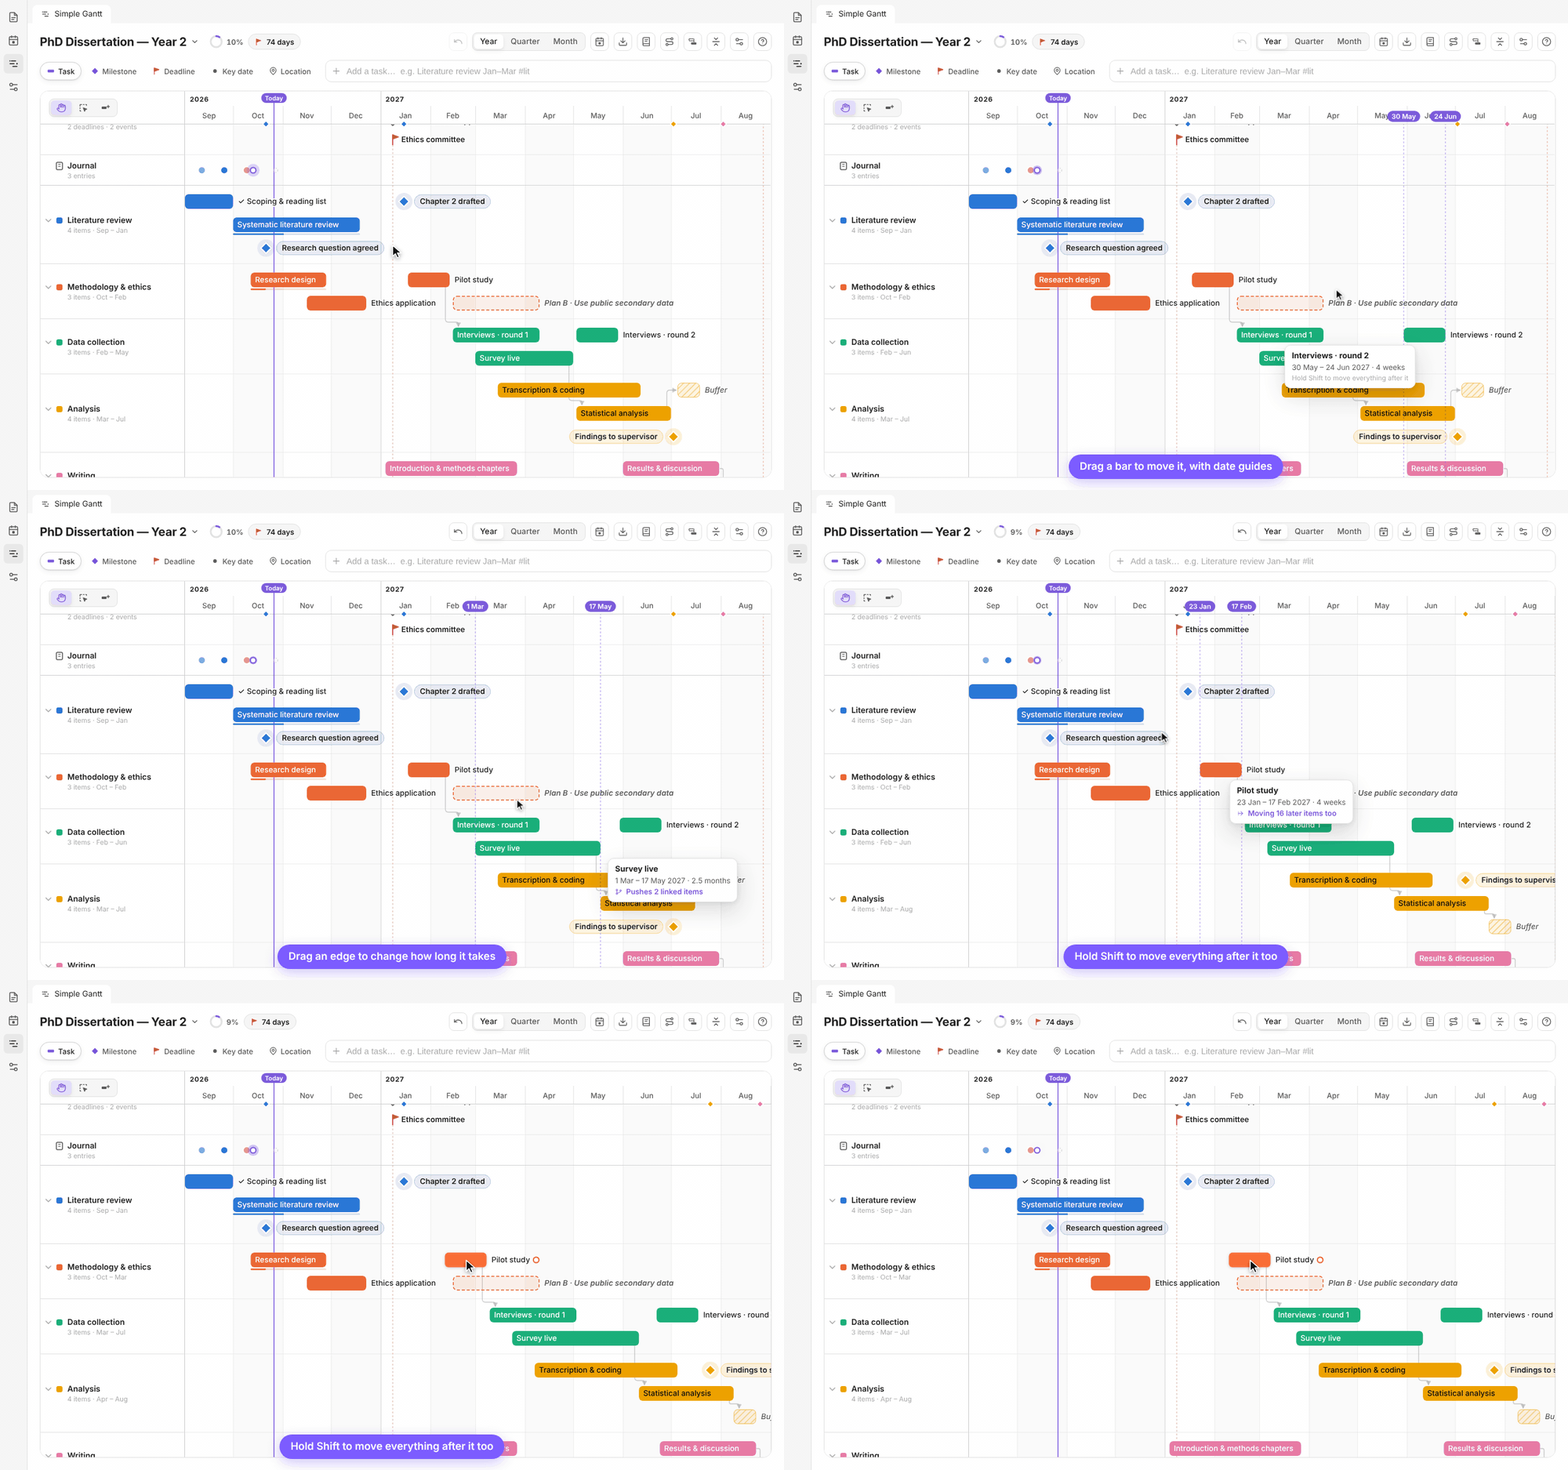
Drag to move, resize and push
While you drag, guides show the new dates. Drop a bar anywhere: on another row, in another phase, even on top of something else, and it stays where you put it (nothing else jumps out of the way). Hold Shift to keep it in its own phase, or Alt to move everything after it too. Right-click a row and choose Arrange rows automatically to go back to automatic placement.
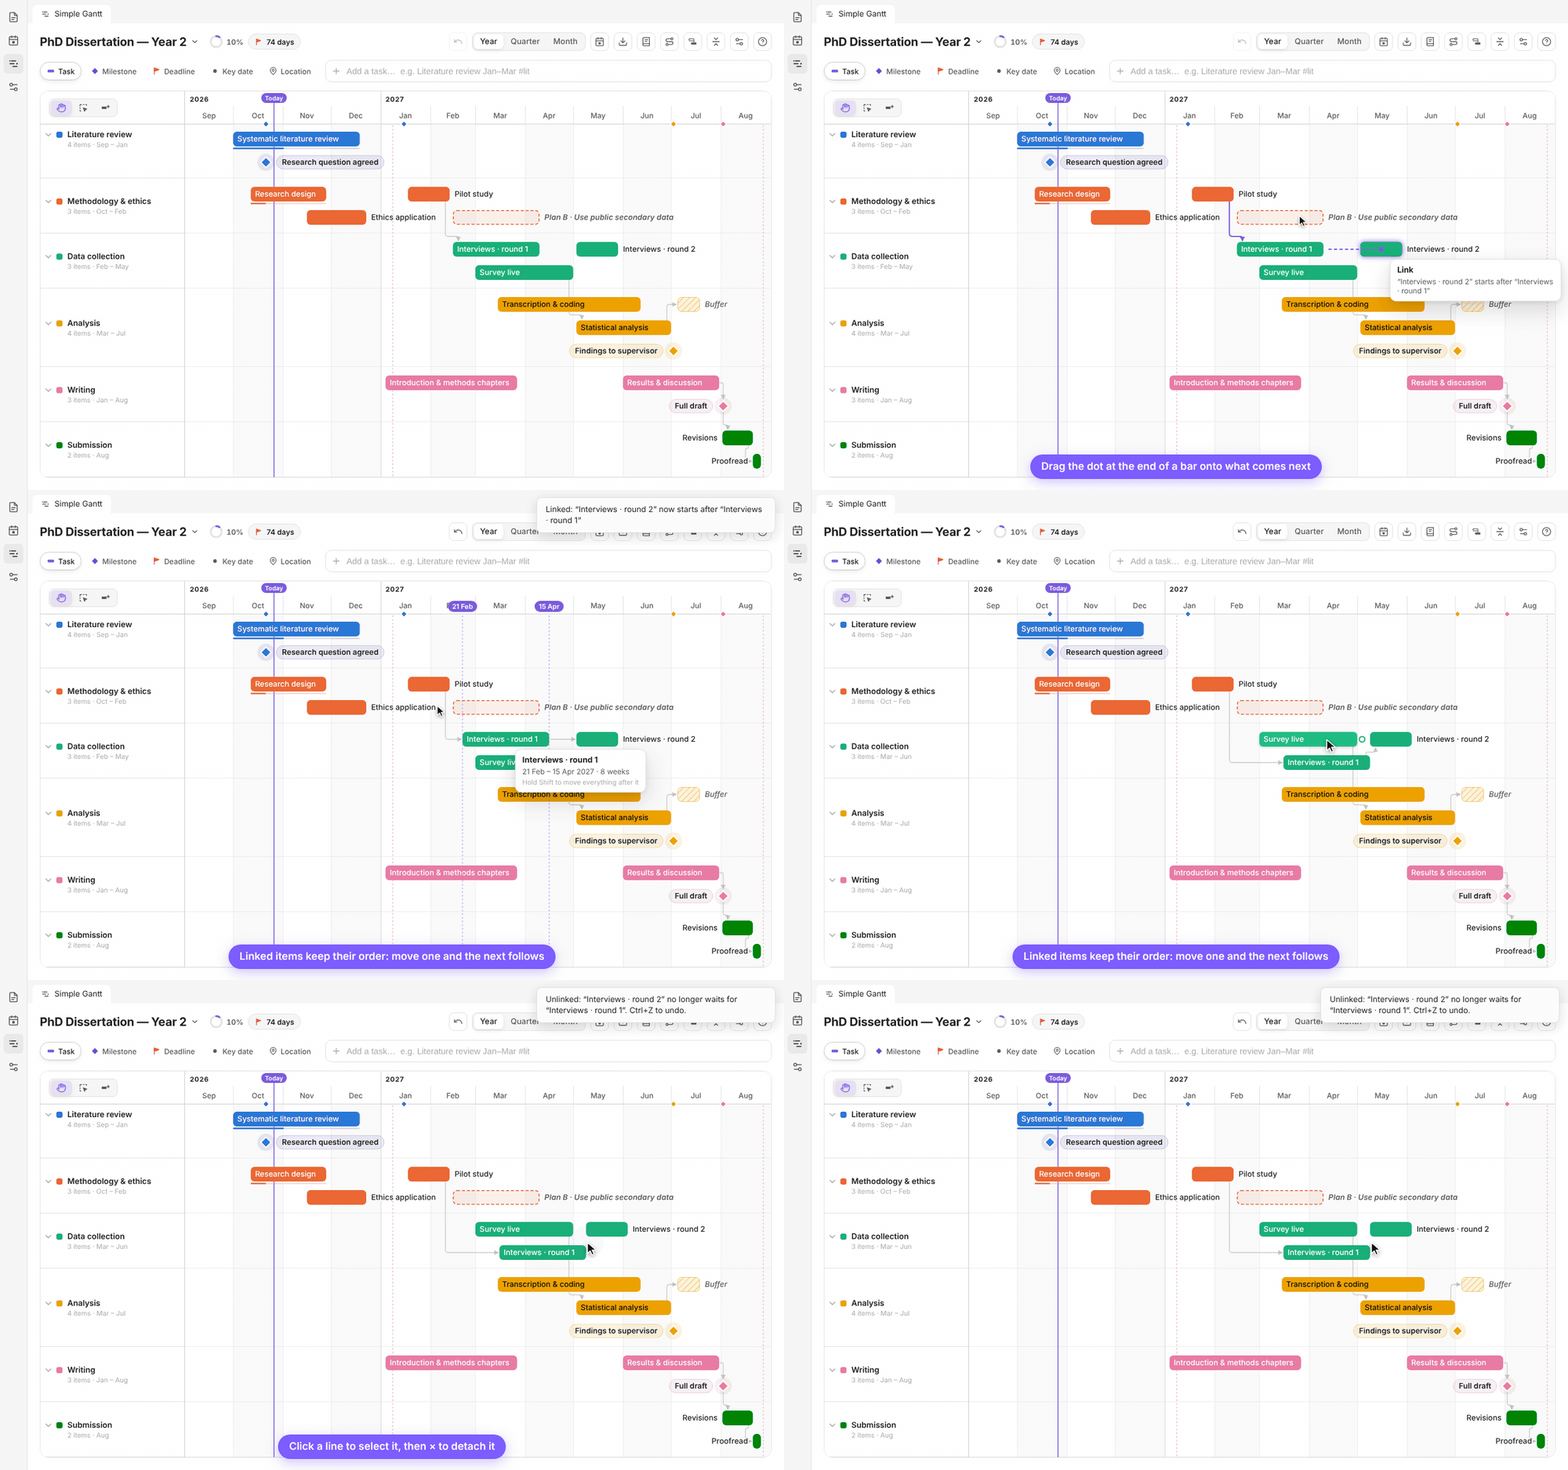
Link steps so the order holds
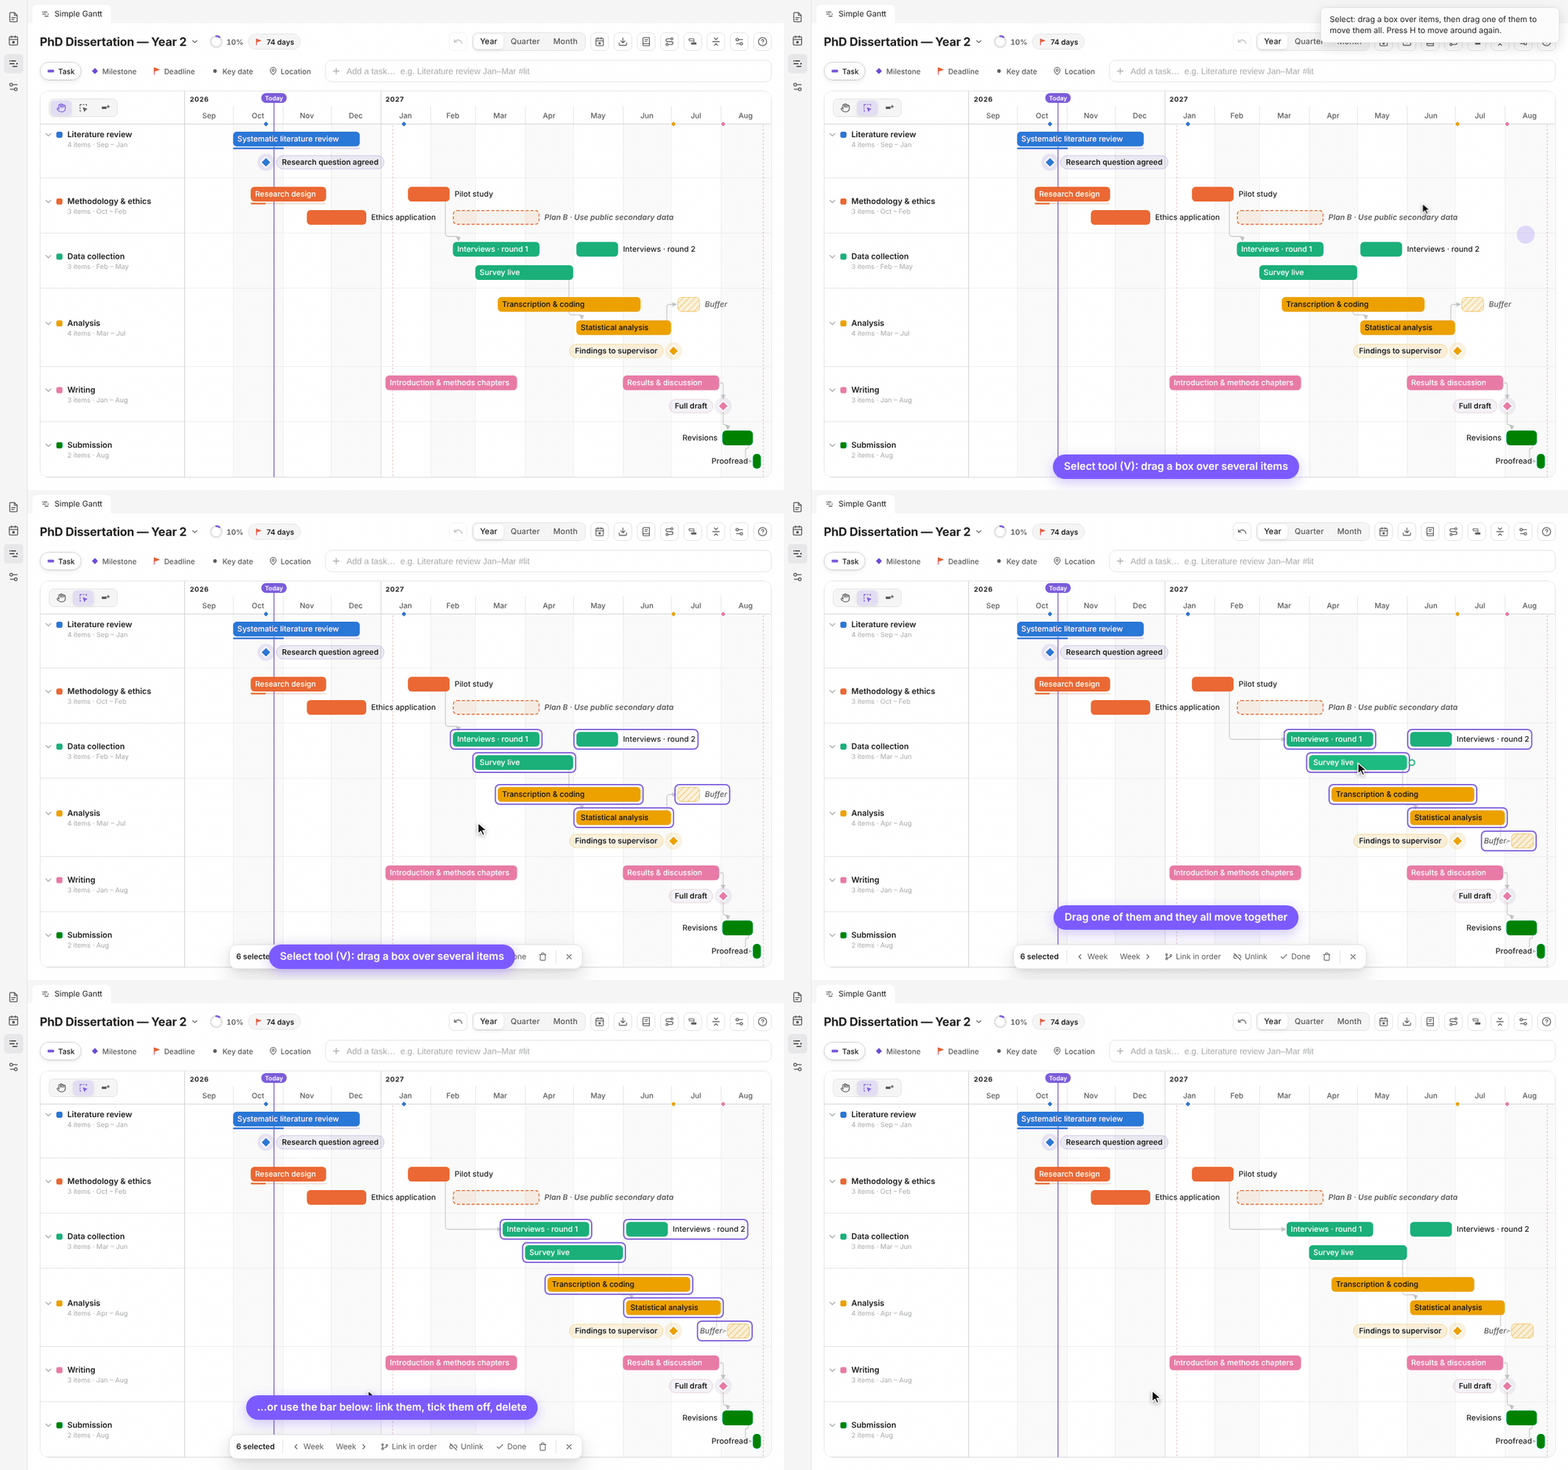
Drag the dot at the end of a bar onto what comes next. Move the first step and the next one follows. Click a line to detach it.
Select several, like on a Canvas
Pick the select tool (V), or hold Shift and drag on an empty spot, to draw a box. Drag one item and the whole group moves.
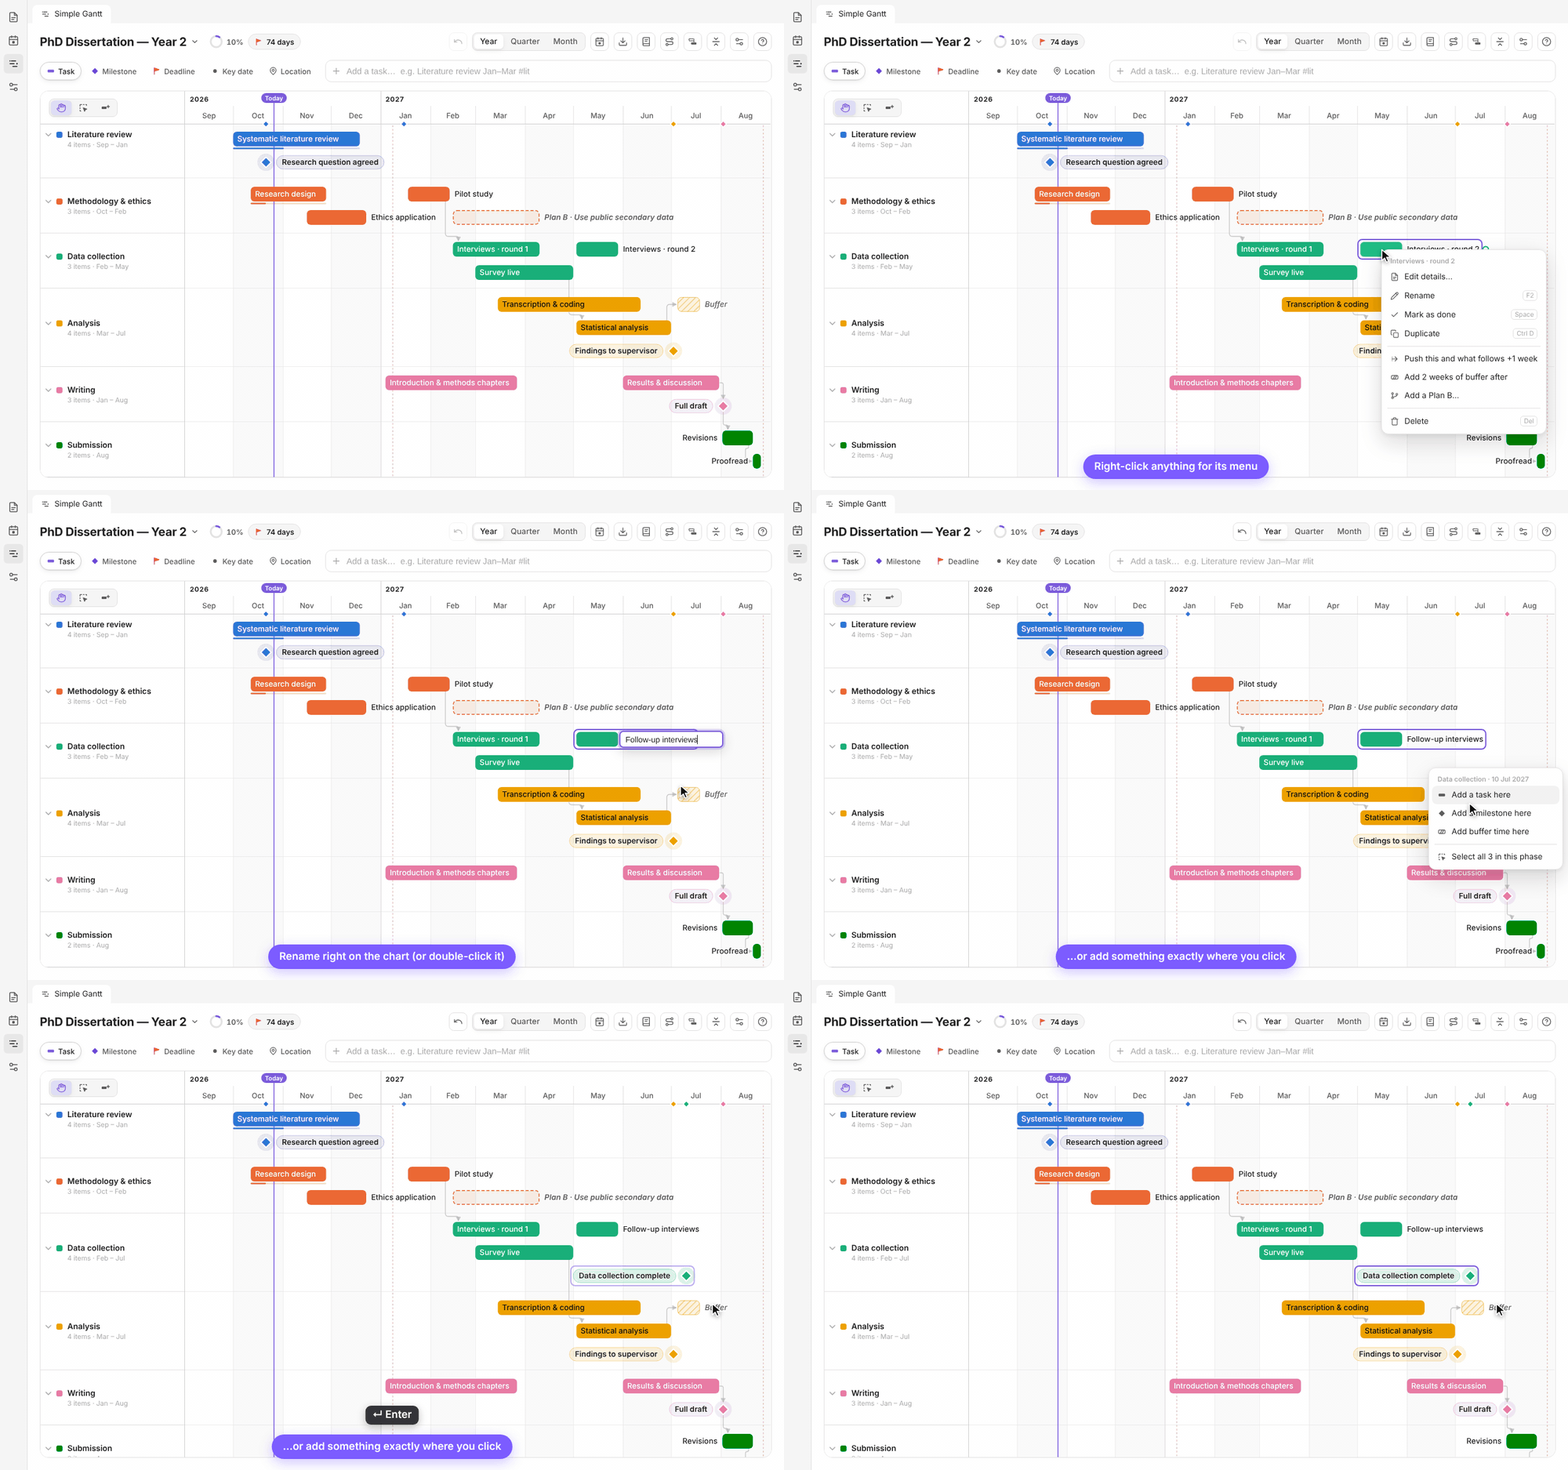
Right-click menus and renaming in place
Every item, link and row has a menu. Double-click an item (or press F2) to rename it right on the chart.
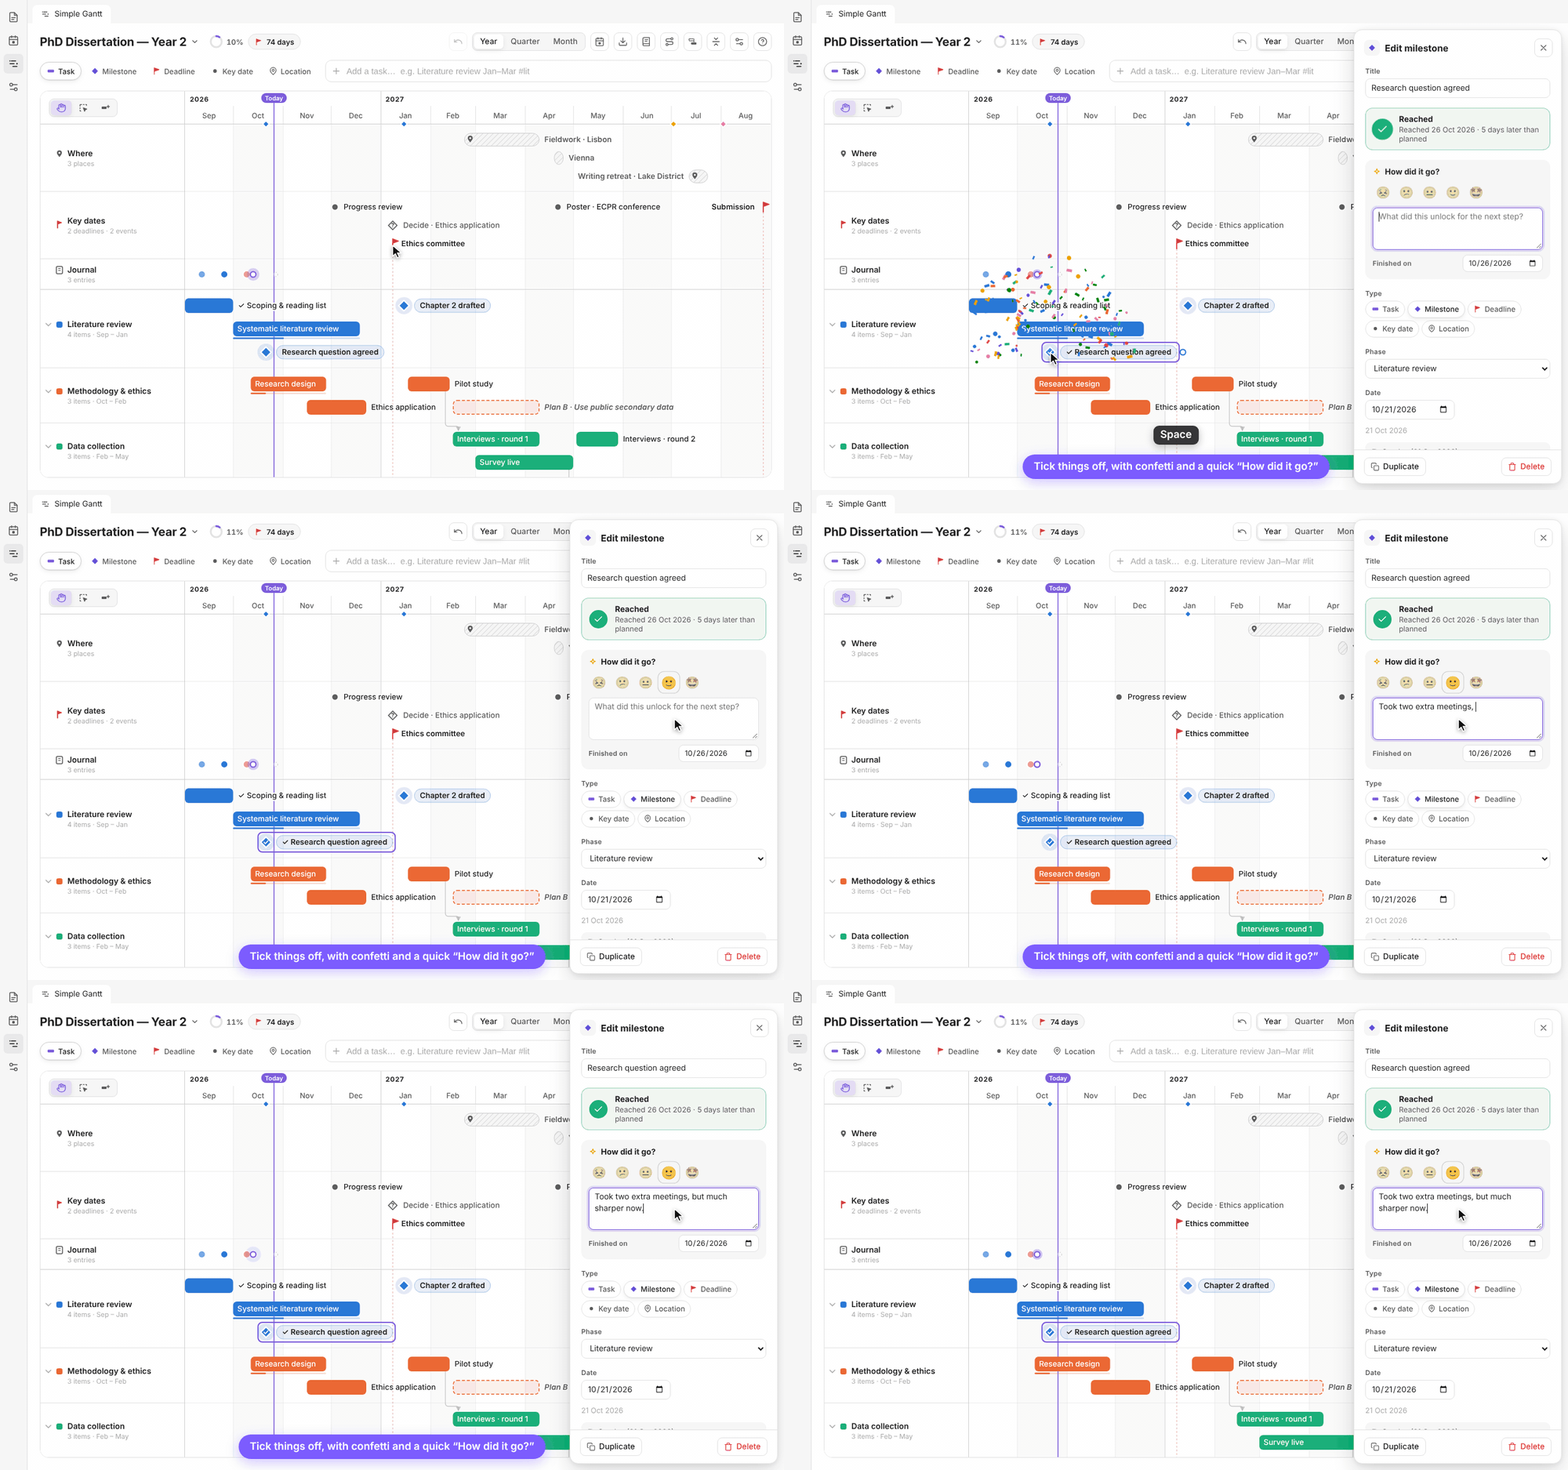
Tick things off, then ask "how did it go?"
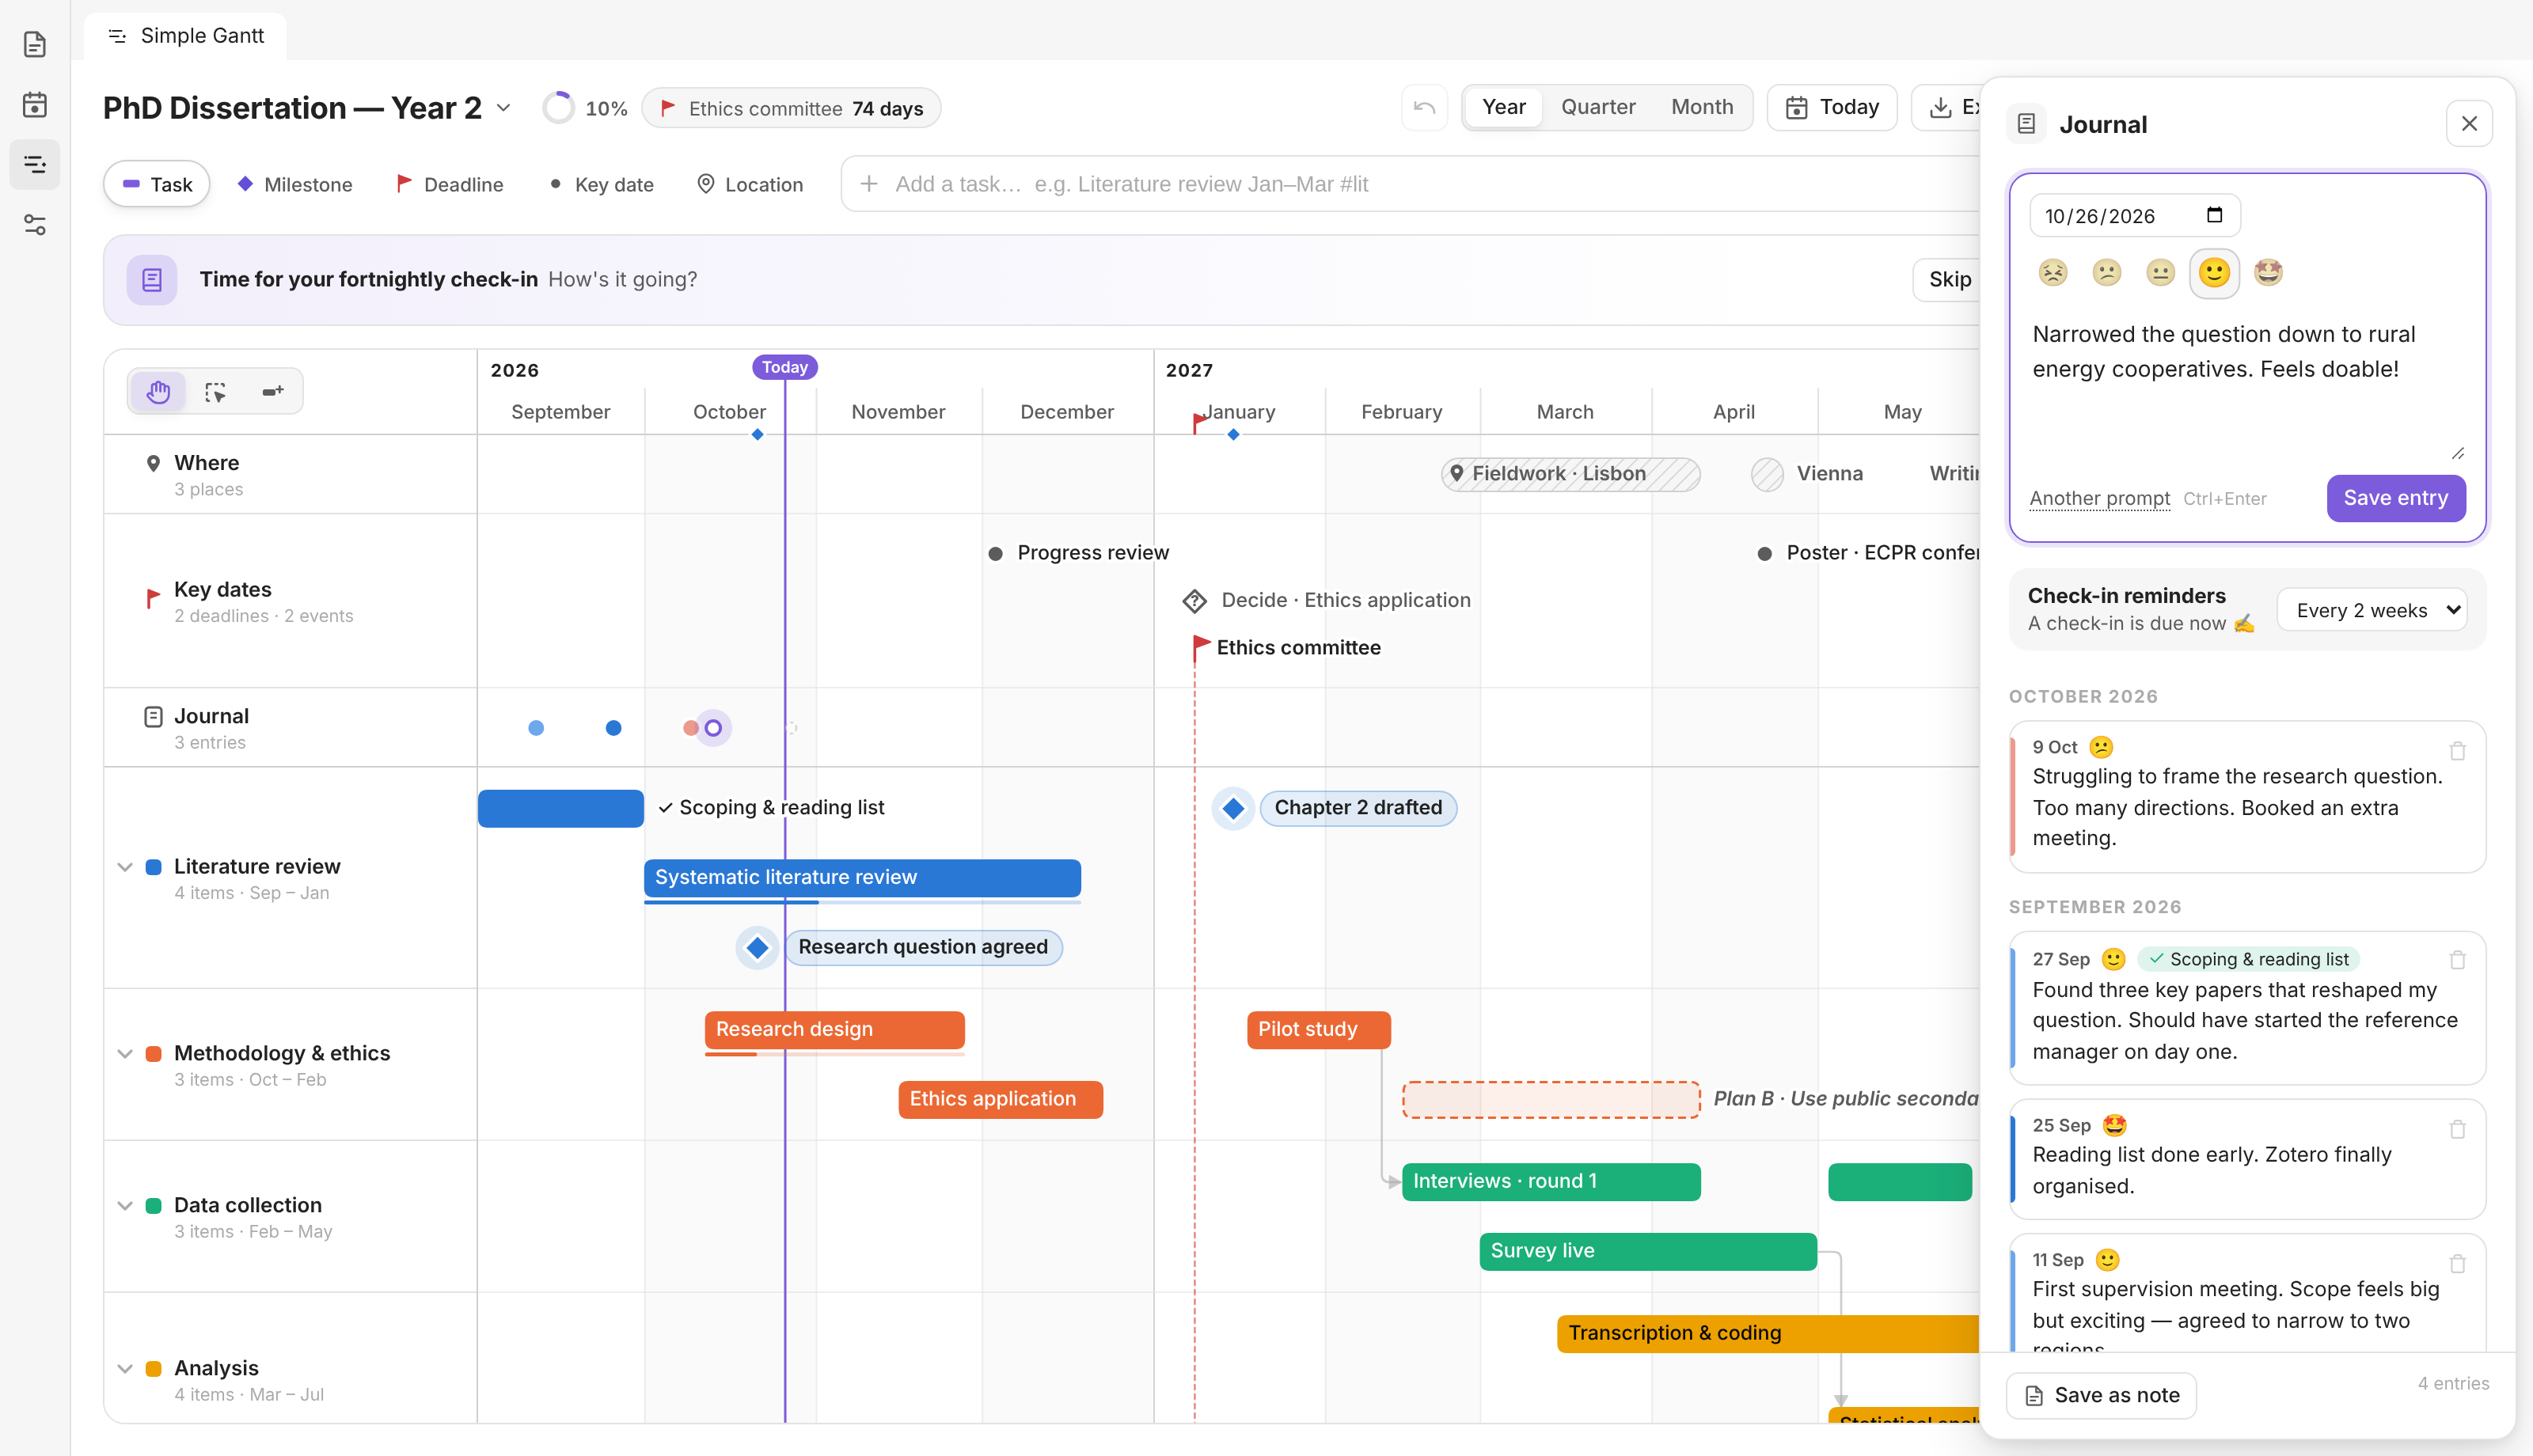
Confetti, a mood and a line of reflection, collected in a journal you can save as a note for your reflective chapter.
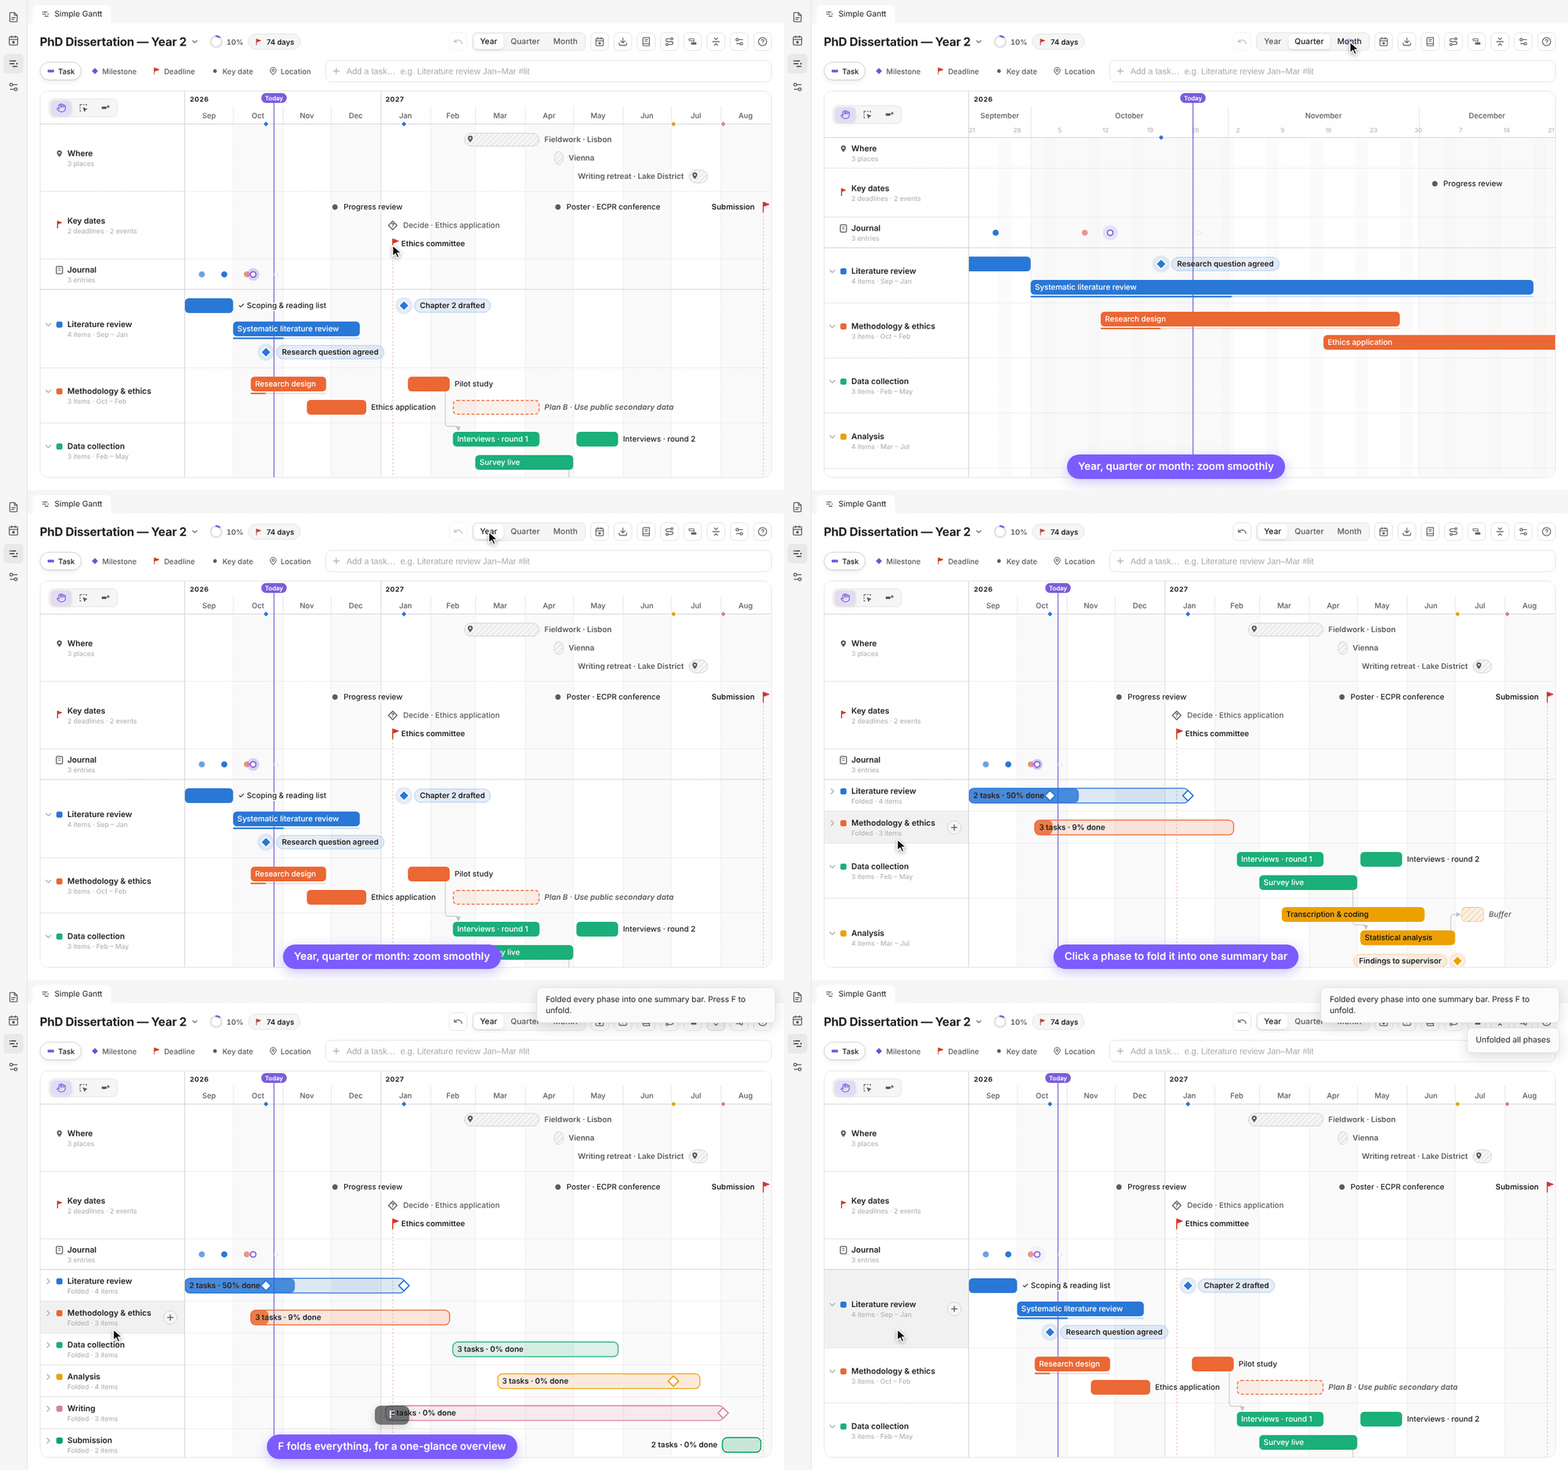
Zoom and fold
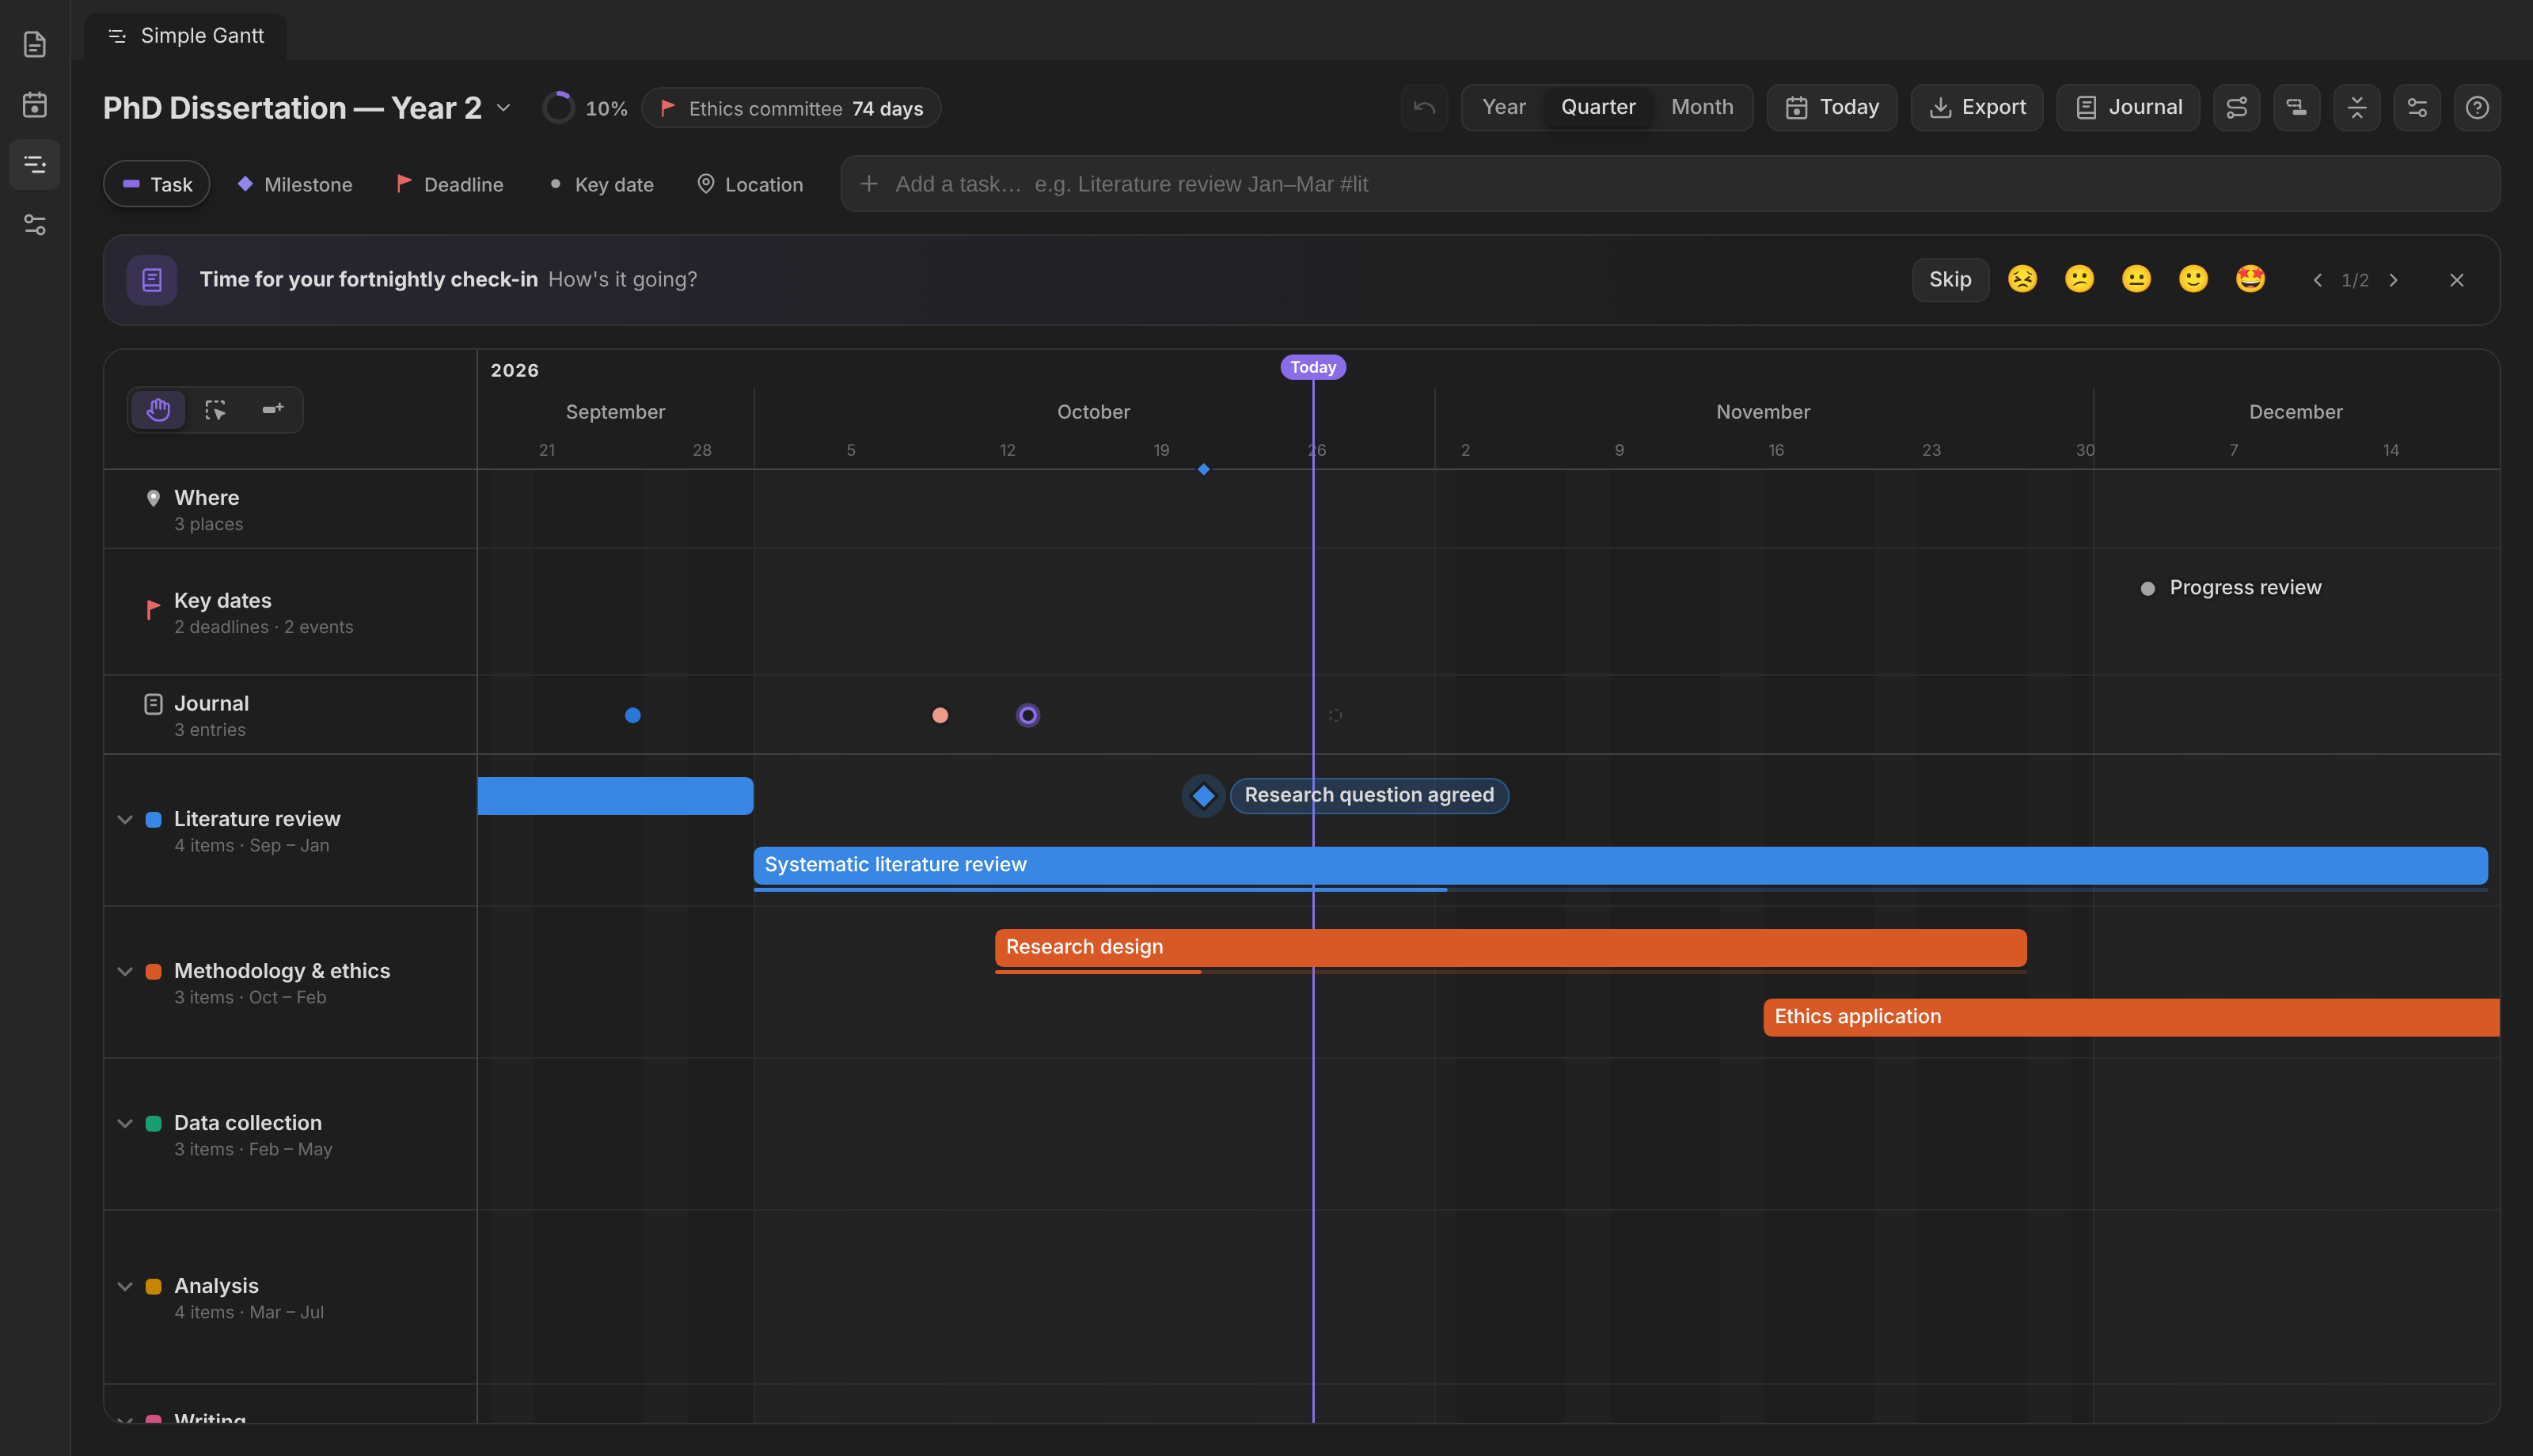
Year, quarter or month, with smooth zooming. Fold a phase into one summary bar, or press F to fold everything.
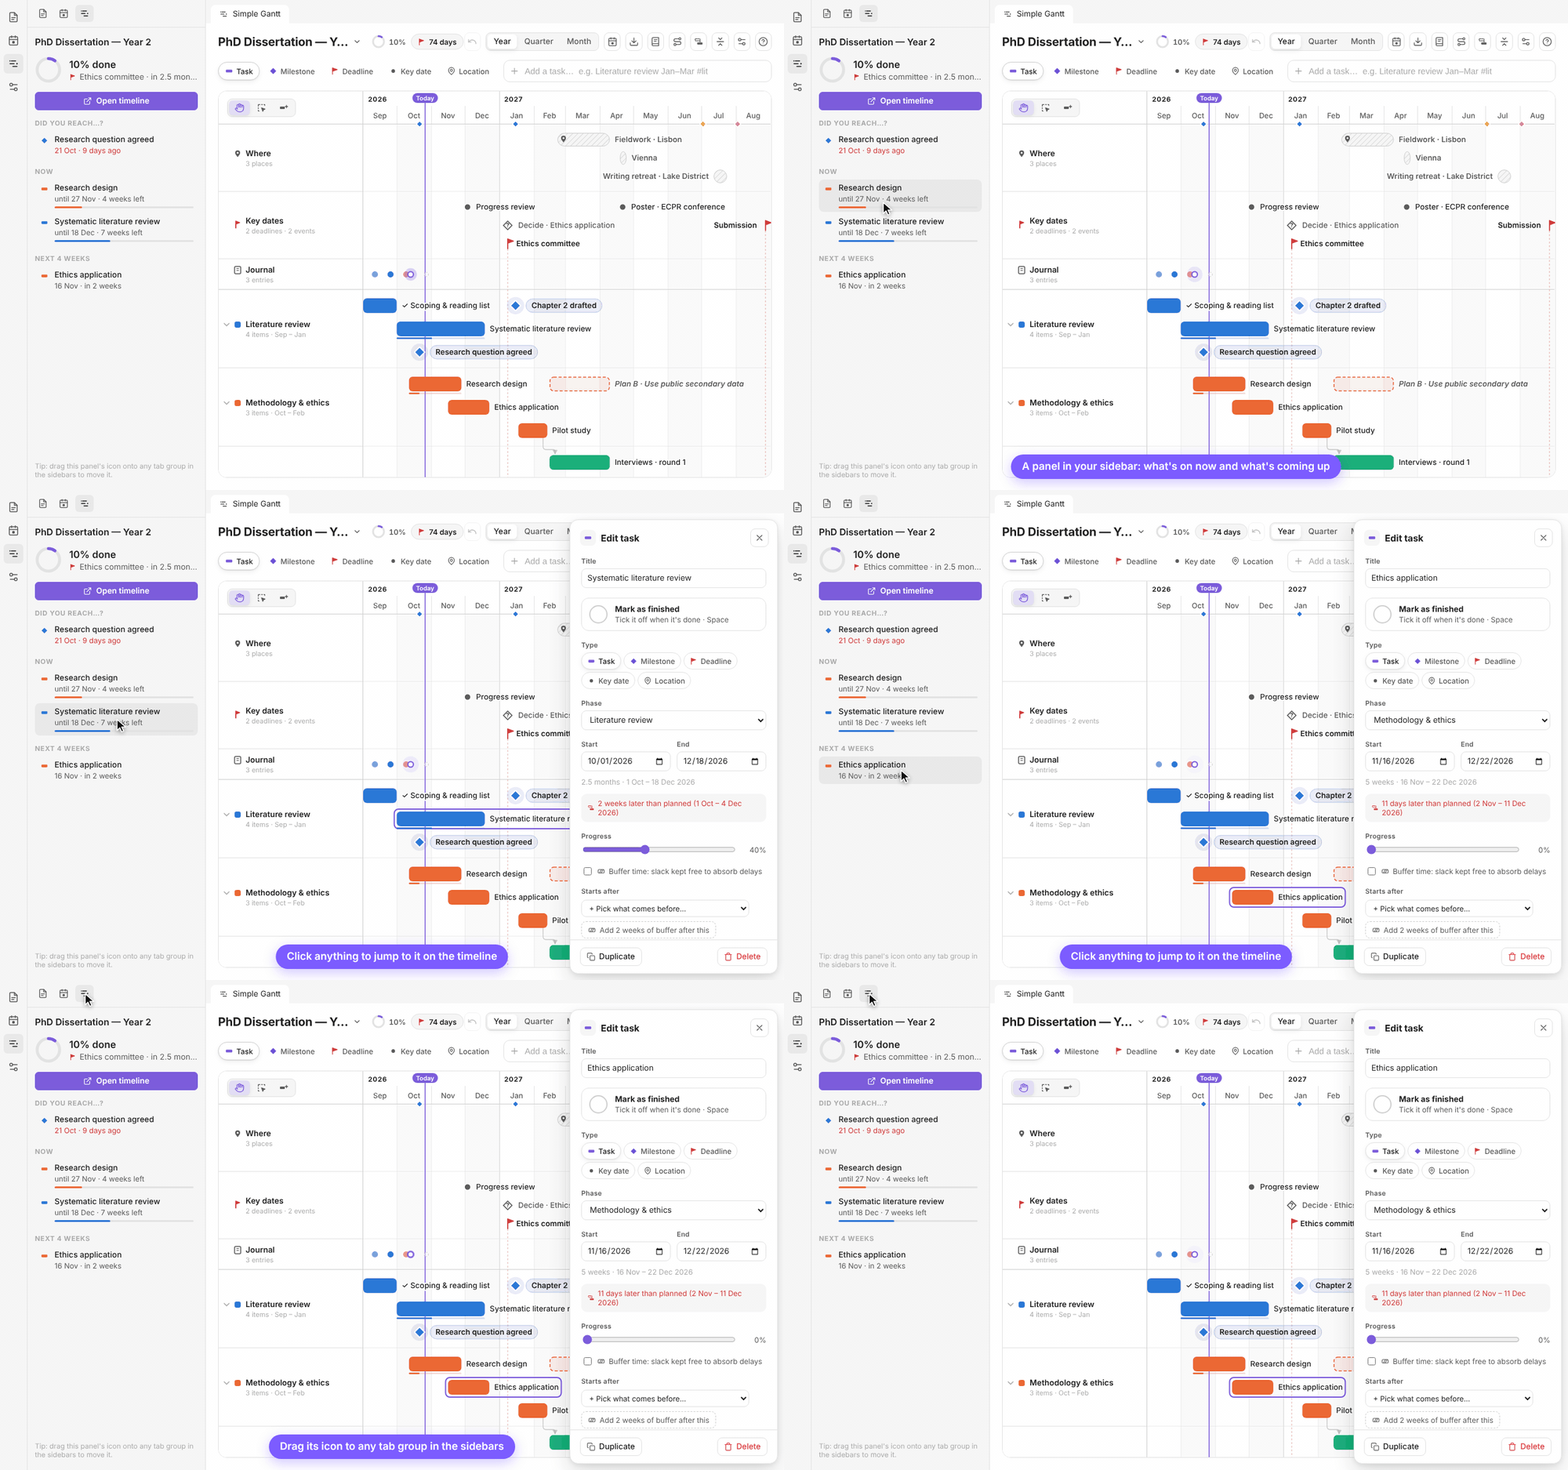
A panel in your sidebar
The overview panel shows your next deadline, what's on now and what's coming up. Click anything to jump to it on the timeline. Drag its icon to any tab group in the sidebars to put it where you like, for example next to Files at the top, or into the bottom half.
Print it, your way
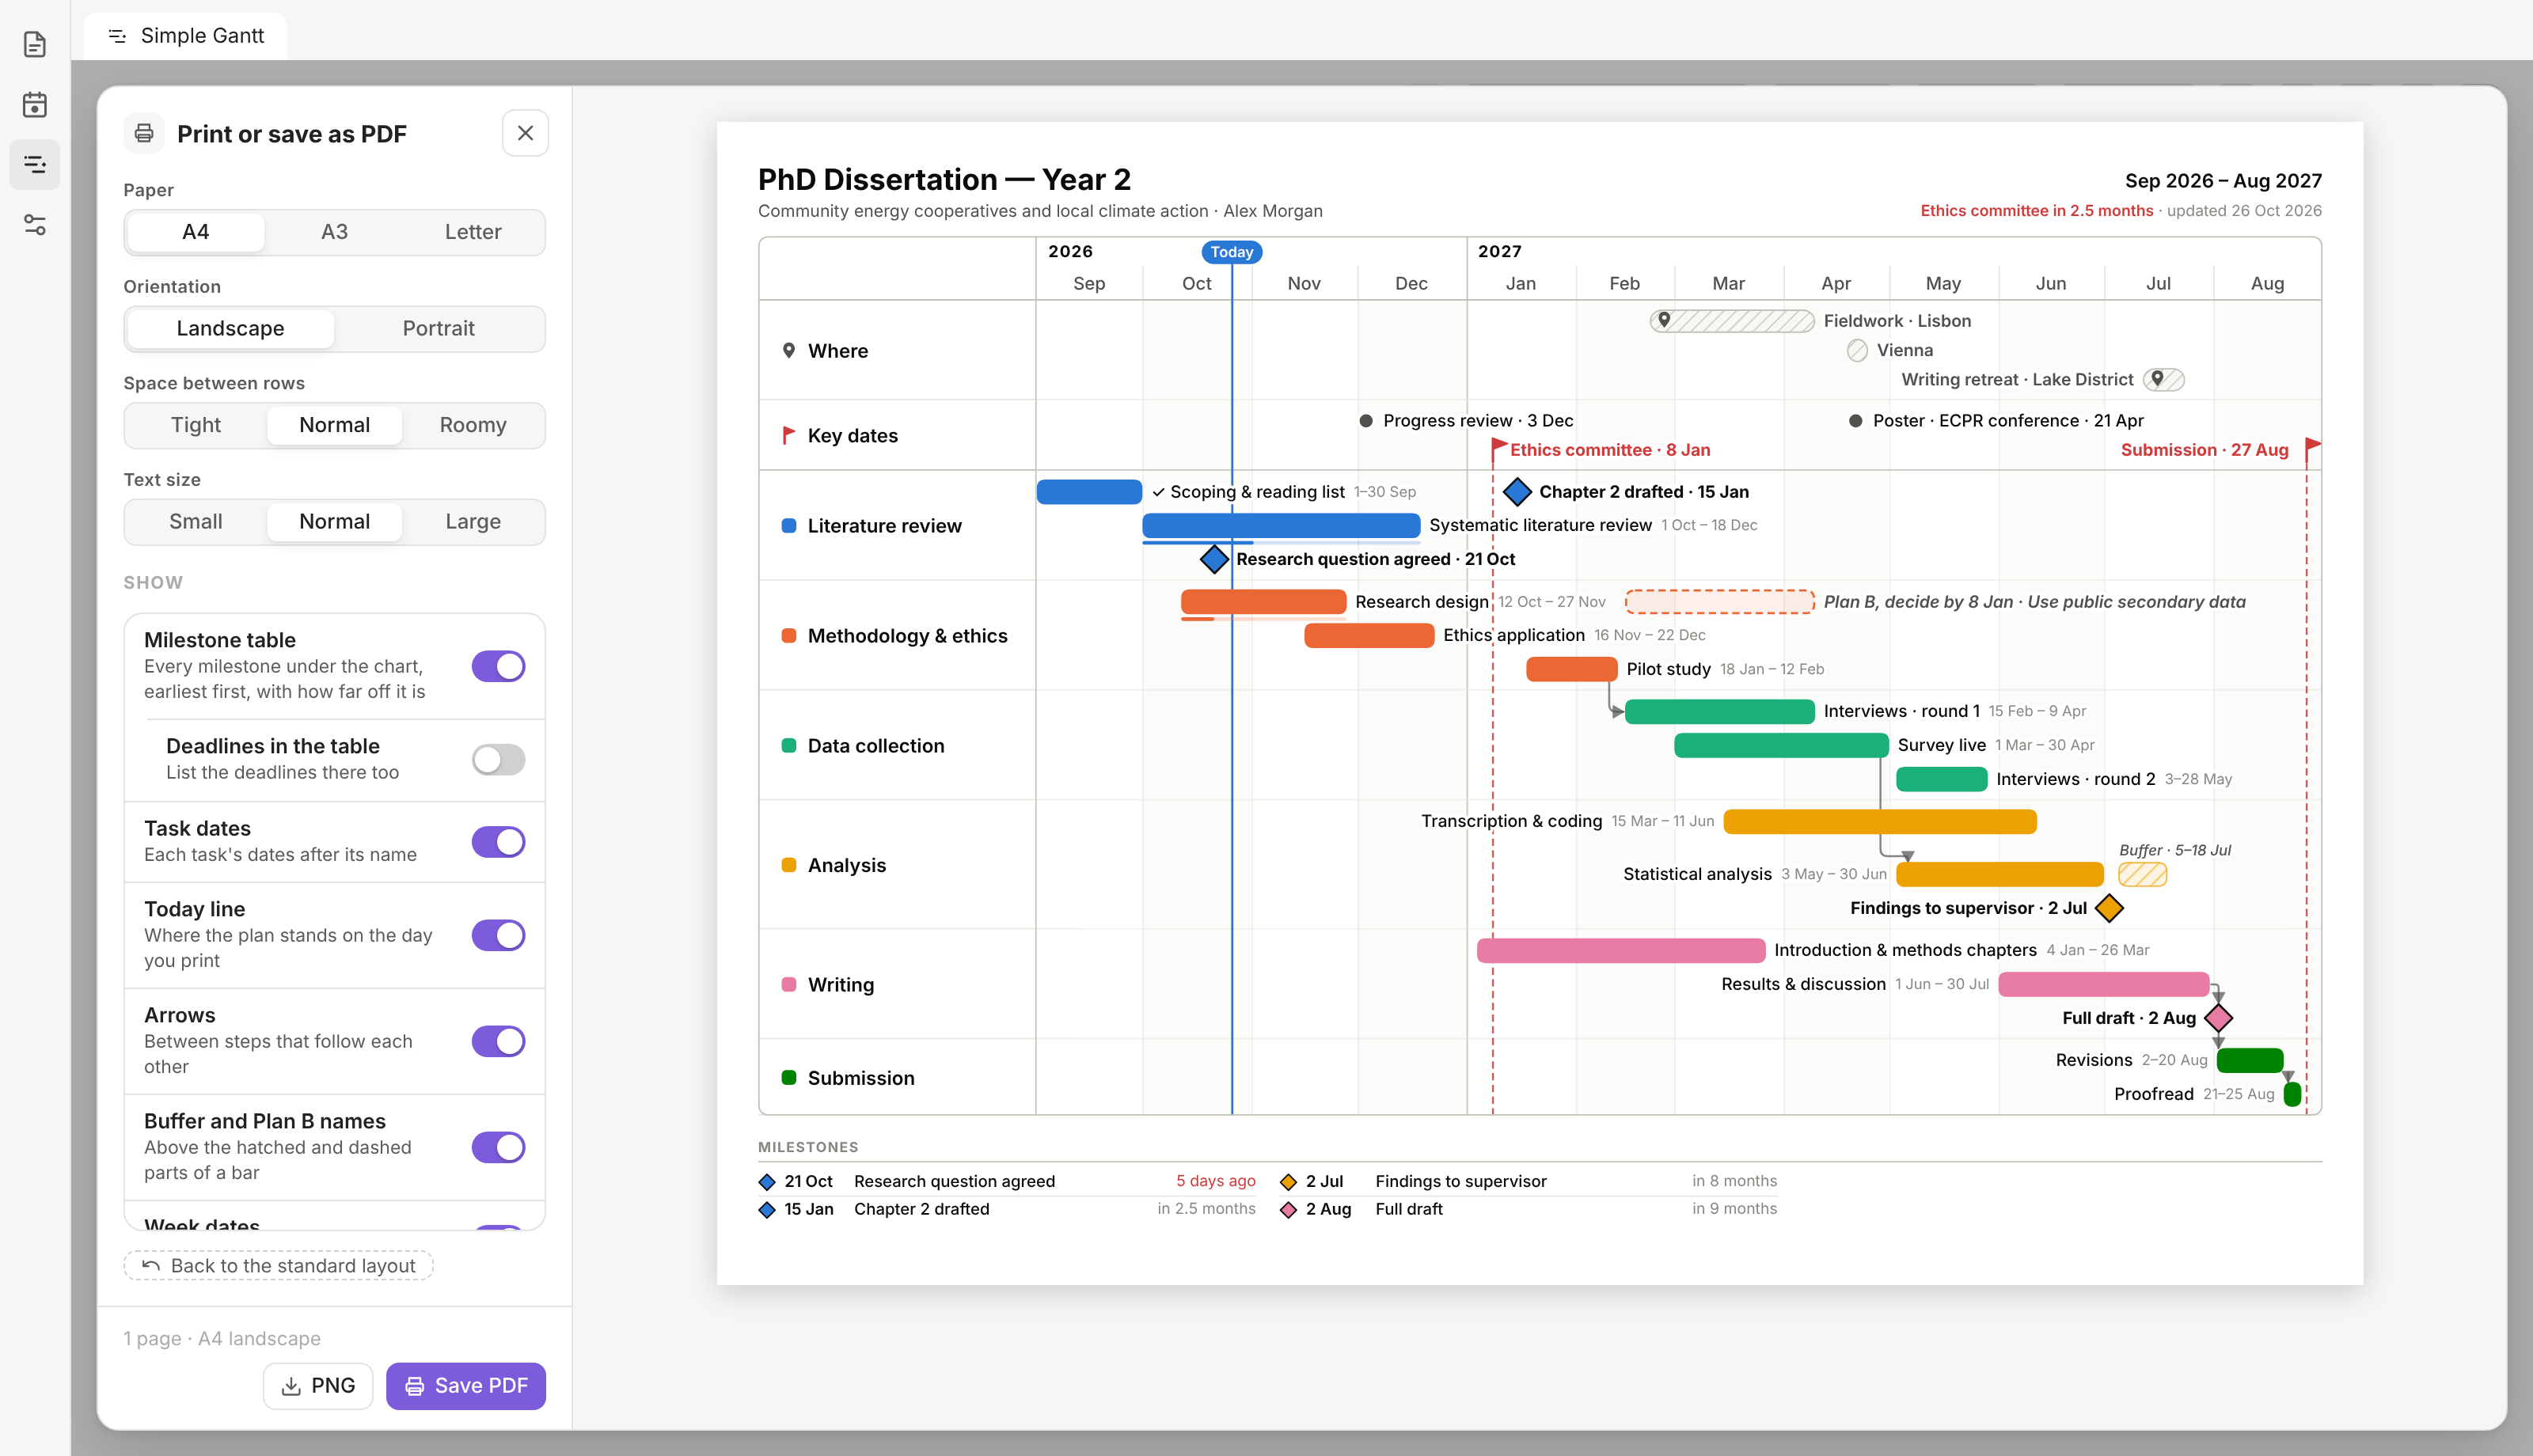
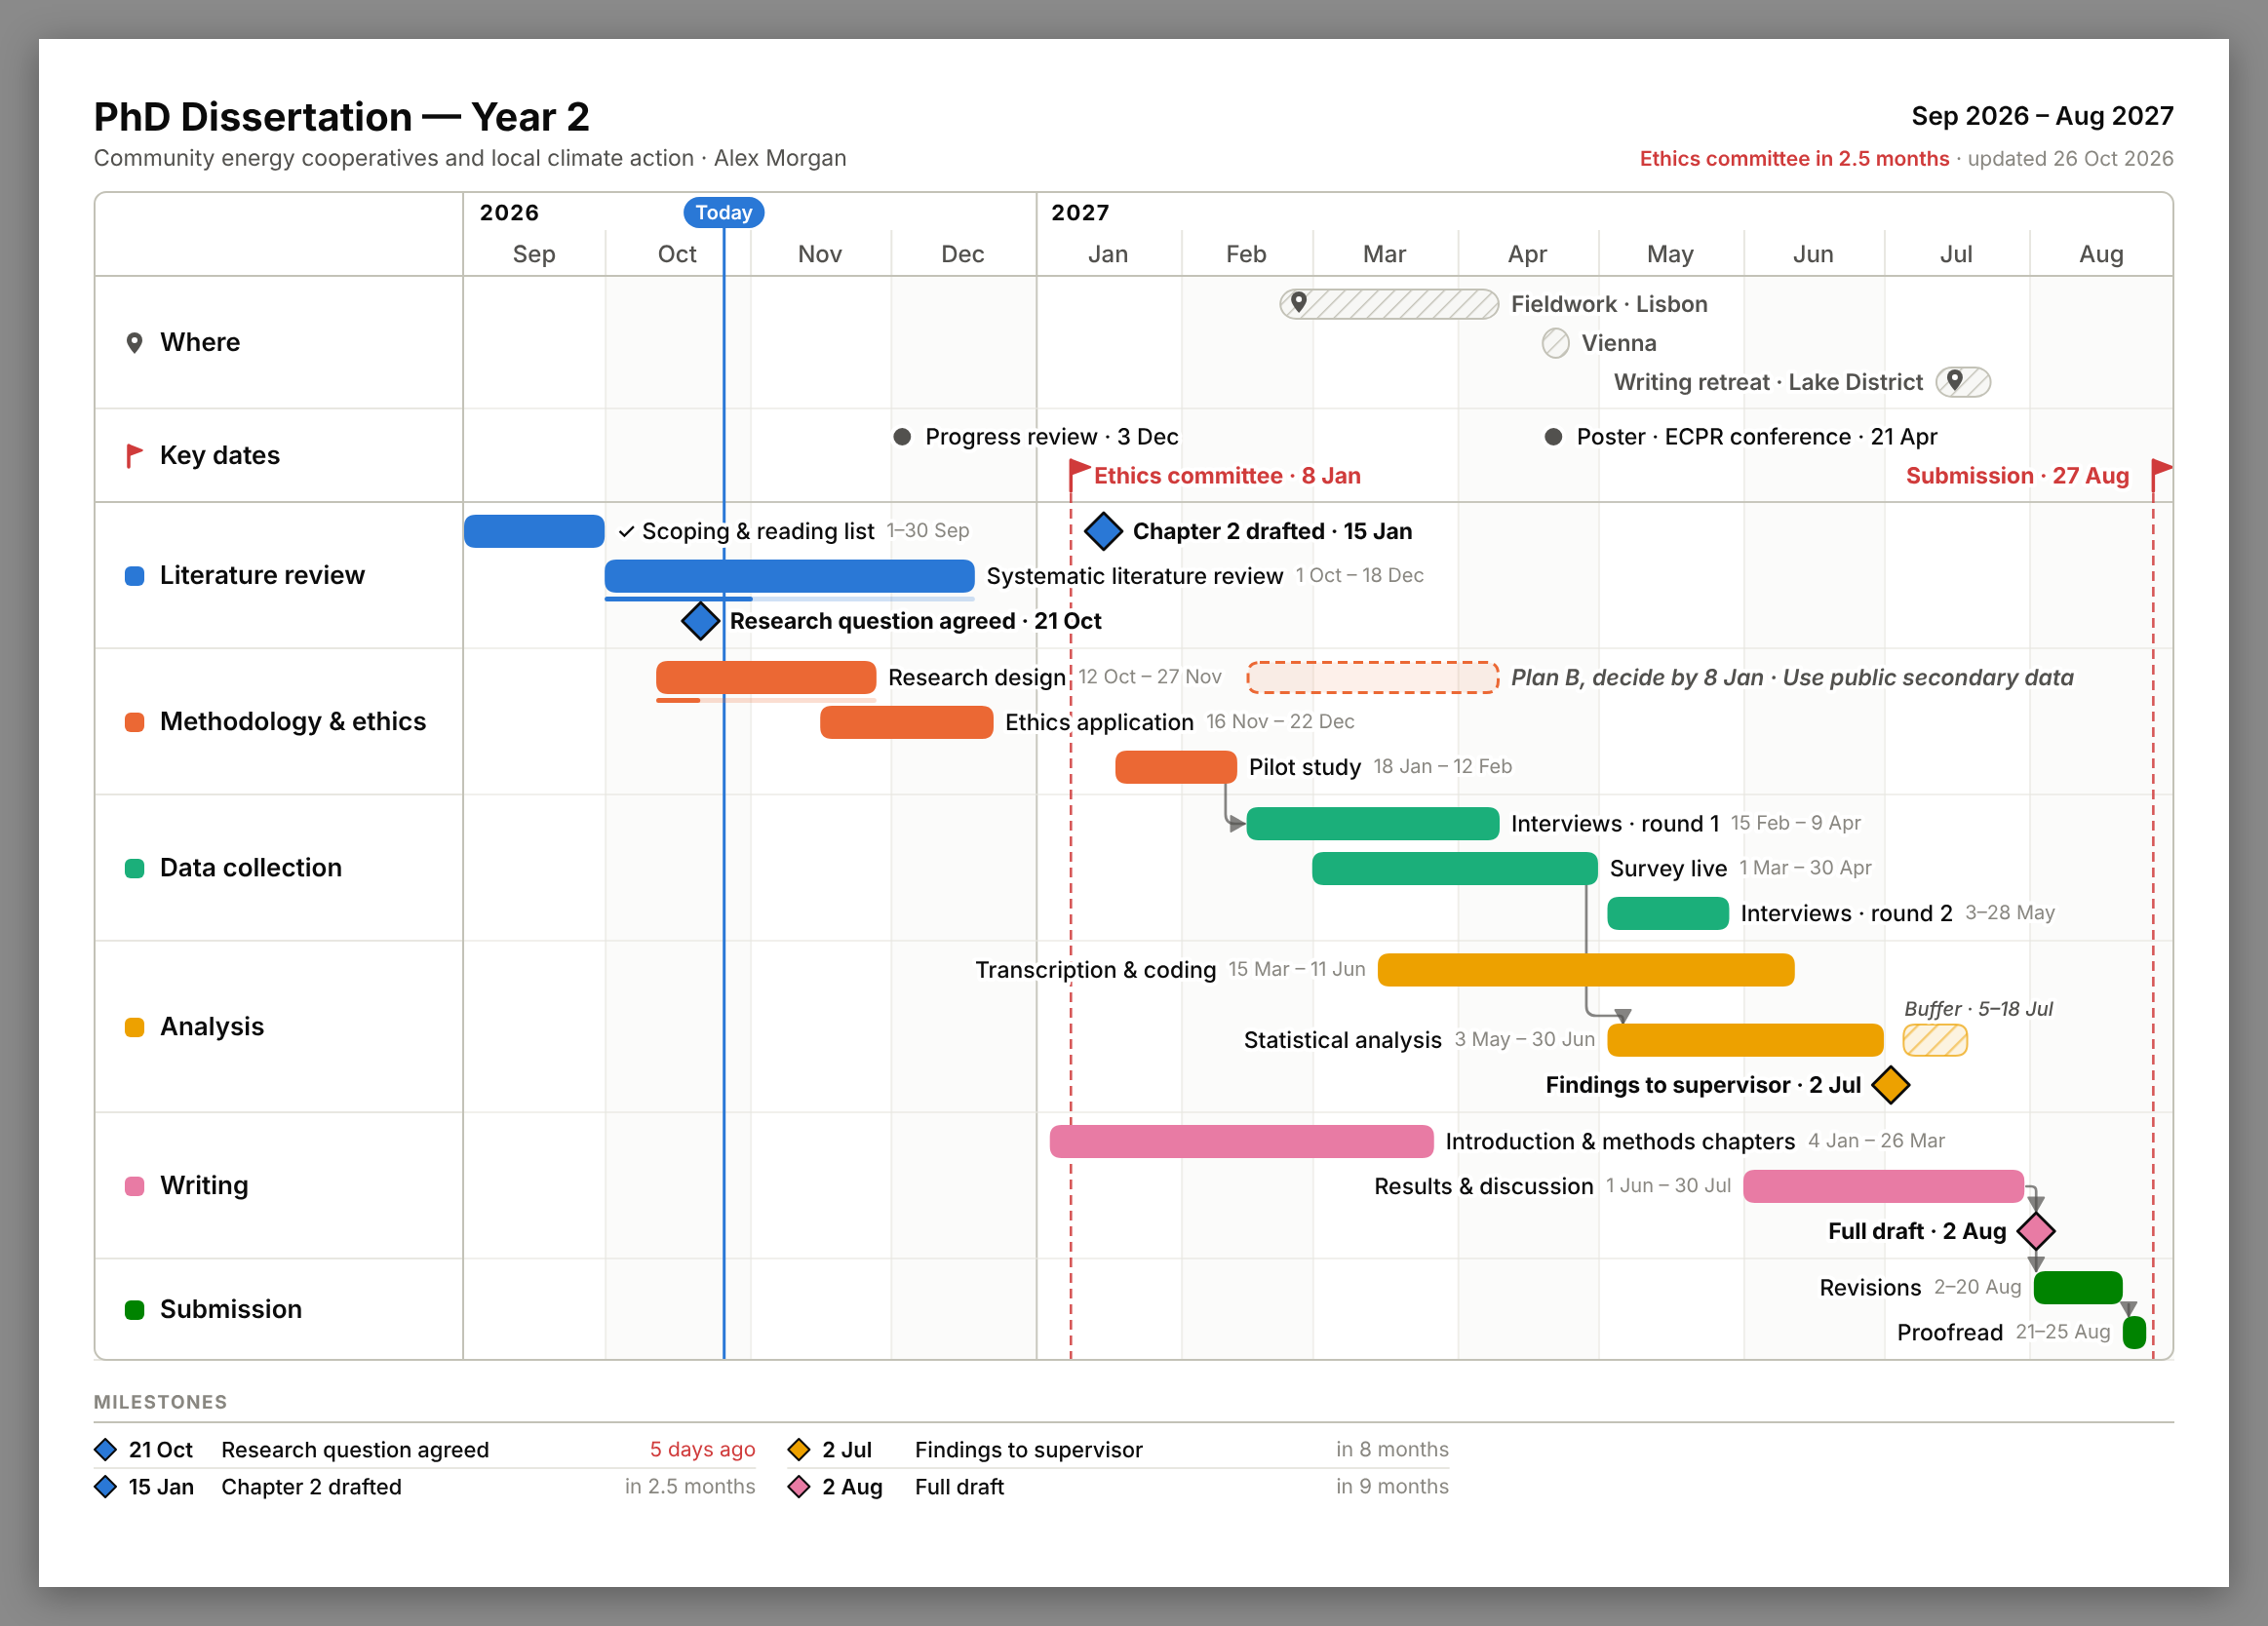
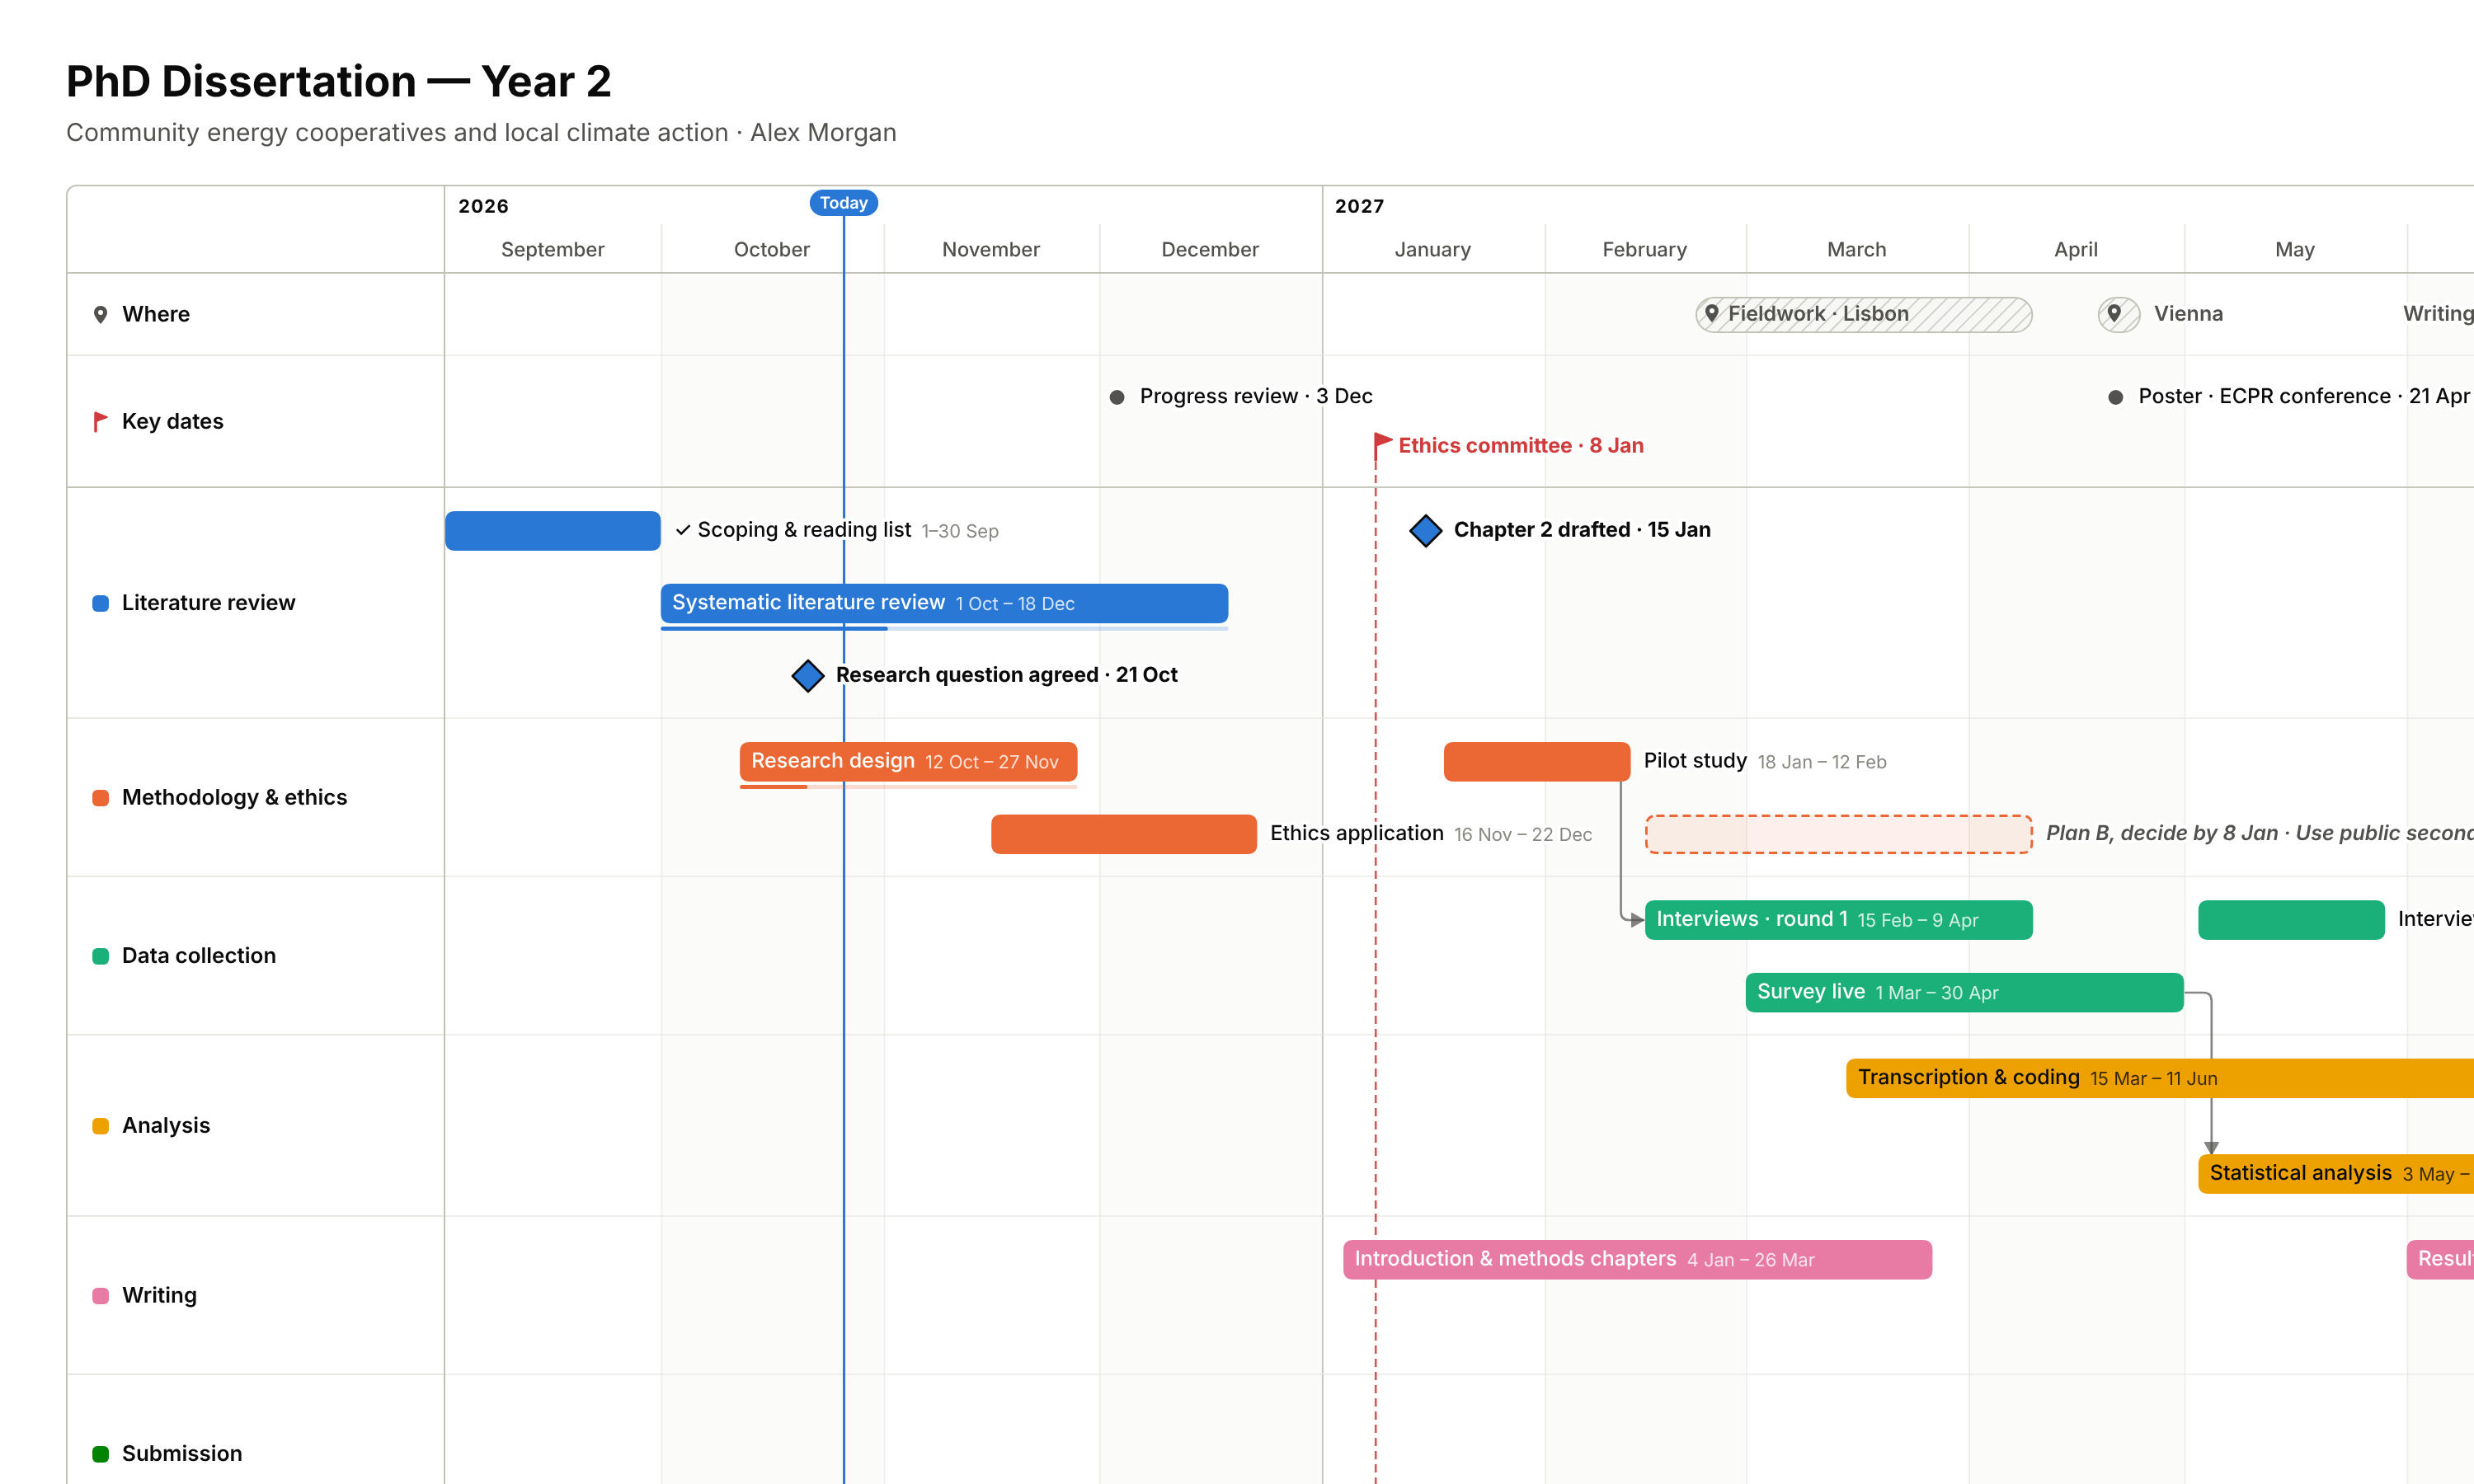
Export → Print / PDF… opens a print window with a live preview. Pick A4, A3 or Letter, landscape or portrait, how much room there is between the rows and how big the text is, and what to show: phase lengths under each phase's name (its working time, without vacations and buffers), a milestone table (every milestone with its date, earliest first), a vacations and buffers table (each one with its pattern, dates and length), task dates, a Today line, arrows (also the long ones across phases, as on the board), buffer and vacation names with their dates (above the bar, below it, or wherever there's room), Plan B names, week dates, the subtitle, and a countdown to the next deadline. By default the page only says things that stay true, so it still reads right weeks later: lengths and dates, not "in 4 weeks" (a countdown can be switched on). Names never lose their dates to make room: when two would collide, one moves under the bar. Time is counted one way throughout the page: in weeks ("in 20 weeks", "2 weeks 3 days"), in days, or mixed (weeks, then months). Your choices are saved with the timeline. Save PDF writes a print-ready PDF and opens it; print it at 100%.
The page itself is kept clean: deadlines in red in one row at the top, each with a line through the whole chart; milestones as bold diamonds with their dates; no legend, because the picture explains itself. No label ever runs off the page.
Import a plan
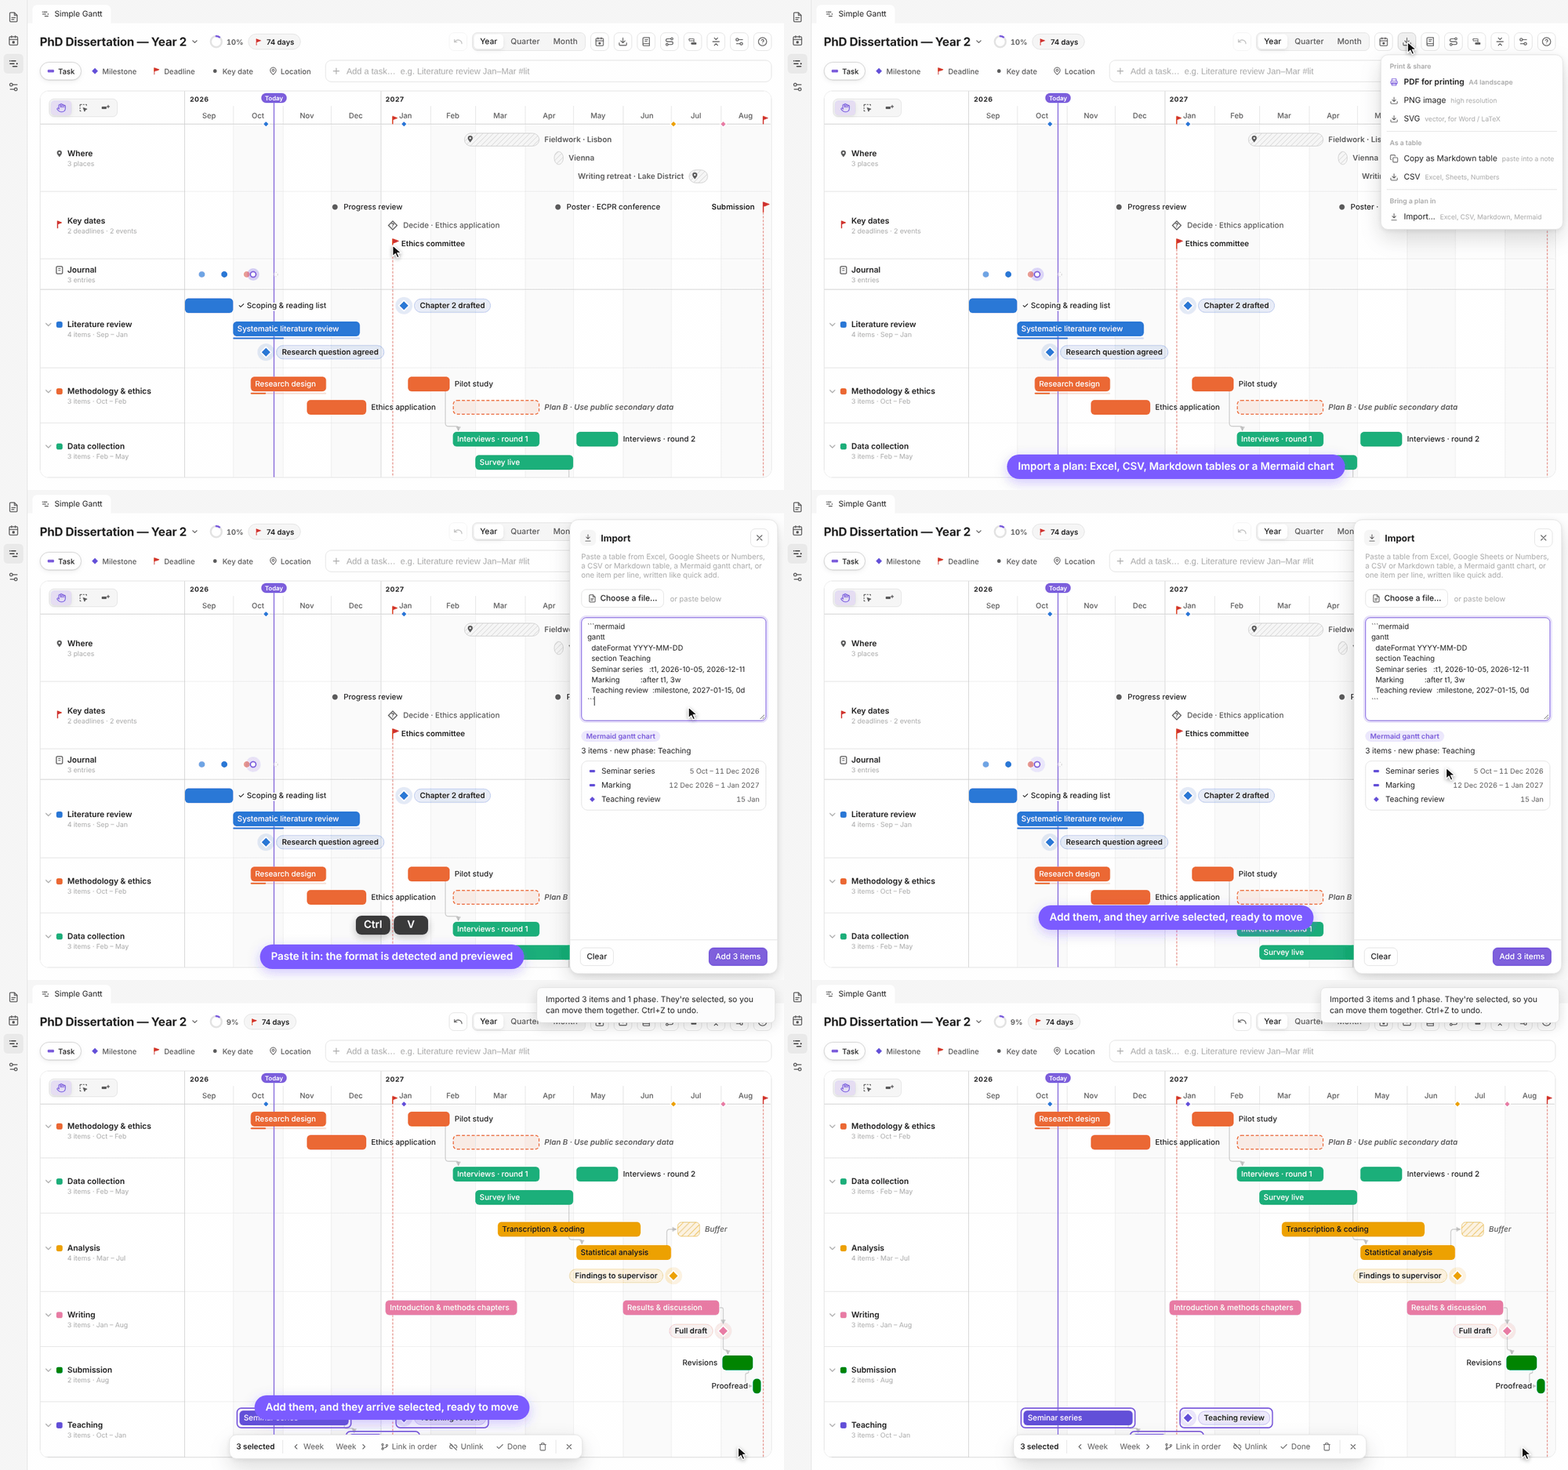
Export → Import… (or just paste several lines into the quick-add bar) brings in a table from Excel, Google Sheets or Numbers, a CSV or Markdown table, a Mermaid gantt chart from a note, or a plain list. You see a preview first, and the imported items arrive selected.
Critical path and plan vs. reality
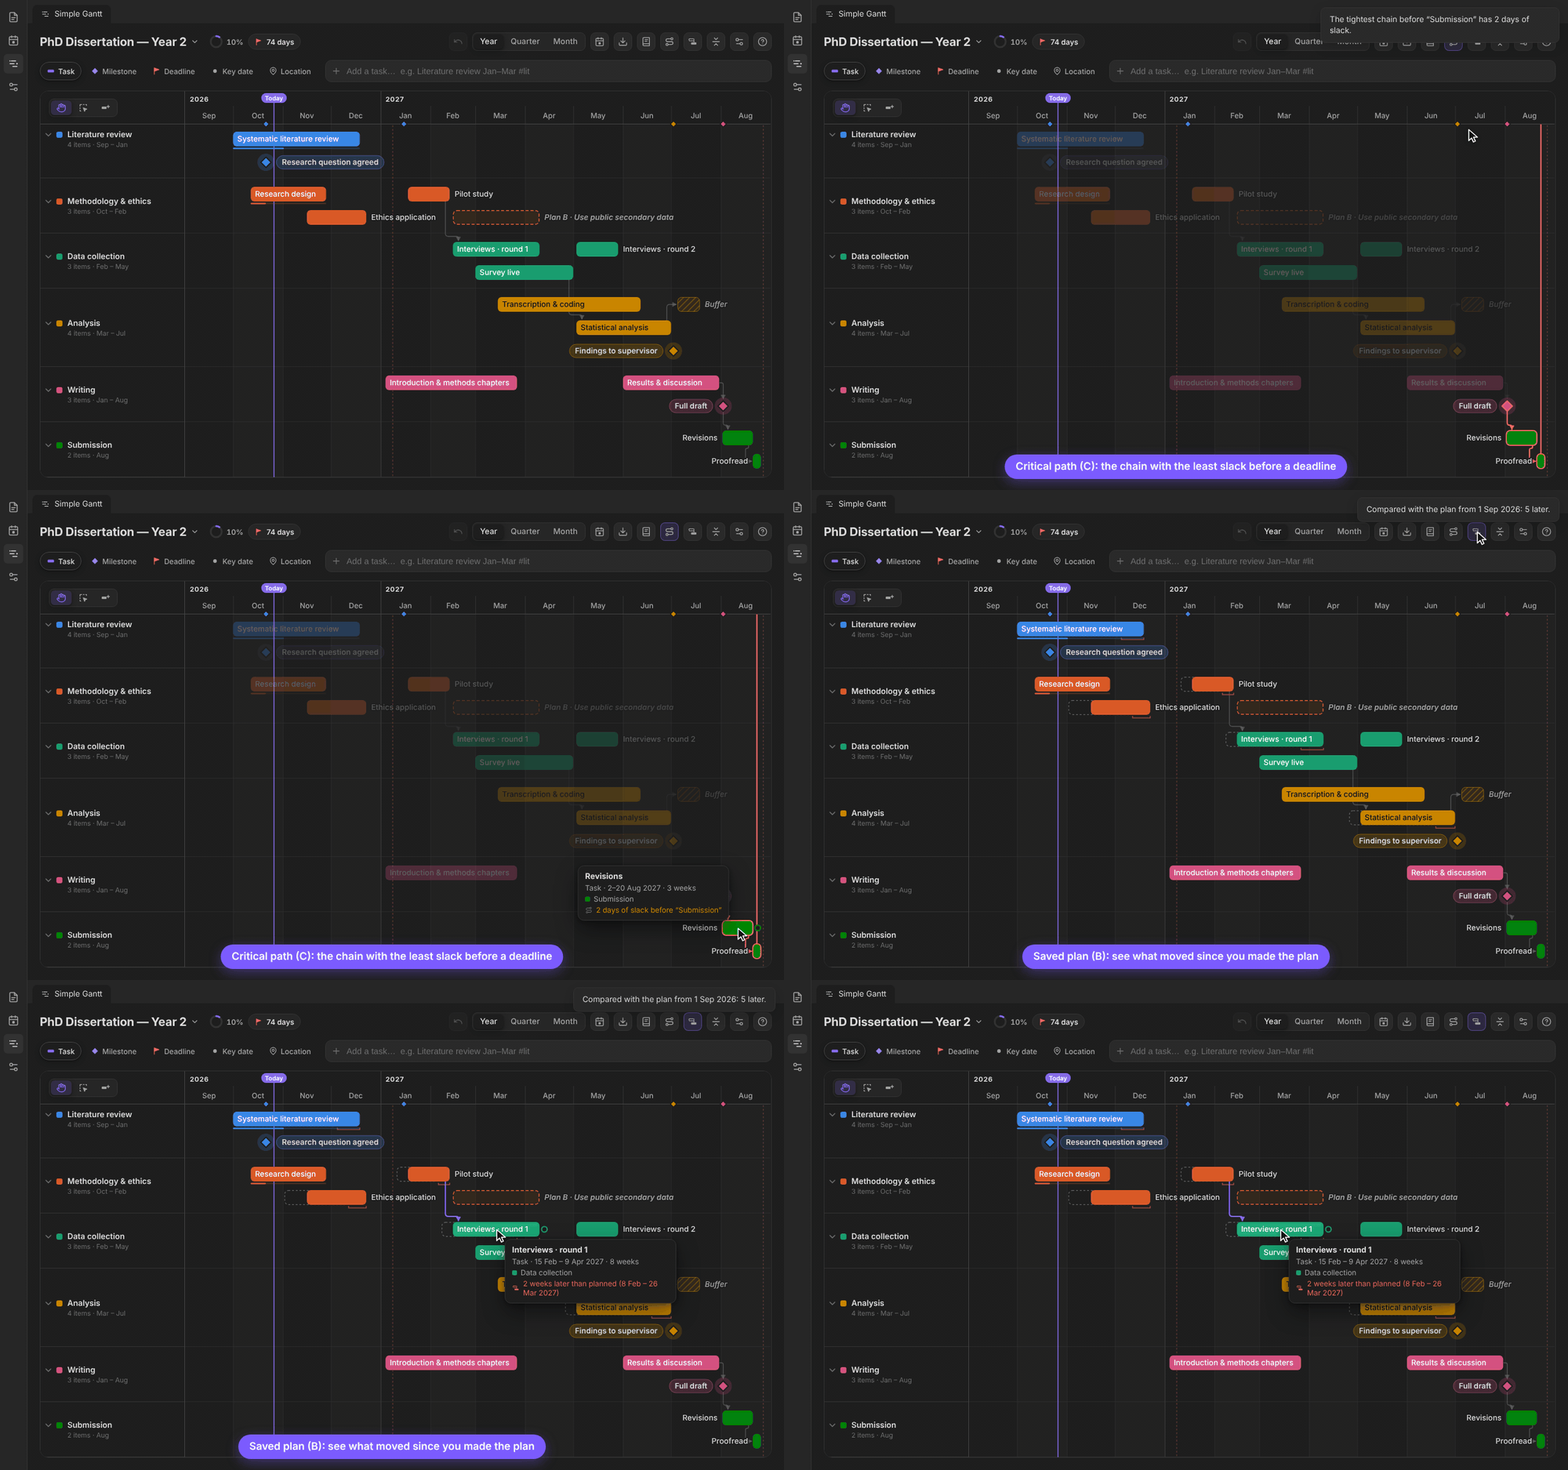
C highlights the chain with the least slack before a deadline. B compares today's chart with the plan you saved, showing where everything was planned and how far it moved.
Features
Plan
| Item | Used for |
|---|---|
| ▬ Task | Work over a period, grouped into colour-coded phases. Optional progress. |
| ◆ Milestone | A moment you reach, e.g. "Chapter 2 drafted". |
| ⚑ Deadline | A hard date: a red flag with a dashed rule through the whole chart. |
| ● Key date | Meetings, reviews, conferences. |
| ⌖ Location | Where you'll be: fieldwork, trips, retreats. |
- Year overview first. The board opens on the whole project with a today line. Zoom to Quarter or Month, or use Ctrl/Cmd + scroll.
- Quick add understands dates, durations, phases, types and progress (see Quick add).
- Right-click an empty row to add a task, milestone, deadline or place exactly there, with its name ready to type.
- Buffer time: plan slack for holidays and the delays that always come (
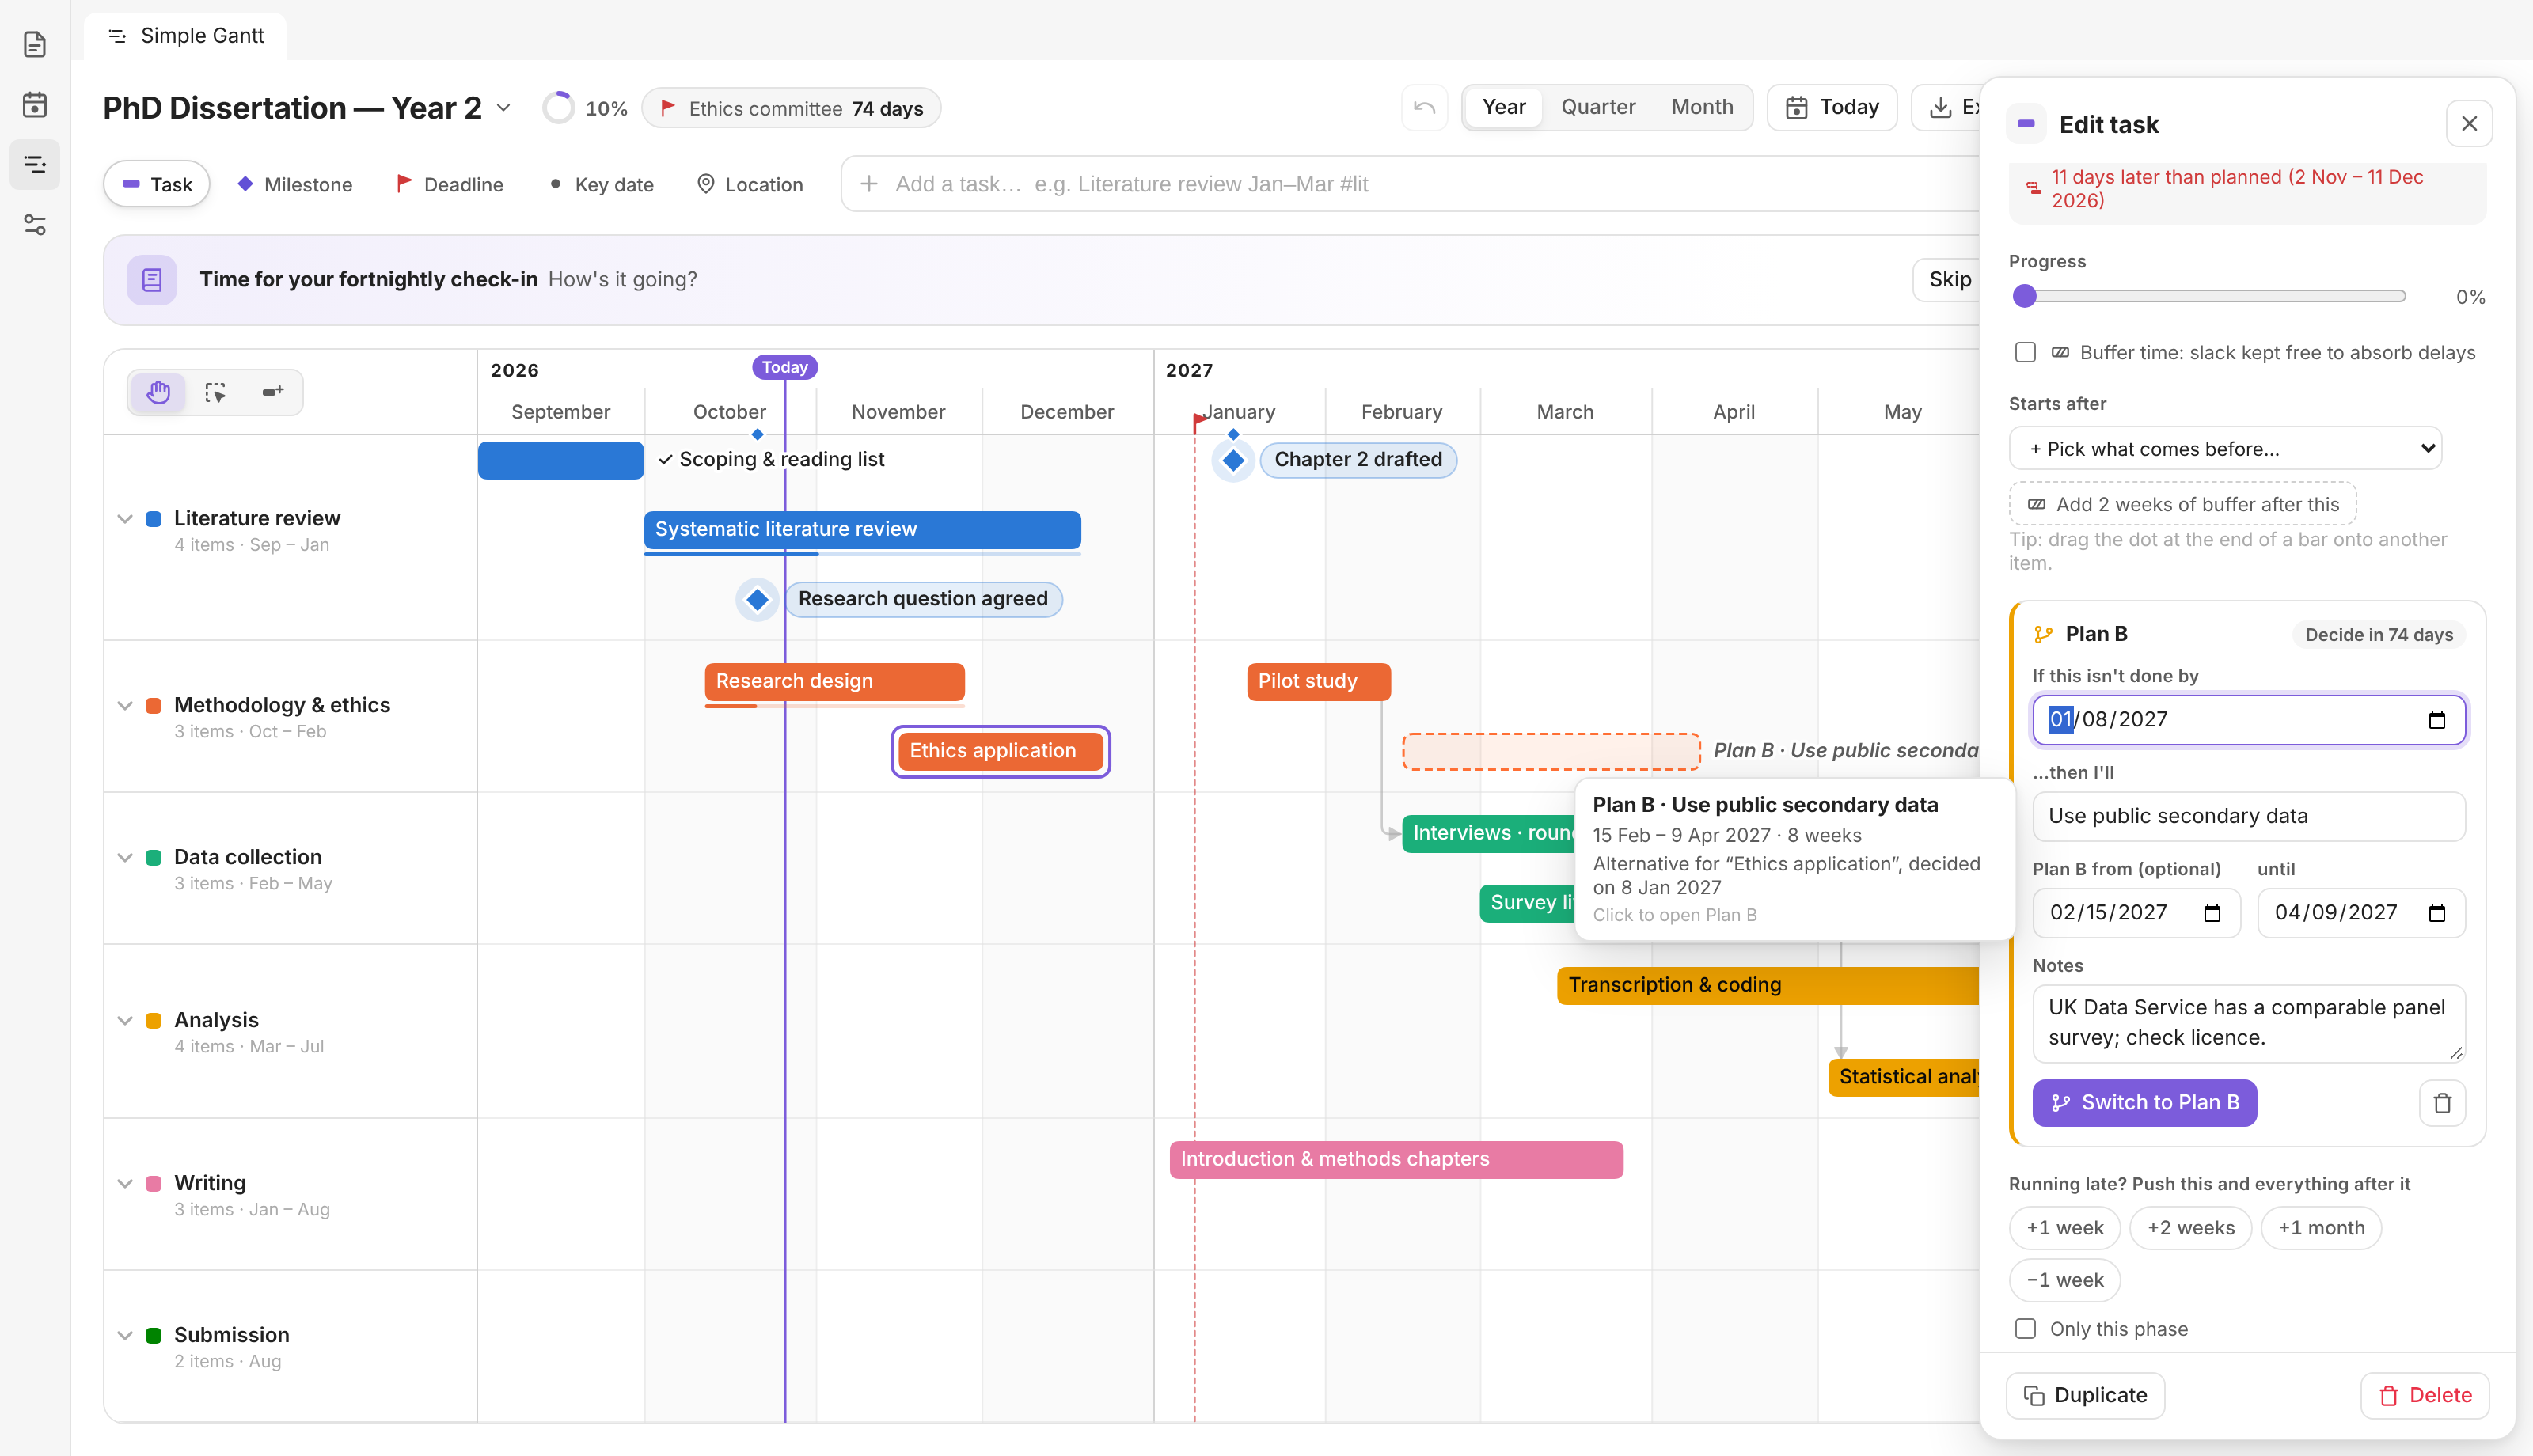
~in quick add). A buffer that falls inside a task, or right after it, is drawn as a patterned stretch of that task's bar with its name above. Buffers chain: a buffer right after a vacation joins the same bar, so task → vacation → buffer reads as one line. Give each buffer its own pattern (stripes, reverse stripes, cross-hatch, dots, lines or grid) in its panel or right-click menu, so a vacation and a buffer are easy to tell apart on screen and on paper. - Plan B / decision points: "If this isn't done by 8 Jan, I'll use public data instead." A Plan B that carries on from its task shows as a dashed extension of the bar. When the date comes, you decide: switch to Plan B (the original stays, faded, as a record) or carry on.
- Templates: Dissertation (twelve months of research phases) or Blank.
- Import from Excel, Google Sheets, Numbers, CSV/TSV, Markdown tables, Mermaid
ganttcharts or a plain list (one item per line, written like quick add; Markdown headings become phases,- [x]means done). Columns are recognised by name (Task, Phase, Start, End, Duration, % Complete, Status, Predecessors…), day-first and month-first dates are told apart, and links come along.
Move & connect
- Move around like on a Canvas: drag empty space (or use the middle mouse button) to scroll the chart, and Ctrl/Cmd + scroll to zoom. The tools in the chart's corner switch what a drag on empty space does: move around (H, the default), select (V) or draw tasks (D).
- Drag bars anywhere: another row, another phase, on top of other items; they stay where you drop them. Drag their edges to resize. This works with every tool. Hold Shift to stay in the same phase, Alt to move everything after it too.
- Select several: use the select tool (V), Shift-drag a box on empty space, Shift/Ctrl-click, or press Ctrl+A. A small bar moves the selection by a week, links it in date order, ticks it off, duplicates or deletes it.
- Links keep the order: when something slips, everything linked after it moves too. Each arrow takes the simplest clear path: straight down when the next step starts under the previous one, otherwise out of the side and down onto it, avoiding other bars and labels where it can. If a deadline would be missed, the arrow turns red and you get a warning.
- Detach a link by clicking its line, then × or Delete.
- Deadlines are easy to follow: each one has a red flag on the date ruler and a dashed red line through the chart. Hover the line for its name and date, or click it to open the deadline.
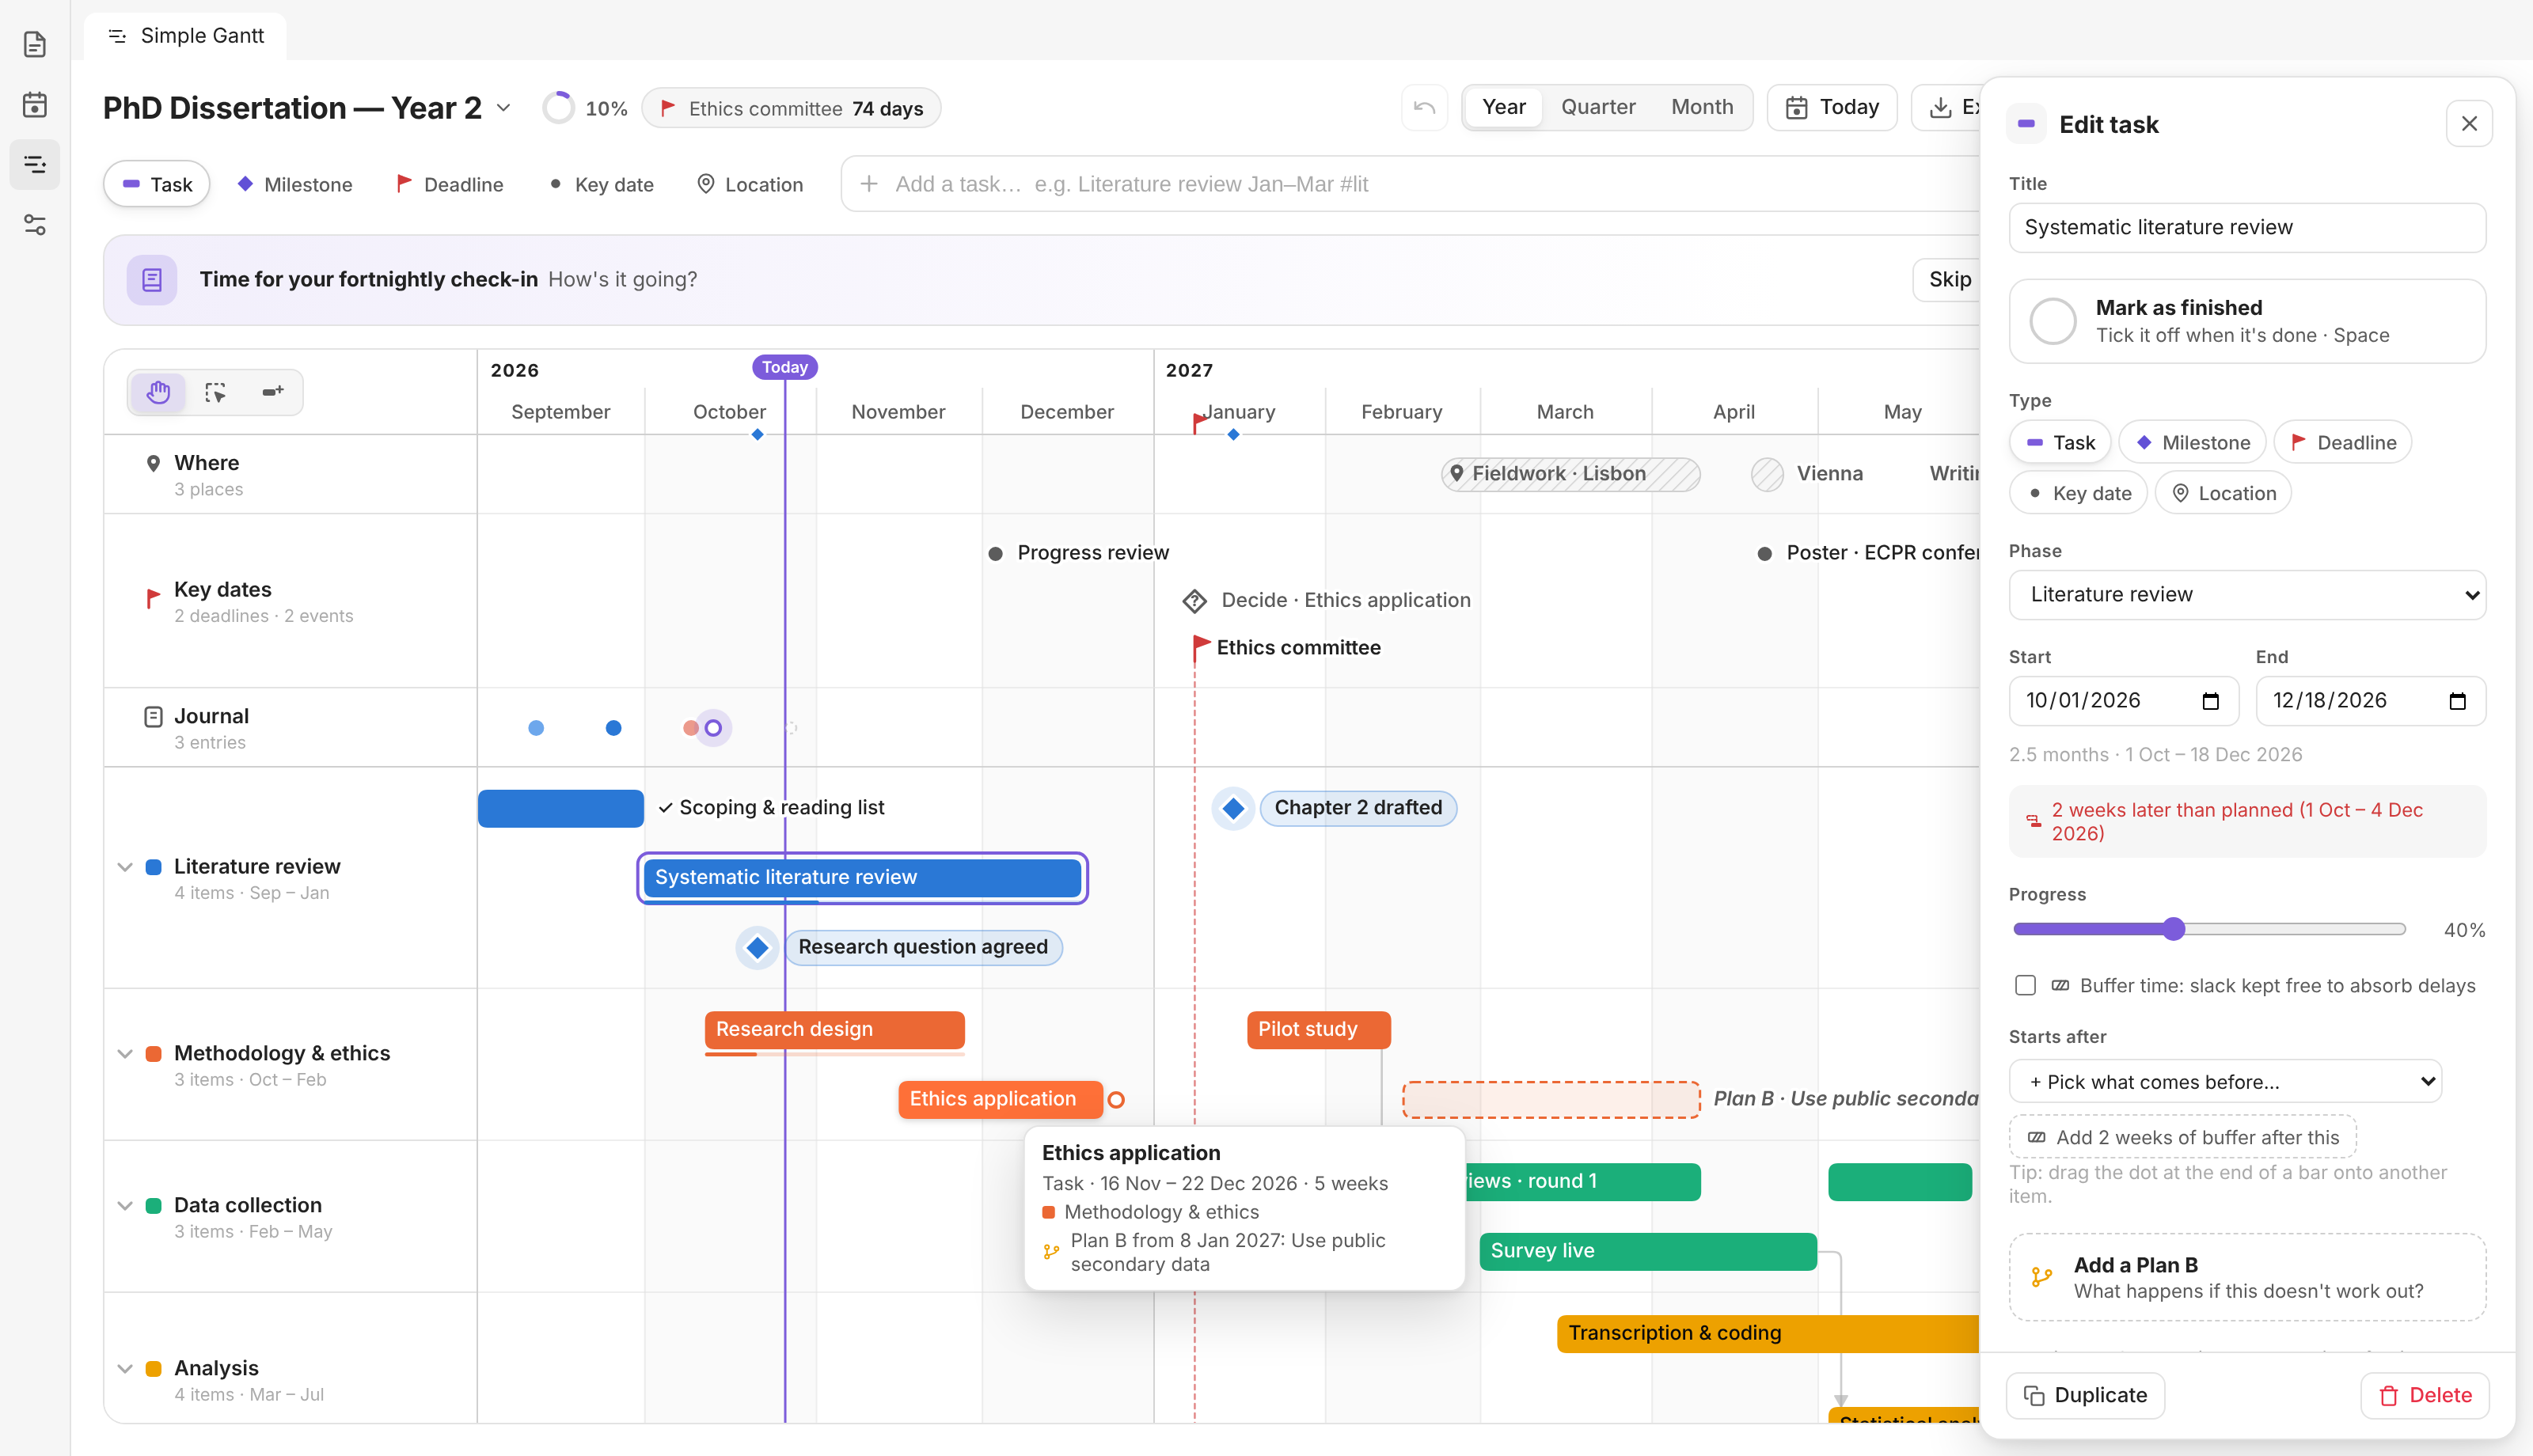
- Rename in place by double-clicking or pressing F2. Duplicate with Ctrl+D. Undo anything with Ctrl+Z.
- Fold phases into summary bars that show their overall progress.
Stay on track
- Slack: hover any linked item to see how long it can slip before it hits a deadline, e.g. "2 weeks of slack before Submission".
- Critical path (C) highlights the chain with the least slack and fades the rest.
- Saved plan (B): save your plan once, and later see where each item was planned (dashed outlines), how far it moved, and a summary of what's late, early or new. This is useful for the "plan vs. reality" part of a dissertation.
- Nudges above the chart: Did you reach "Chapter 2 drafted"?, Decision time, Ethics committee is in 5 days.
- At a glance: a progress ring and a countdown to the next deadline in the toolbar.
Reflect
- Tick things off with the checkbox or Space, then answer "How did it go?" with a mood and a few words.
- Journal with check-ins (weekly, every two weeks or monthly) with mood faces and rotating prompts. Your entries appear on the chart.
- Save the journal as a note: the whole journal becomes Markdown, ready for your reflective chapter.
Share & export
- Print / PDF with a live preview: A4, A3 or Letter, landscape or portrait, tight to roomy row spacing, three text sizes, where buffer names go, time in weeks, days or mixed, and switches for phase lengths, the milestone table, the vacations and buffers table, task dates, Today line, arrows (and the long ones across phases), buffer names and their dates, week dates, subtitle and countdown. Saved per timeline. Long plans continue on more pages, each repeating the dates and deadlines.
- PNG or SVG in the same clean, white style. You can include the saved plan for a "planned vs. actual" figure.
- Markdown table or CSV of the whole plan, for an appendix or a spreadsheet.
- Reading view: the note's block renders as a chart preview, and you can copy it into any other note.
Make it yours
- Put Simple Gantt where you like: open the overview panel from Settings → Simple Gantt (left or right sidebar) or with the command Show overview in the sidebar, then drag its icon onto any tab group. You can hide the ribbon button there too.
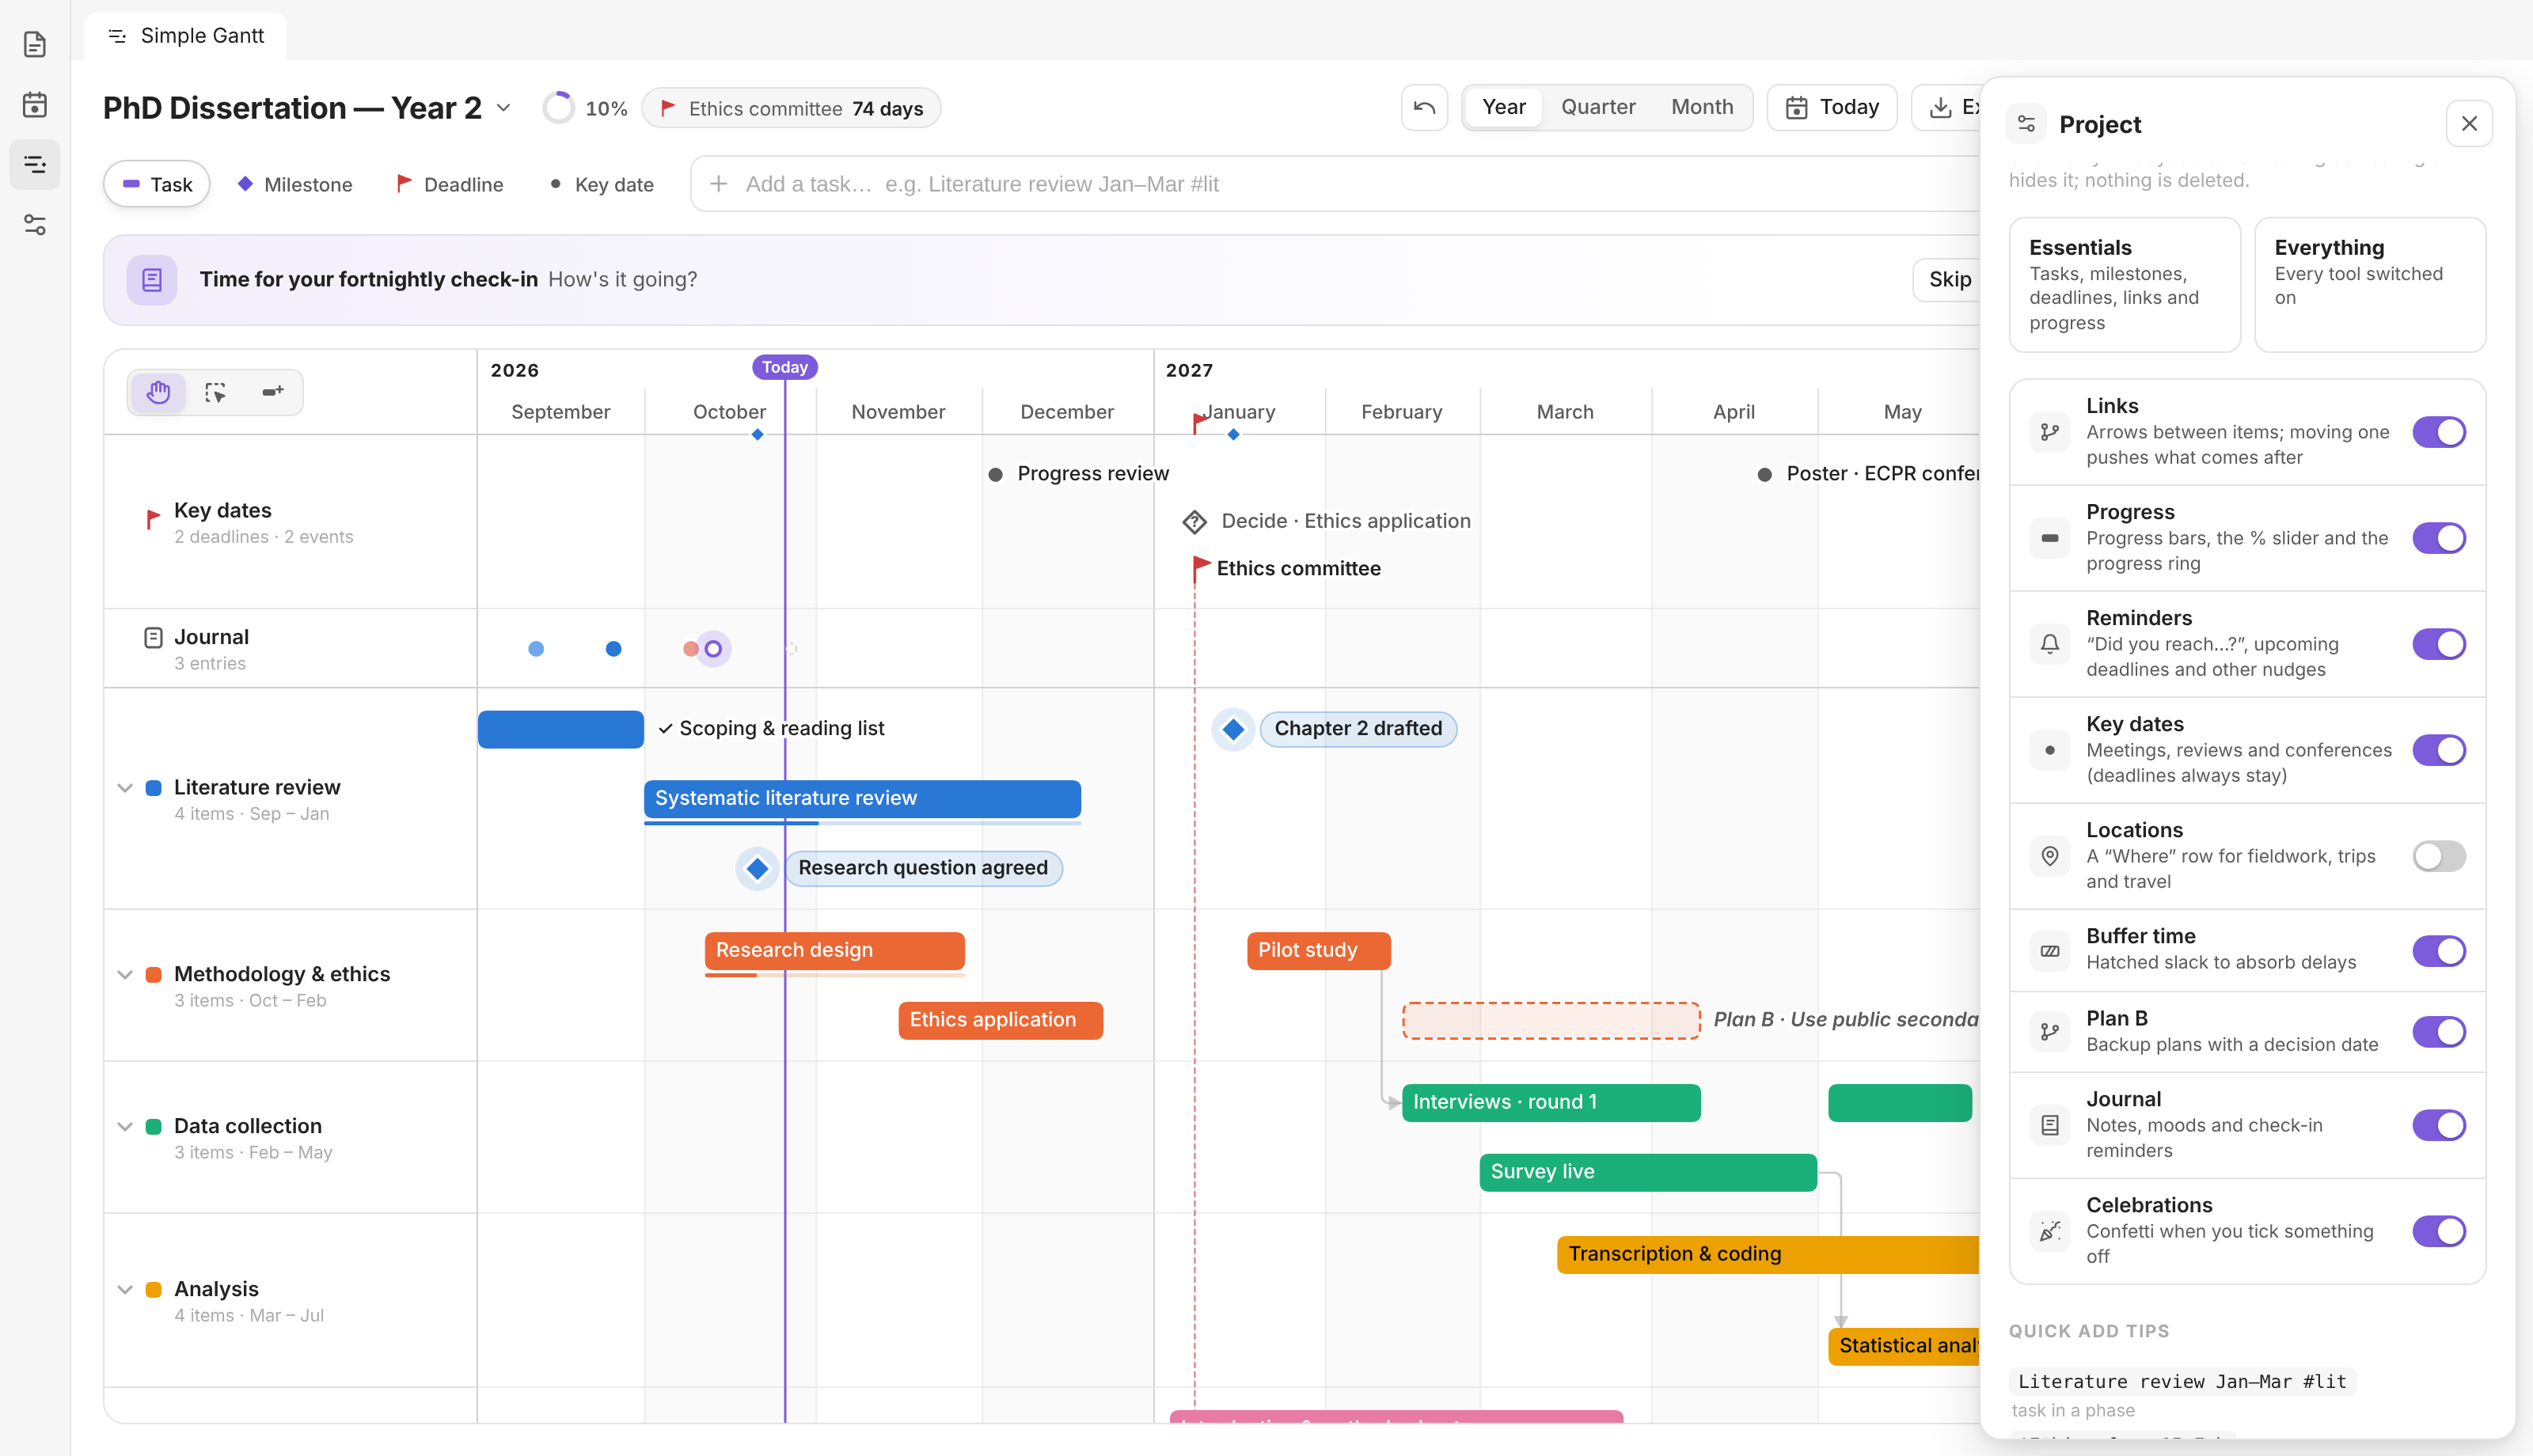
- Use only what you need: under project settings → Features, switch Links, Progress, Reminders, Key dates, Locations, Buffer time, Plan B, Journal and Celebrations on or off, or pick Essentials or Everything. Switching something off only hides it; your data stays.
- Comfortable or Compact spacing.
- Follows your Obsidian theme (light and dark), and works on mobile.
| Print export | Dark, quarter zoom |
|---|---|
 |
 |
| Journal | Plan B |
 |
 |
| Editing | Features on/off |
 |
 |
Quick add
Type a title and a date; everything else is optional.
| You type | You get |
|---|---|
Literature review Jan–Mar #lit |
Task from 1 Jan to 31 Mar in the phase starting with "lit" |
Pilot study 18 Jan for 4 weeks 30% |
Task with a duration and 30% progress |
Interviews 15–20 May |
Task over those days |
!Ethics submission 15 Feb |
Deadline (!) |
*Chapter 2 drafted 20 Jan |
Milestone (*) |
+Supervisor meeting 3 Dec |
Key date (+) |
@Fieldwork Lisbon 22 Feb – 9 Apr |
Location (@) |
Teaching Sep–Dec #teaching |
Creates the phase "Teaching" if it doesn't exist yet |
> Great supervisor meeting today |
A journal entry for today (>) |
~ 1–14 Jul #analysis |
Two weeks of buffer time (~) |
- Dates:
15 Feb,Feb 15,February,Jan–Mar 2027,2027-02-15,15/2/2027(day first),today,tomorrow. - Years: if you leave the year out, it's picked so the date falls inside the project.
- Types from words: "deadline" or "due" makes a deadline; "meeting", "conference" or "viva" makes a key date.
- Enter adds the item, Shift+Enter adds it and opens it, and / jumps to the input.
Keyboard and mouse
| Gesture or key | What it does |
|---|---|
| Drag empty space | Move around (with the draw tool: draw a task) |
| Middle mouse drag · Ctrl/Cmd + scroll | Move around · zoom |
| H · V · D | Tools: move around · select · draw tasks |
| Double-click an empty row | Add a milestone or key date |
| Double-click an item · F2 | Rename it in place |
| Right-click | The menu for an item, a link or a row |
| Drag a bar · Shift + drag · Alt + drag | Put it anywhere · keep it in its phase · move everything after it too |
| Shift + drag empty space | Draw a selection box (with any tool) |
| Shift/Ctrl + click · Ctrl+A | Add to the selection · select everything |
| ← → | Move by a day (Shift: a week; Alt: resize) |
| ↑ ↓ | Move to the phase above or below |
| Space | Tick off |
| Ctrl+D · Delete | Duplicate · delete (the selected link: unlink) |
| C · B | Critical path · compare with the saved plan |
| F · J | Fold all phases · journal |
| Ctrl+Z · Ctrl+Shift+Z | Undo · redo |
| ? | A card with every gesture |
Where your data lives
New timelines are created in the Gantt/ folder (you can change this in settings). A timeline note looks like this:
---
simple-gantt: true
---

```simple-gantt
title: PhD Dissertation — Year 2
start: '2026-09-01'
end: '2027-08-31'
phases:
  - id: literature
    name: Literature review
    color: blue
items:
  - title: Systematic literature review
    type: task
    phase: literature
    start: '2026-10-01'
    end: '2026-12-18'
    progress: 40
    planB:
      by: '2026-12-01'
      title: Narrow the review to 2015 onwards
    id: lit-review
  - title: Research question agreed
    type: milestone
    phase: literature
    start: '2026-10-21'
    done: true
    doneOn: '2026-10-26'
    review:
      mood: 4
      text: Took two extra meetings, but it's much sharper now.
    id: question
  - title: Christmas vacation
    type: task
    phase: literature
    start: '2026-12-21'
    end: '2027-01-06'
    buffer: true
    pattern: dots
    id: xmas
checkin: fortnightly
baseline:
  saved: '2026-09-01'
  items:
    lit-review: 2026-10-01/2026-12-04
    question: 2026-10-21
```
- Hand edits: you can edit the YAML yourself; the board reloads.
- Embedding: copy the block into any other note to show the chart there.
- Privacy: everything stays in your vault. The plugin makes no network requests.
Install
- From Obsidian: Settings → Community plugins → Browse, search for Simple Gantt, then Install and Enable.
- With BRAT (to try new versions first): add the beta plugin
Nexziz/simple-gantt. - By hand: download
main.js,manifest.jsonandstyles.cssfrom the latest release, put them in<your vault>/.obsidian/plugins/simple-gantt/, and enable Simple Gantt under Settings → Community plugins.
Then click the timeline button in the left ribbon, or run Simple Gantt: New dissertation timeline from the command palette.
Commands: Open timeline · Show overview in the sidebar · Import into the open timeline · Print or save as PDF · New dissertation timeline · New blank timeline · Open this note as a timeline
Development
npm install
npm run dev          # rebuilds main.js on change; symlink this folder into a test vault's plugins dir
npm run build        # type-check + production build
npm test             # unit tests + an end-to-end run in Chromium against an in-memory Obsidian mock
npm run screenshots  # regenerates the screenshots in docs/images
npm run gifs         # records the GIFs in docs/gifs and the hero images (needs ffmpeg)
dev/preview.html (after npm run preview) runs the board in a plain browser with sample data.
src/core/holds the logic: dates, the quick-add parser, layout, links and slack, the saved plan, SVG rendering, and YAML (de)serialisation.src/ui/board.tsis the interactive board.src/view.tsandsrc/main.tsconnect it all to Obsidian.
Support
Simple Gantt is free and open source. If it helps you plan your dissertation or your project, you can say thanks with a coffee. It keeps the updates coming ☕
Bug reports and ideas are welcome too, in Issues.