Maps Timeline
 Arseniy Seroka245 downloads
View your Google Maps Timeline location history on an interactive map — visits, routes and exact GPS tracks, with day and date-range pickers.
- Overview
- Scorecard
- Updates2
View your Google Maps Timeline (location history) on an interactive map inside Obsidian — visits, movement routes, and your exact GPS tracks — with day, month and custom date‑range pickers. Your data never leaves your machine; map tiles come from OpenStreetMap or Esri (no key) or Google (your own key).
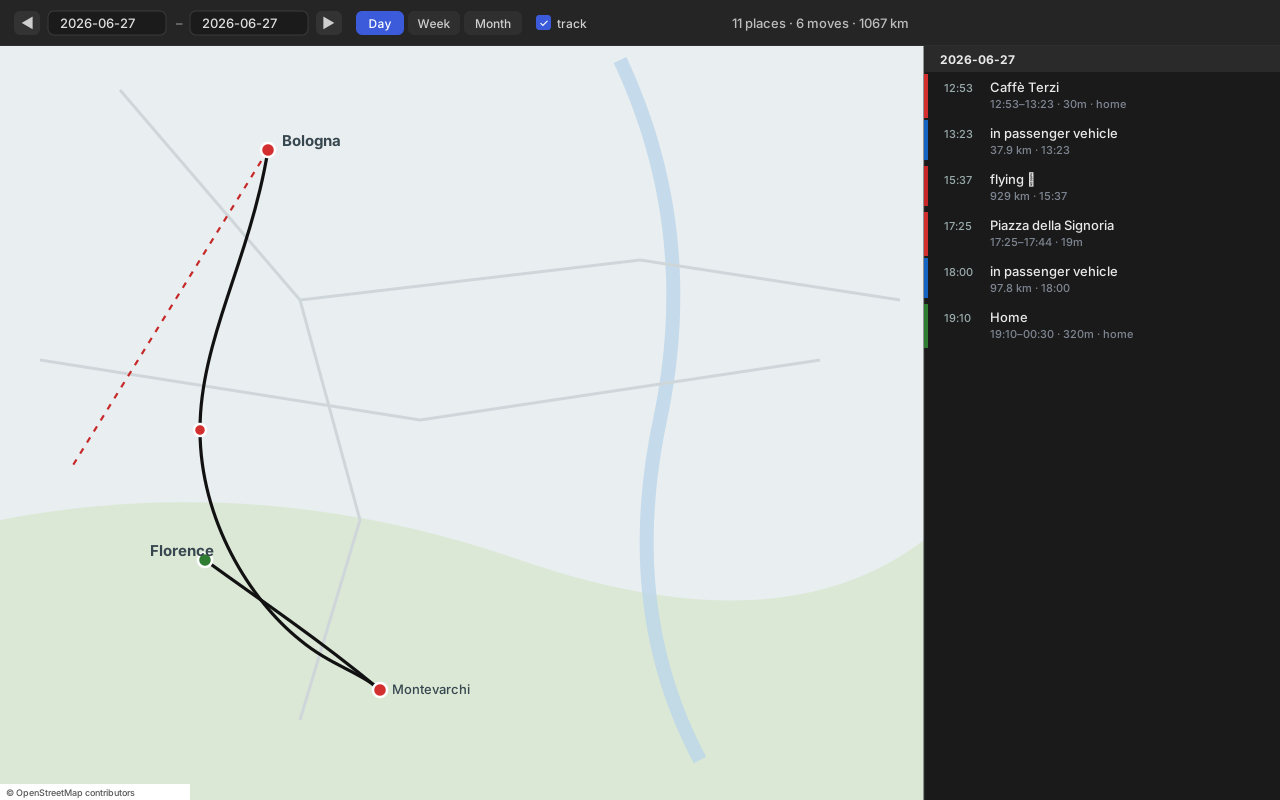
A two‑pane view: an interactive map on the left, a clickable timeline of that period on the right. Click any row to fly the map to it.
Features
- 🗺️ Interactive map of your location history — opens as its own pane, not a note.
- 📍 Visits as dots: 🟢 home · 🟣 work · 🔴 other. Click for name, time and duration.
- 🛣️ Real routes — your dense, road‑following GPS track (not a straight line between stops).
- ✈️ Flights drawn as a dashed line (because flights really are straight).
- 🗓️ Pickers — single day,
◀ ▶stepping, Day / Week / Month quick buttons, or a customfrom–torange. - 🧭 Timeline sidebar — every visit and move for the period, grouped by day; click to focus on the map.
- 🏷️ Place names on demand — resolves coordinate‑only visits (Google's newer on‑device export has no names) via the Places API, cached locally so each place is fetched only once.
- 🌍 Basemaps — OpenStreetMap or Esri Satellite (free, no key), or Google Roadmap / Satellite / Hybrid / Terrain via your own key (Map Tiles API).
- ⚡ Canvas rendering — handles months of dense data without freezing.
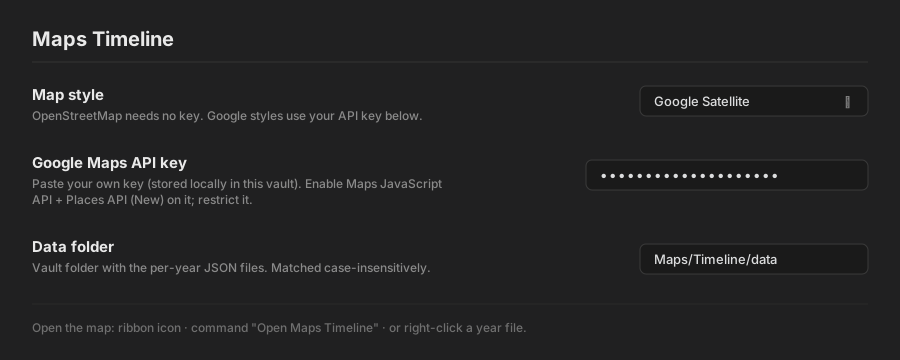
| Settings |
|---|
 |
Install
Manually
- Download
main.js,manifest.json,styles.cssfrom the latest release. - Copy them into
<your-vault>/.obsidian/plugins/maps-timeline/. - Settings → Community plugins → Maps Timeline → enable.
Via BRAT
Add jagajaga/obsidian-maps-timeline in the BRAT plugin.
Get your data
The plugin reads per‑year JSON files in a vault folder (default Maps/Timeline/data/). Generate them from your Google data once:
- Export your timeline:
- Takeout (history up to 2024): takeout.google.com → deselect all → Location History (Timeline) → export.
- On‑device (recent months): Google Maps app → profile → Settings → Location & privacy / Timeline → Export Timeline data →
Timeline.json.
- Convert with the scripts in
tools/(see tools/README.md):pip install ijson MAPS_TAKEOUT=/path/to/export MAPS_OUT=/your-vault/Maps/Timeline/data python3 tools/maps_days.py MAPS_TAKEOUT=/path/to/export MAPS_OUT=/your-vault/Maps/Timeline/data python3 tools/maps_tracks.py - Point the plugin's Data folder setting at that folder.
The data format is simple — any converter producing the same shape works.
Usage
Open the map three ways: right‑click a year file (…/2018.json) → Open in Maps Timeline, the 🗺 ribbon icon, or the command Open Maps Timeline. Then pick a day, step with ◀ ▶, jump with Day / Week / Month, or type a custom range. Toggle the dense track layer off for very large ranges.
Settings
| Setting | What it does |
|---|---|
| Map style | OpenStreetMap or Esri Satellite (no key), or a Google basemap (needs key). |
| Google Maps API key | Your own key, stored locally in the vault. Enable Map Tiles API (Google tiles) and Places API (New) (place names). Restrict it. |
| Data folder | Vault folder holding the per‑year JSON. Matched case‑insensitively. |
Data format
Each <year>.json is { "year": 2018, "days": { "YYYY-MM-DD": Day } }, where a Day is:
{
  "source": "old",
  "visits": [
    { "placeId": "ChIJ…", "name": "Caffè Terzi", "lat": 44.49, "lng": 11.34,
      "start": "2018-08-01T12:53:00Z", "end": "…", "minutes": 30, "semanticType": "TYPE_HOME" }
  ],
  "activities": [
    { "type": "IN_PASSENGER_VEHICLE", "km": 37.9, "start": [44.5,11.3], "end": [43.8,11.2],
      "startTime": "…", "path": [[lat,lng], …] }
  ],
  "paths": [ { "startTime": "…", "path": [[lat,lng], …] } ],
  "track": [ [lat,lng], … ]
}
name may be null for coordinate‑only visits — the plugin fills those in via the Places API and caches them.
Privacy
- Your location data lives only in your vault — the plugin never sends it anywhere.
- Your Google API key is stored locally and used only for Google tiles and Places‑name lookups, called directly from your client.
- OpenStreetMap / Esri Satellite modes use no key and make no Google calls.
Building
git clone https://github.com/jagajaga/obsidian-maps-timeline
cd obsidian-maps-timeline
npm install
npm run build      # bundles src/main.js + Leaflet -> main.js, and styles.css
Source lives in src/; main.js and styles.css are bundled outputs. Releases are built and attested by GitHub Actions (.github/workflows/release.yml).
Credits
- Leaflet (BSD‑2) — bundled map engine.
- Tiles: © OpenStreetMap contributors · © Esri · © Google (Map Tiles API).
- Interaction design inspired by kurupted/google-maps-timeline-viewer.
License
MIT. Bundled Leaflet retains its BSD‑2 license (see NOTICE).