Search...Search plugins and themes...
⌘K
Sign in
  • Get started
  • Download
  • Pricing
  • Enterprise
  • Account
  • Obsidian
  • Overview
  • Sync
  • Publish
  • Canvas
  • Mobile
  • Web Clipper
  • CLI
  • Learn
  • Help
  • Developers
  • Changelog
  • About
  • Roadmap
  • Blog
  • Resources
  • System status
  • License overview
  • Terms of service
  • Privacy policy
  • Security
  • Community
  • Plugins
  • Themes
  • Discord
  • Forum / 中文论坛
  • Merch store
  • Brand guidelines
Follow us
DiscordTwitterBlueskyThreadsMastodonYouTubeGitHub
© 2026 Obsidian

JessieCode

ryojerryyuryojerryyu26 downloads

Plugin for displaying interactive mathematical images described by JessieCode.

Add to Obsidian
  • Overview
  • Scorecard
  • Updates6

Plugin of Obsidian that creates interactive graphs described by JessieCode.

What is JessieCode?

JessieCode is a script language for JSXGraph, for describing interactive graphs.

A = point(1, 0);
B = point(-1, 0);
C = point(0.2, 1.5);
L_AB = line(A, B);
L_AC = line(A, C);
K_ABC = circle(A, B, C);

How to use

To create a graph create a code block with the language set to jessiecode. You can also use YAML frontmatter to set the width and height of the graph, or other attributes defined in the JSXGraph documentation.
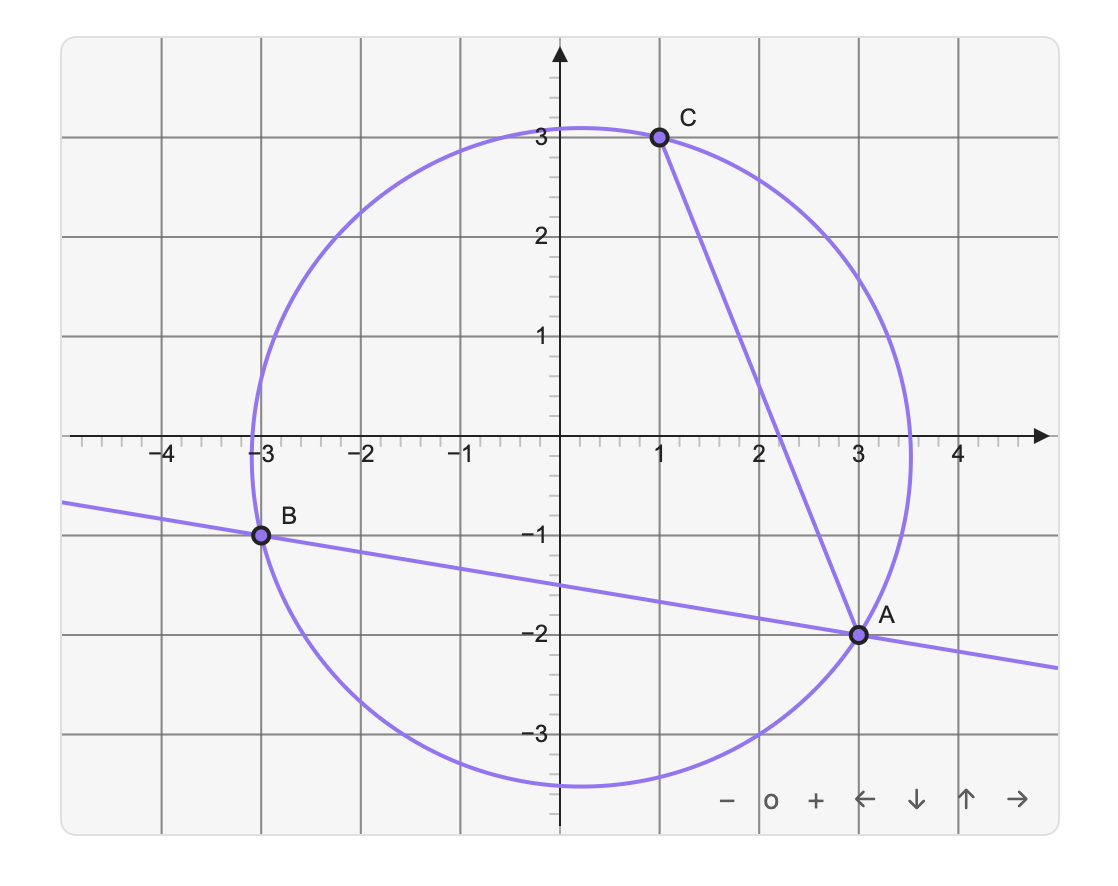
```jessiecode
---
width: 500
height: 400
boundingBox: [-5, 4, 5, -4]
---
A = point(3, -2);
B = point(-3, -1);
C = point(1, 3);
line(A, B);
segment(A, C);
circle(A, B, C);
```

And it will be rendered as:

Example graph

Bugs

If you find any bugs with this plugin please create a new issue so that they can be resolved.

Contributing

If you want to contribute please create an issue or pull request.

Attribution

This plugin uses

  • JSXGraph
  • JessieCode

And also thanks to obsidian-graphs plugin for the inspiration.

81%
HealthExcellent
ReviewCaution
About
Render interactive graphs defined in JessieCode (a JSXGraph script language) directly in Obsidian. Place JessieCode inside fenced code blocks labeled jessiecode and optionally use YAML frontmatter to set graph attributes like size and bounding box.
VisualizationMathCode
Details
Current version
1.0.6
Last updated
8 months ago
Created
8 months ago
Updates
6 releases
Downloads
26
Compatible with
Obsidian 1.5.12+
Platforms
Desktop, Mobile
License
GPL-3.0
Report bugRequest featureReport plugin
Sponsor
Patreon
Author
ryojerryyuryojerryyu
github.com/RyoJerryYu
GitHubryojerryyu
  1. Community
  2. Plugins
  3. Visualization
  4. JessieCode

Related plugins

Mermaid Tools

Improved Mermaid.js experience: visual toolbar with common elements and more.

Kroki

Render Kroki diagrams.

Advanced Canvas

Supercharge your canvas experience. Create presentations, flowcharts and more.

Templater

Create and use dynamic templates.

Excalidraw

Visual PKM powerhouse. Create and edit Excalidraw drawings.

Maps

Adds a map layout to bases so you can display notes as an interactive map view.

Life Tracker

Capture and visualize the data that matters in your life.

PlantUML

Generate PlantUML diagrams.

Numerals

Turn any code block into an advanced calculator. Evaluate math expressions on each line of a code block, including units, currency, and optional TeX rendering.

Strange New Worlds

Reveal networked thought and the strange new worlds created by your vault.