Heatmap Bases View
 ppeirce1k downloads
A GitHub-contributions-style heatmap view for Bases. Visualize boolean or numeric properties from daily notes over time.
- Overview
- Scorecard
- Updates6
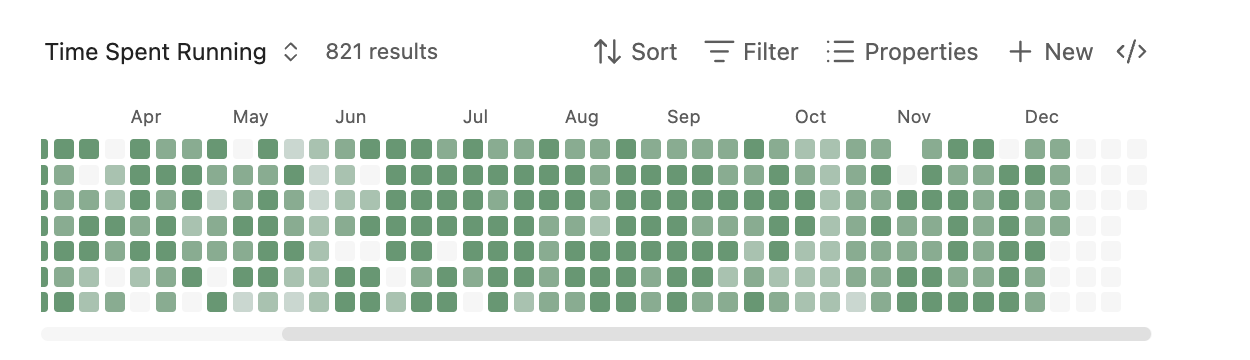
A GitHub-contributions-style heatmap view for Obsidian Bases. Visualize boolean or numeric properties from your daily notes over time.
Requires Obsidian 1.10.0 or later (Bases feature)
Features
- Calendar heatmap visualization of note properties
- Support for boolean (checkbox) and numeric properties
- Parse dates from filenames (daily notes) or date properties
- Customizable color schemes (5 built-in, add your own in Settings)
- Light and dark theme support
- Configurable date ranges
- Layout direction (horizontal or vertical)
- Cell size presets (small, medium, large)
- Click cells to open corresponding notes
- Keyboard navigation support
Installation
Manual Installation
Build the plugin (or download release files):
npm install
npm run build
Create a folder for the plugin in your vault:
<YourVault>/.obsidian/plugins/heatmap-bases-view/Copy these files to the plugin folder:
main.jsstyles.cssmanifest.json
Reload Obsidian (Ctrl/Cmd + R)
Enable the plugin in Settings > Community Plugins
Usage
Setting Up a Base with Heatmap View
Create some daily notes with a boolean or numeric property. For example, create notes named
2025-01-01.md,2025-01-02.md, etc. with frontmatter:--- exercise: true ---Or with numeric values:
---
mood: 7
---
Create a new Base:
- Open the command palette (Ctrl/Cmd + P)
- Search for "Create new base"
- Give it a name like "Exercise Tracker"
Configure the Base source:
- In the Base, click the filter icon or settings
- Set the source folder to where your daily notes are stored (e.g.,
Daily Notes/)
Switch to Heatmap view:
- Click the view switcher (usually shows "Table" by default)
- Select "Heatmap" from the dropdown
Configure the Heatmap:
- Click the settings/options for the view
- Date property: Leave empty to parse dates from filenames, or select a date property
- Value property: Select the property to visualize (e.g.,
exerciseormood) - Optionally configure color scheme, date range, and label visibility
Example: Habit Tracker
Create daily notes with this frontmatter structure:
---
meditated: true
exercise: false
water_glasses: 8
mood: 7
---
Then create separate Bases for each habit:
- "Meditation Tracker" → Value property:
meditated - "Exercise Tracker" → Value property:
exercise - "Hydration" → Value property:
water_glasses - "Mood" → Value property:
mood
Example: Using a Date Property
If your notes aren't named with dates, you can use a date property instead:
---
date: 2025-01-15
completed: true
---
In the Heatmap settings:
- Date property: Select
date - Value property: Select
completed
Configuration Options
| Option | Description |
|---|---|
| Date property | Property containing the date, or leave empty to parse from filename |
| Value property | Boolean or number property to visualize |
| Start date | Beginning of date range (YYYY-MM-DD), or leave empty for auto |
| End date | End of date range (YYYY-MM-DD), or leave empty for today |
| Color scheme | Select from available schemes (customize in Settings) |
| Week starts on | Sunday or Monday |
| Show weekday labels | Toggle Mon/Wed/Fri labels |
| Show month labels | Toggle month labels at top |
| Layout direction | Horizontal (GitHub-style) or vertical (calendar-style) |
| Cell size | Small (11px), medium (16px), or large (24px) |
Color Interpretation
- Empty (hollow): No note exists for this date
- Dim filled: Note exists but value is false/0/missing
- Colored intensity: Note exists with positive value
- For booleans: full intensity when true
- For numbers: intensity scaled between min and max values
Development
# Install dependencies
npm install

# Development build with watch mode
npm run dev

# Production build
npm run build

# Lint code
npm run lint

# Lint and auto-fix
npm run lint:fix
Linting runs automatically on staged files before each commit via husky pre-commit hooks.
Releasing
See RELEASING.md for the complete release process and version management.