Edit History Heatmap
 mimo159 downloads
Like the github contribution graph but for obsidian edits, works on edits before you installed it too.
- Overview
- Scorecard
- Updates10
See when you write. Edit History Heatmap turns your Obsidian Sync version history into a contribution graph for your vault.
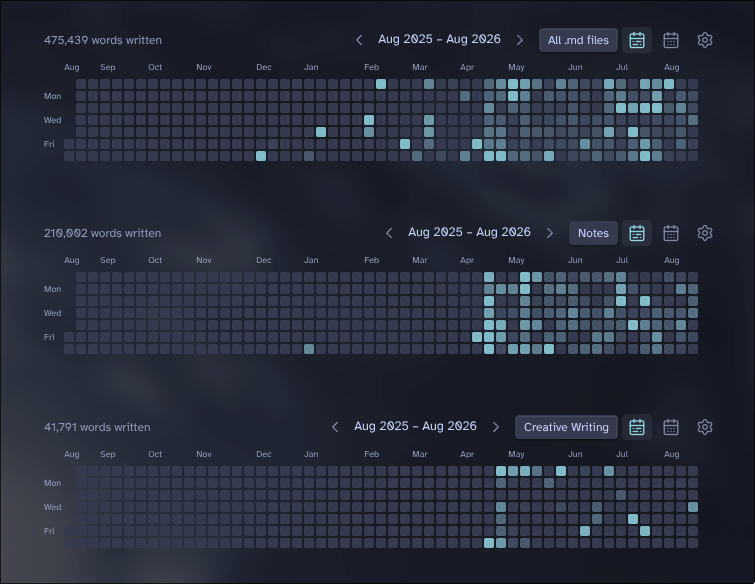
It tracks the daily net change in words, lines, or characters, and can show either total change or additions and removals separately. Hover over a day for the file breakdown, or drag across several days to total them up.
Using it
Open Edit History Heatmap: Open heatmap, click Scope, and pick any folders or tags you want to include. Nothing is scanned until you choose a scope. Opening the scope menu pauses the current scan, and closing it starts scanning your new selection.
Scopes belong to individual heatmaps. The sidebar and each embedded code block remember their own selection, so two heatmaps can show different folders or tags side by side. Files shared by several scopes are scanned only once.
The sidebar shows a month calendar. To put the rolling year heatmap in a note, use:
```edit-history-heatmap
```
Put month inside the block if you want it to start in month view.
A few things to know
- Obsidian Sync is required. Other sync services do not provide the version history this plugin needs.
- The plugin uses an undocumented Obsidian Sync API, so a future Obsidian update could break it.
- Old note contents are compared in memory and are never saved by the plugin.
- Only the final available version of each note on each calendar day is compared. Revisions made and undone within the same day are intentionally not counted repeatedly.
- Excalidraw drawings are excluded, including drawings saved with ordinary
.mdfilenames. - The cache only contains dates, file paths, version IDs, and aggregate counts. There is no telemetry.
- The oldest available daily version is counted as the note's creation, then later days are compared against it. History that Obsidian Sync no longer retains cannot be recovered.
- If community plugin settings are included in your Sync configuration, the aggregate cache can be shared between devices.
Installing
Until it is available in the Obsidian Community directory, install it with BRAT, or copy main.js, manifest.json, and styles.css from a release into:
<vault>/.obsidian/plugins/edit-history-heatmap/
Development
npm install
npm run lint
npm test
npm run build
Made by wavey. Licensed under MIT.