Easy TikZ
 Saiki77629 downloads
Visually design TikZ and pgfplots graphs with a live SVG preview. Supports 2D functions, 3D surfaces, tangents, extrema, and one-click code insertion.
- Overview
- Scorecard
- Updates46
 |
 |
 |
 |
One-minute walkthrough - every tab, function, and tool end-to-end. (MP4)
Tighter clip - open the modal, edit, pan / drag, insert, click the rendered chart to re-edit. (MP4)
Why
Pgfplots is powerful but the syntax is fiddly and the feedback loop is "edit, recompile, squint". Easy TikZ is a visual editor with a live preview that renders the chart in your note directly - no TeX install needed for in-vault use, and the same model exports clean pgfplots when you want to publish.
Install
From inside Obsidian (recommended)
- Settings → Community plugins → Browse.
- Search Easy TikZ and click Install, then Enable.
Via BRAT (early-access builds between releases)
- Install the BRAT plugin.
- BRAT settings → Add Beta Plugin → paste
Saiki77/easy-tikz. - Enable Easy TikZ under Settings → Community plugins.
Manual: download main.js, manifest.json, styles.css from the latest release into <your vault>/.obsidian/plugins/easy-tikz/.
Migrating from 2.x. The plugin id changed to easy-tikz in 3.0. Rename .obsidian/plugins/tikz_graph_helper/ to .obsidian/plugins/easy-tikz/, then re-enable. Settings carry over.
Quick start
- Click the function icon in the ribbon (or run Easy TikZ: open from the palette).
- Type an expression on the Functions tab -
sin(x),x^2 - 3*x,sin(sqrt(x^2 + y^2))in 3D. The preview updates as you type. - Insert into note. The plugin emits an
easy-tikzcode block which it renders inline.
Open an existing chart by clicking it in your note - the modal re-opens with every setting filled in, and saving replaces the source block in place.
Plot
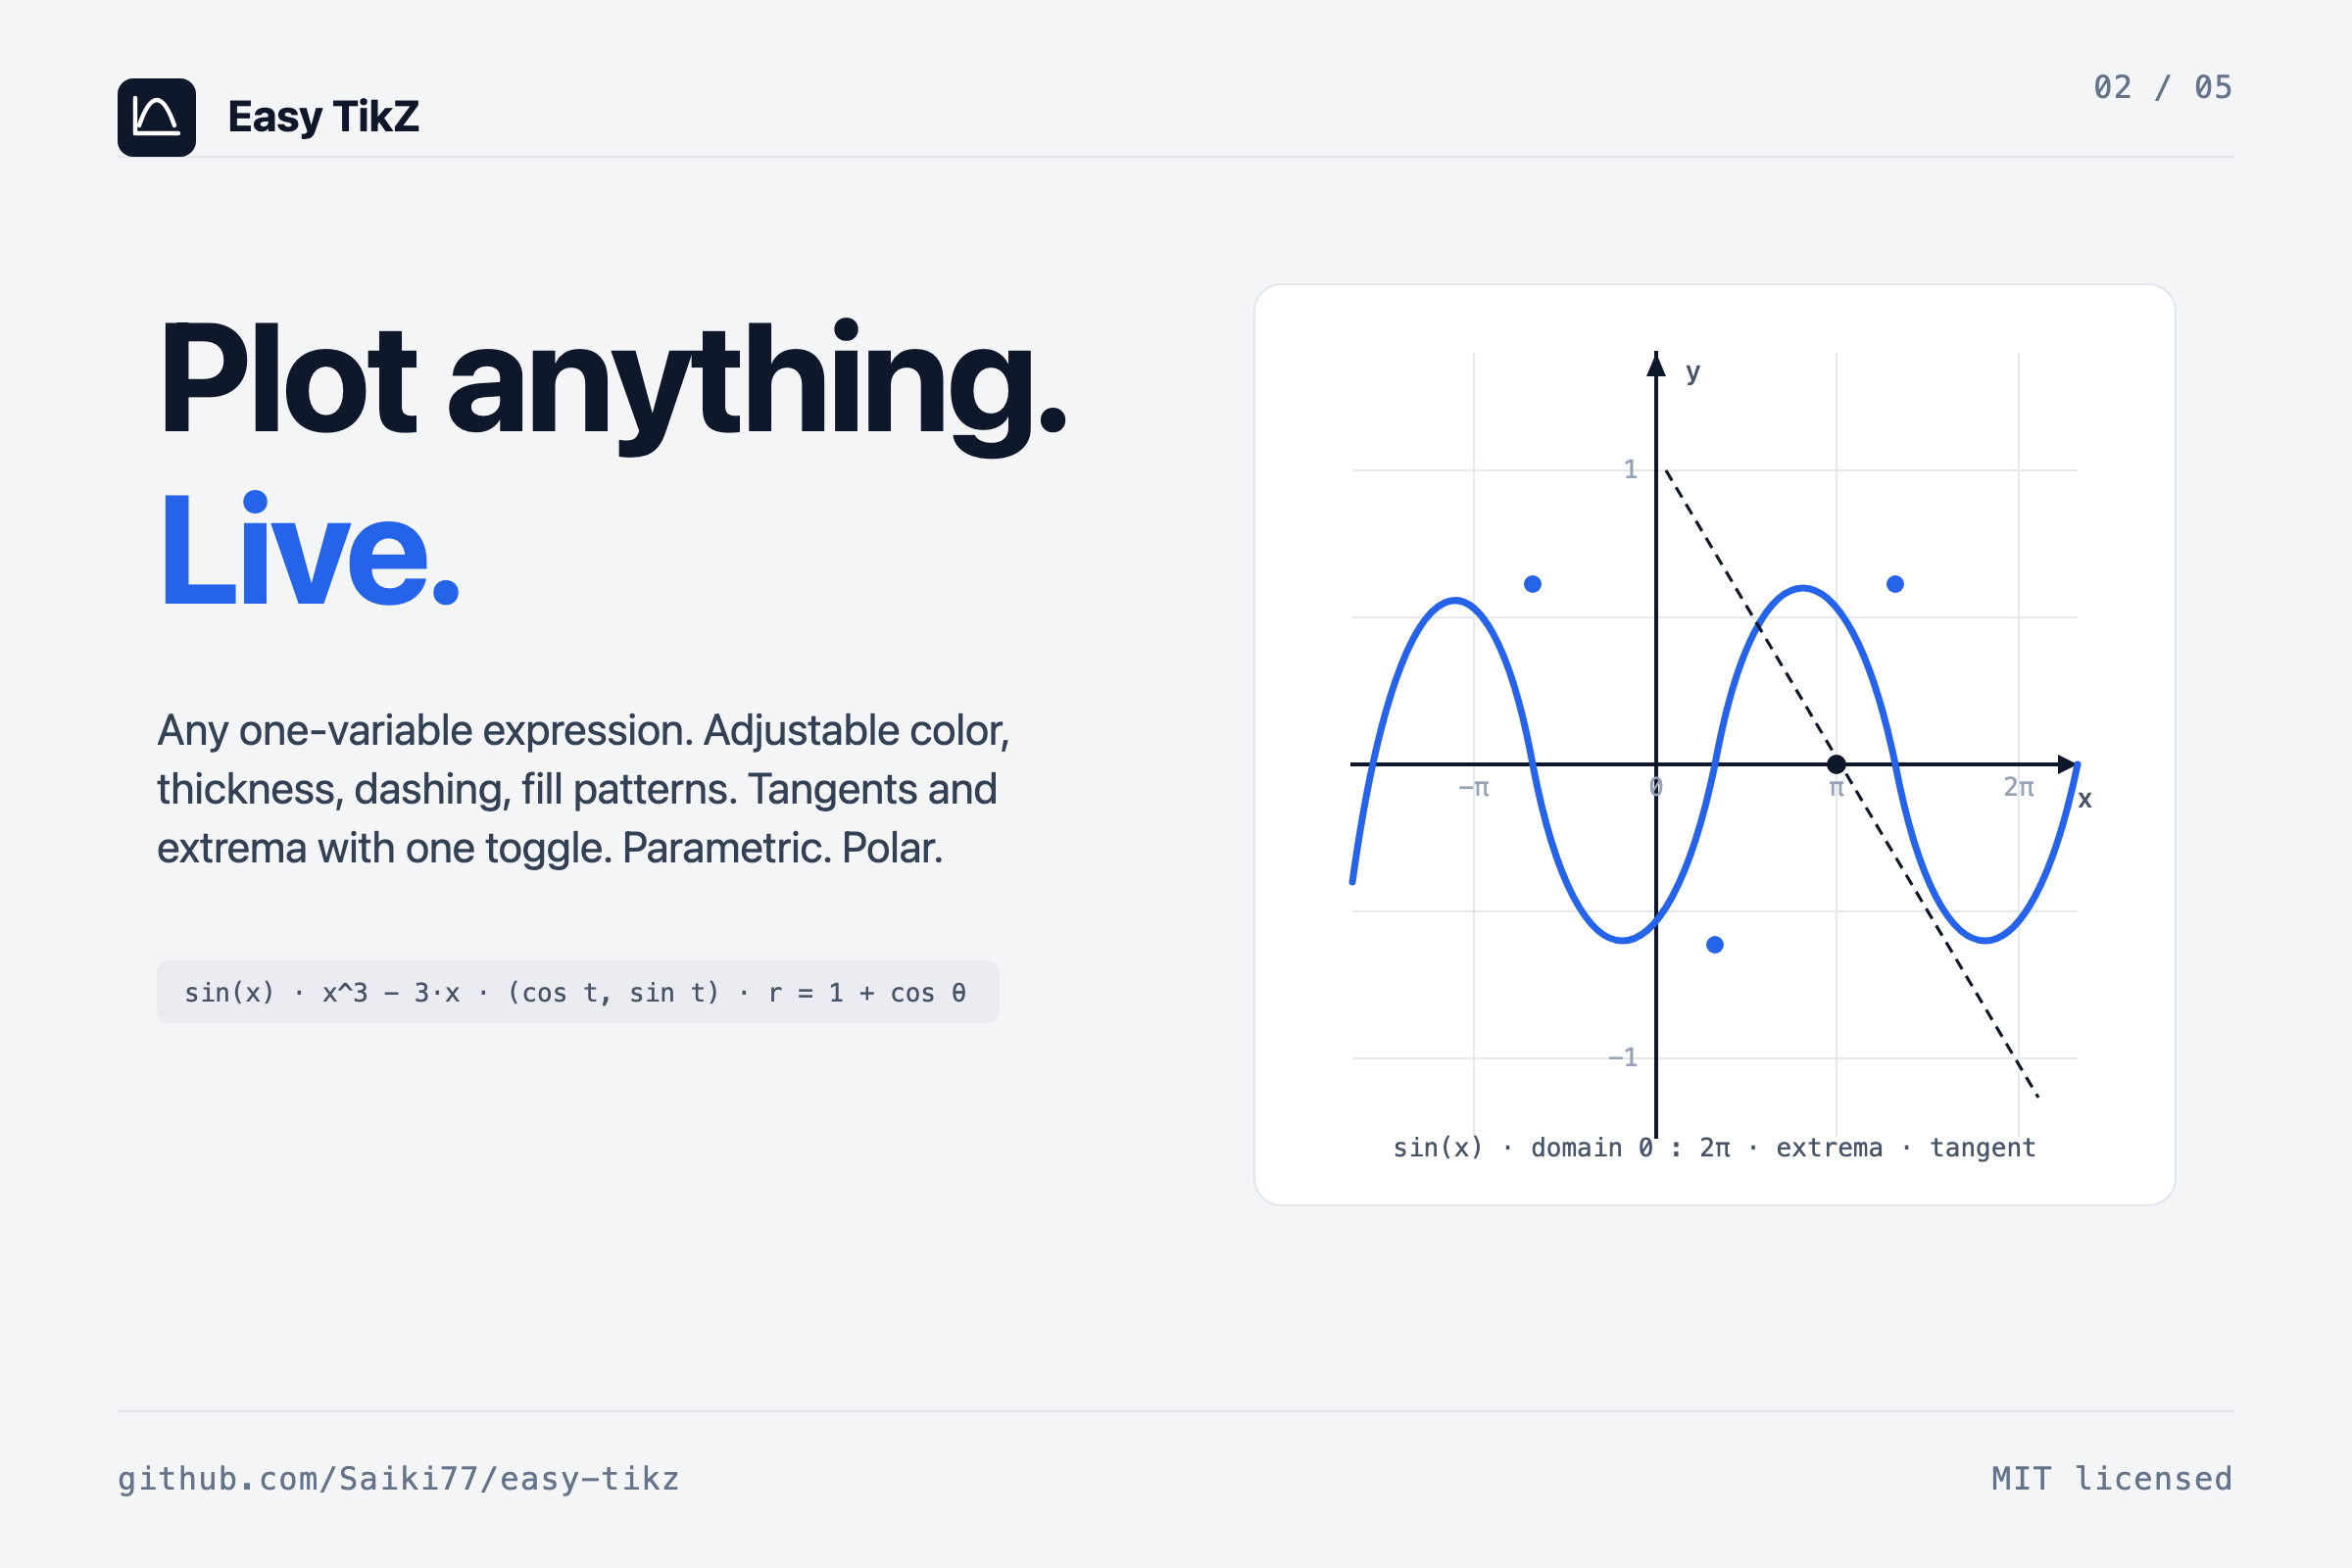
2D. Any one-variable expression. ^ is power, Math.* helpers are bare names, PI and E are constants. Toggle per-function: legend, fill (solid or pattern), dashed, tangent at a given x, automatic extrema markers, parametric (x(t), y(t)), or polar (r(θ)).
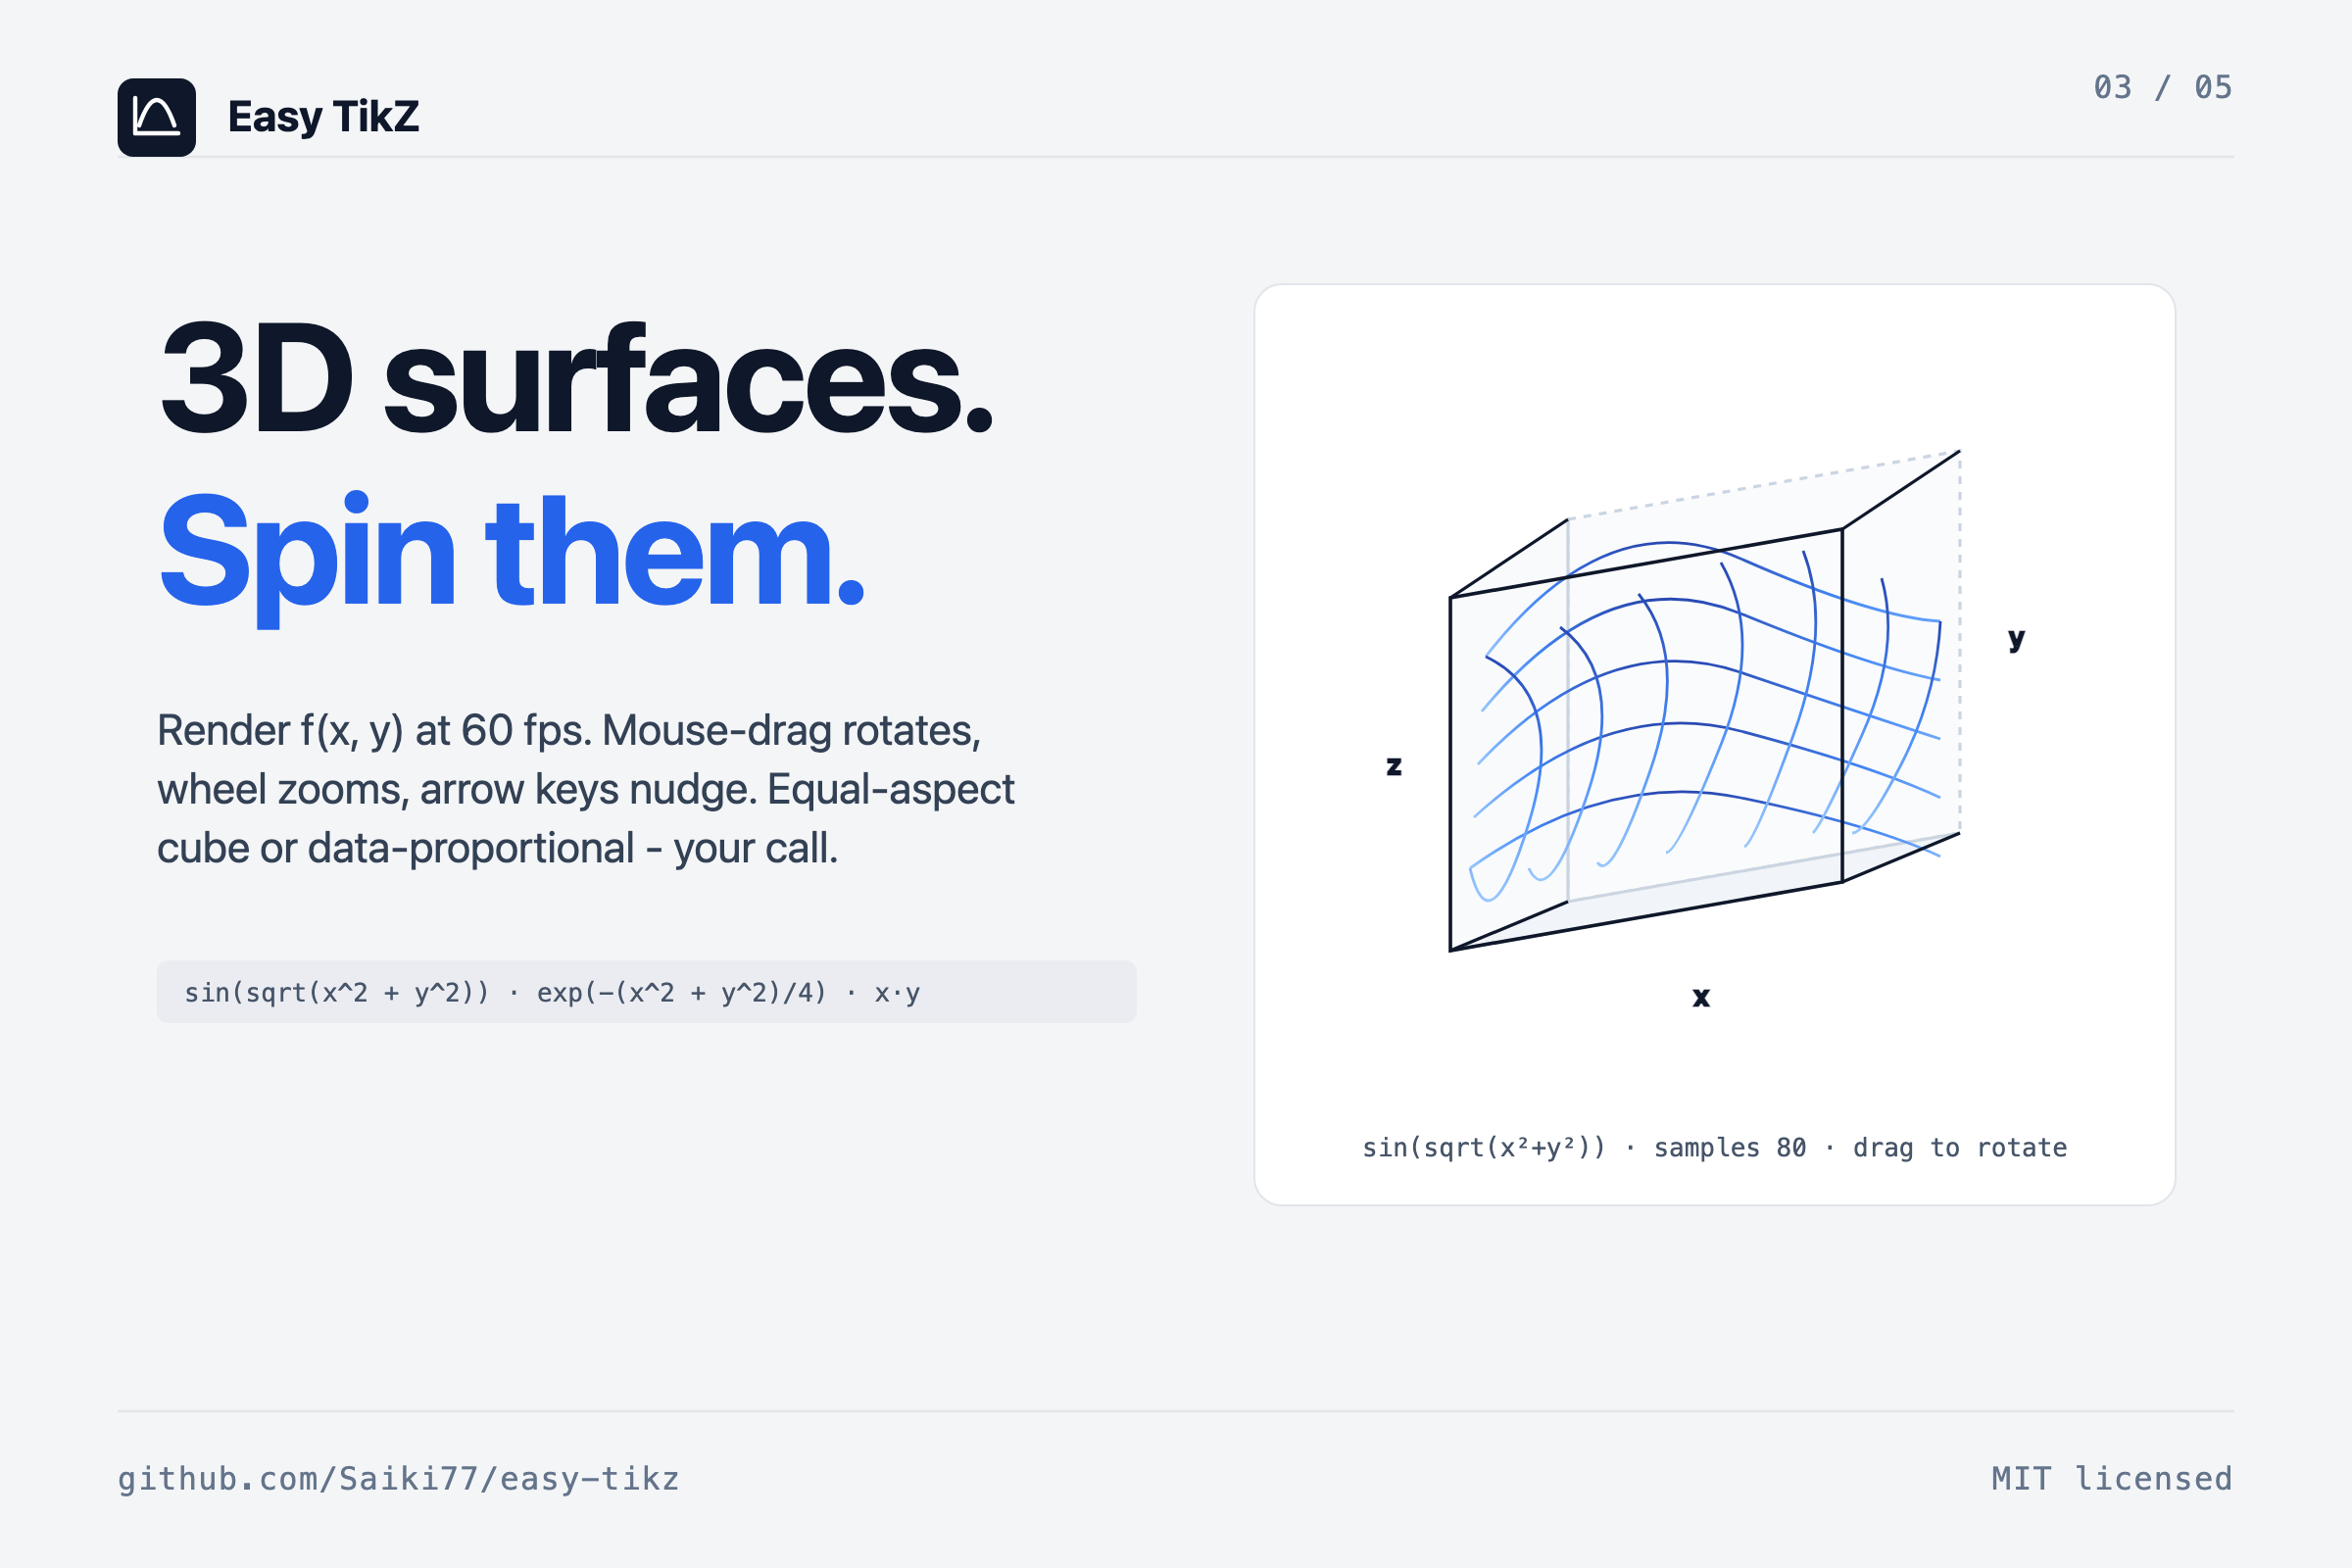
3D. Two-variable expressions over (x, y). Wireframe or filled with adjustable opacity. Drag the preview to rotate, scroll to zoom, arrow keys for fine adjustments. Plugin setting controls the maximum samples-per-axis slider (default cap 80, raise up to 400 for export-quality surfaces).
sin(x)                       sin(x) * exp(-x/5)            r = 1 + cos(θ)
x^3 - 3*x                    1/(1 + x^2)                   (cos t, sin t)
sin(sqrt(x^2 + y^2))         exp(-(x^2 + y^2)/4)           x*y
The Reference tab inside the modal lists everything supported with examples.
Tools
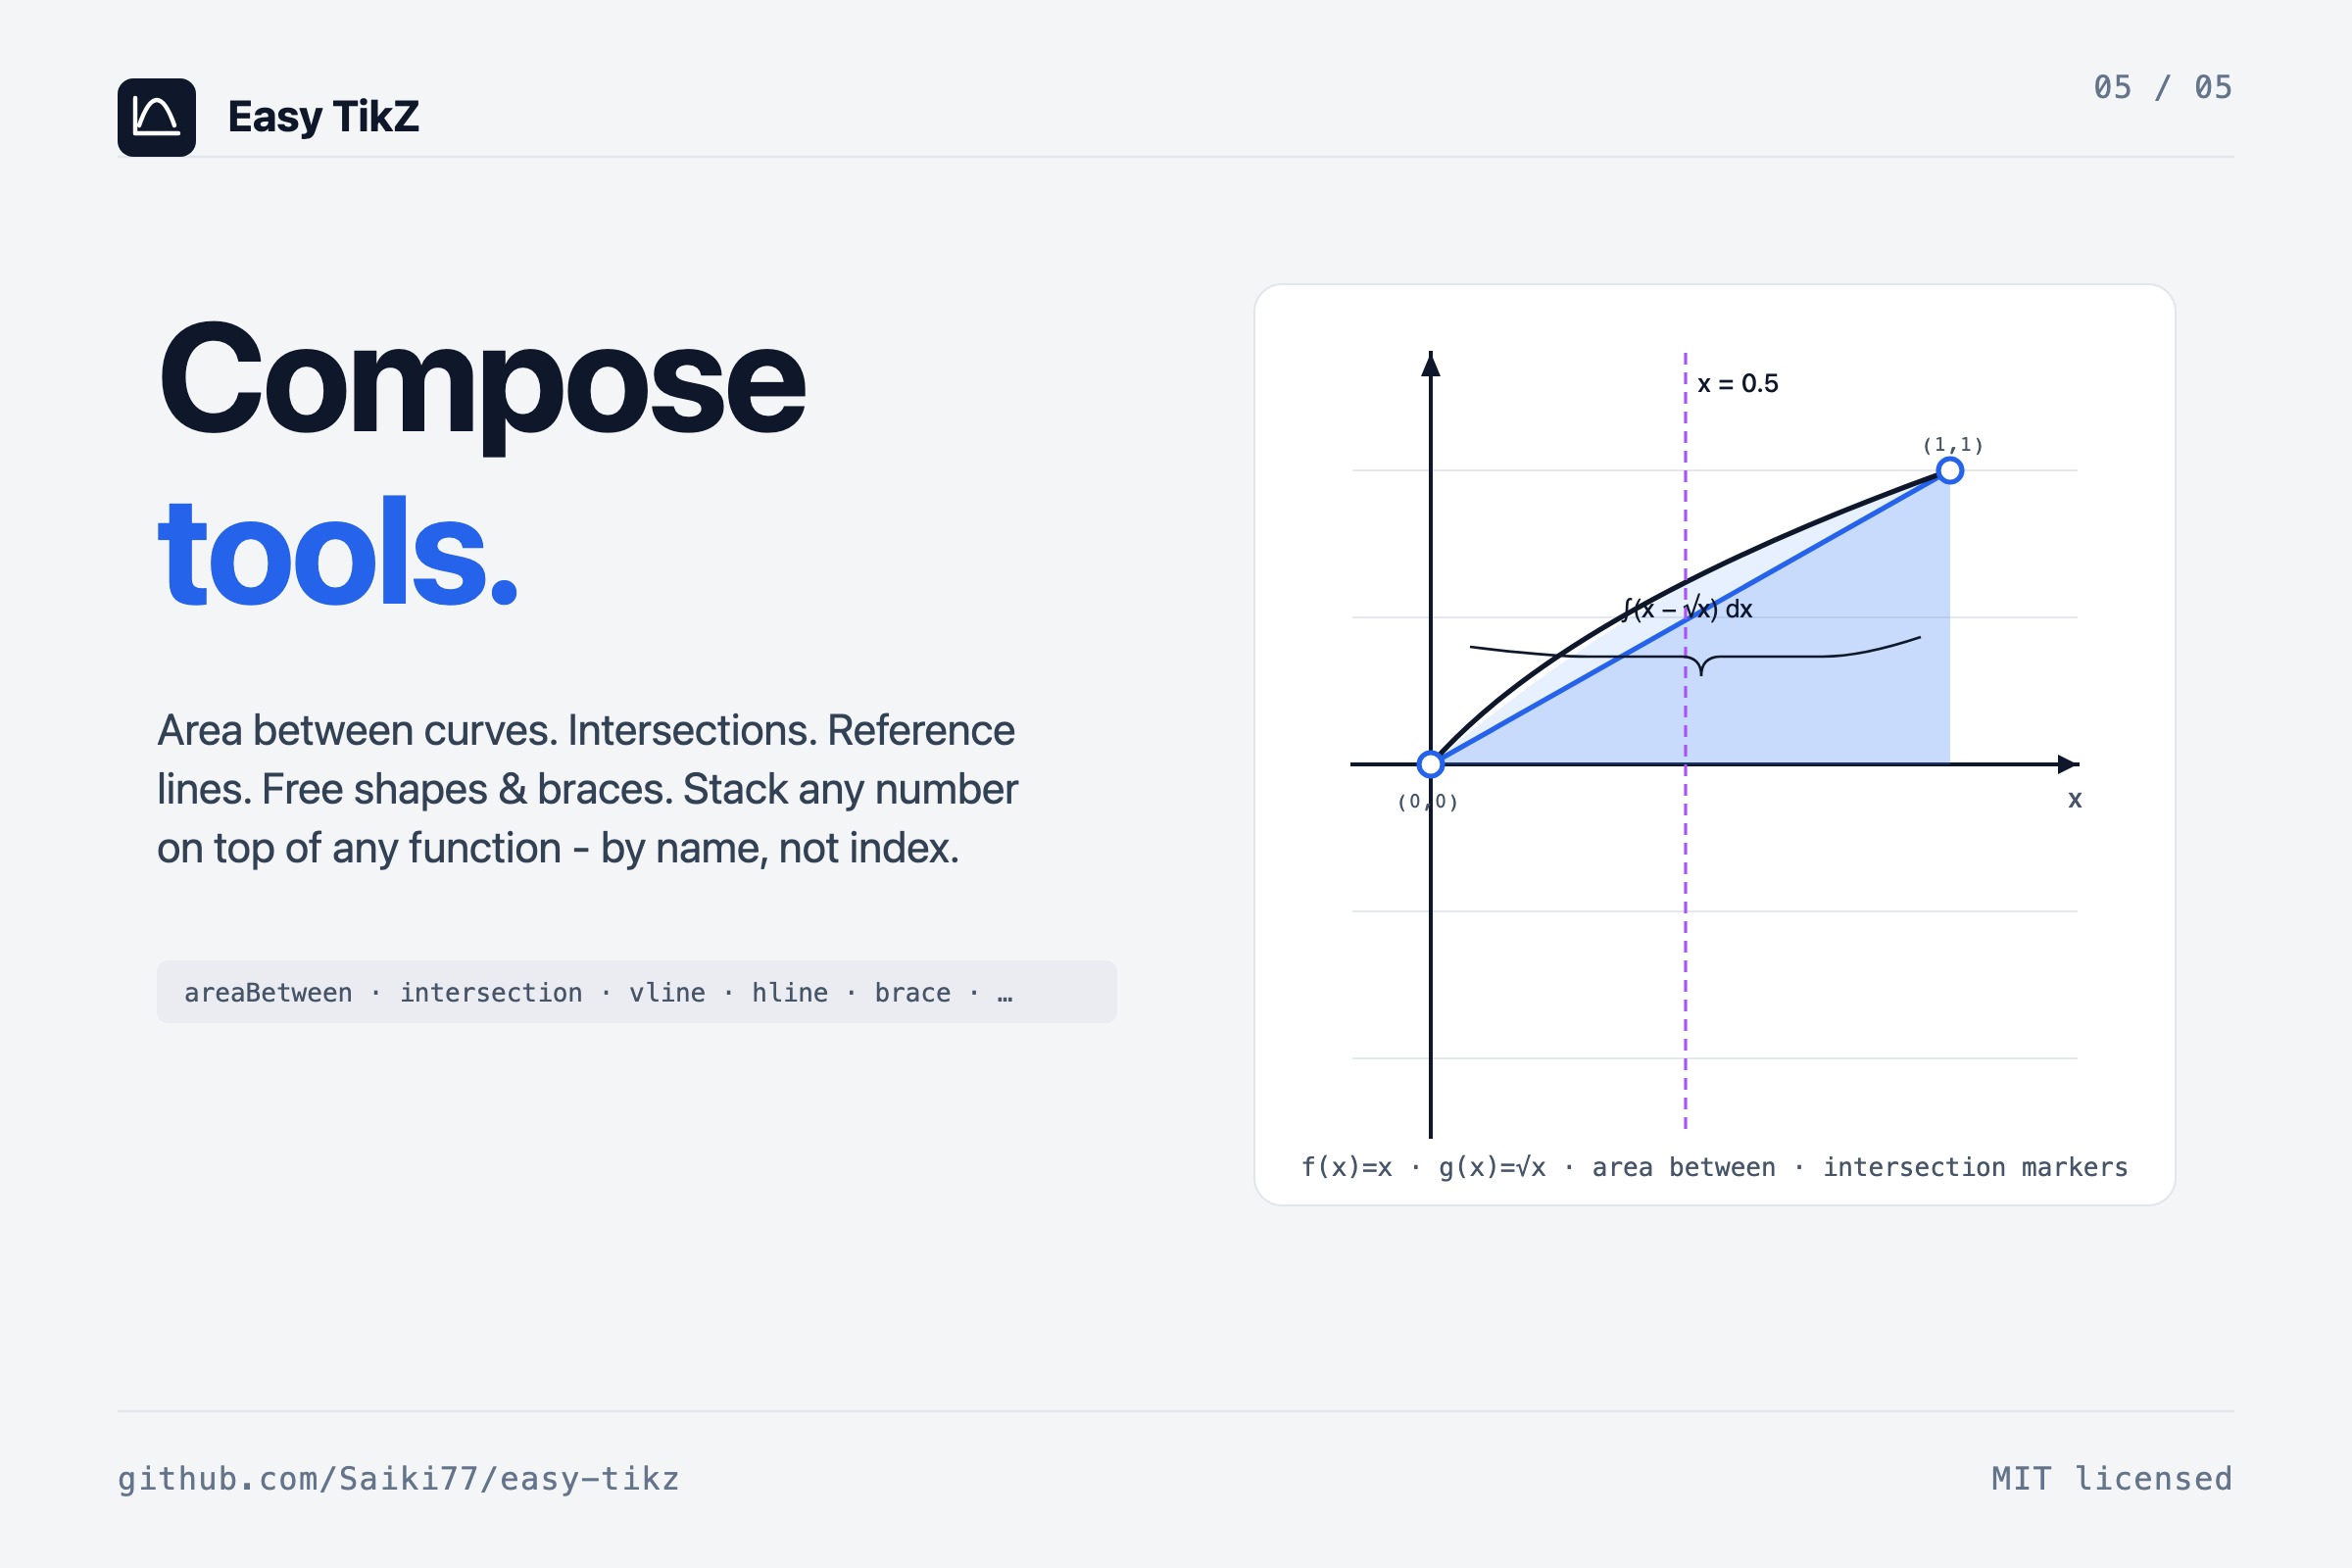
On top of your functions you can stack composable tools - these render alongside the curves in the preview and emit native pgfplots in the export:
| Tool | What it draws |
|---|---|
areaBetween |
Filled region between two functions by name over an optional sub-domain. |
intersection |
Dots (and optional (x, y) labels) at every crossing of two functions on the visible range. |
verticalLine |
Vertical reference at x = c, optional label near the top. |
horizontalLine |
Horizontal reference at y = c, same knobs. |
rectangle |
Free rectangle with stroke + optional fill pattern. |
circle |
Free circle by center and radius. |
segment |
Line segment with arrow style none / forward / backward / both. |
brace |
Curly brace between two points with optional centered label. |
plane3D |
Slice plane at axis = constant in 3D, with chosen opacity. |
point3D |
Marker at (x, y, z) with optional label. |
segment3D |
3D line between two points, optional arrow. |
Function references use a Name field on each function card (auto-populated as f1, f2, …, user-editable). That means "area between f and g" is stable across edits even if you reorder the functions.
Inline rendering in notes
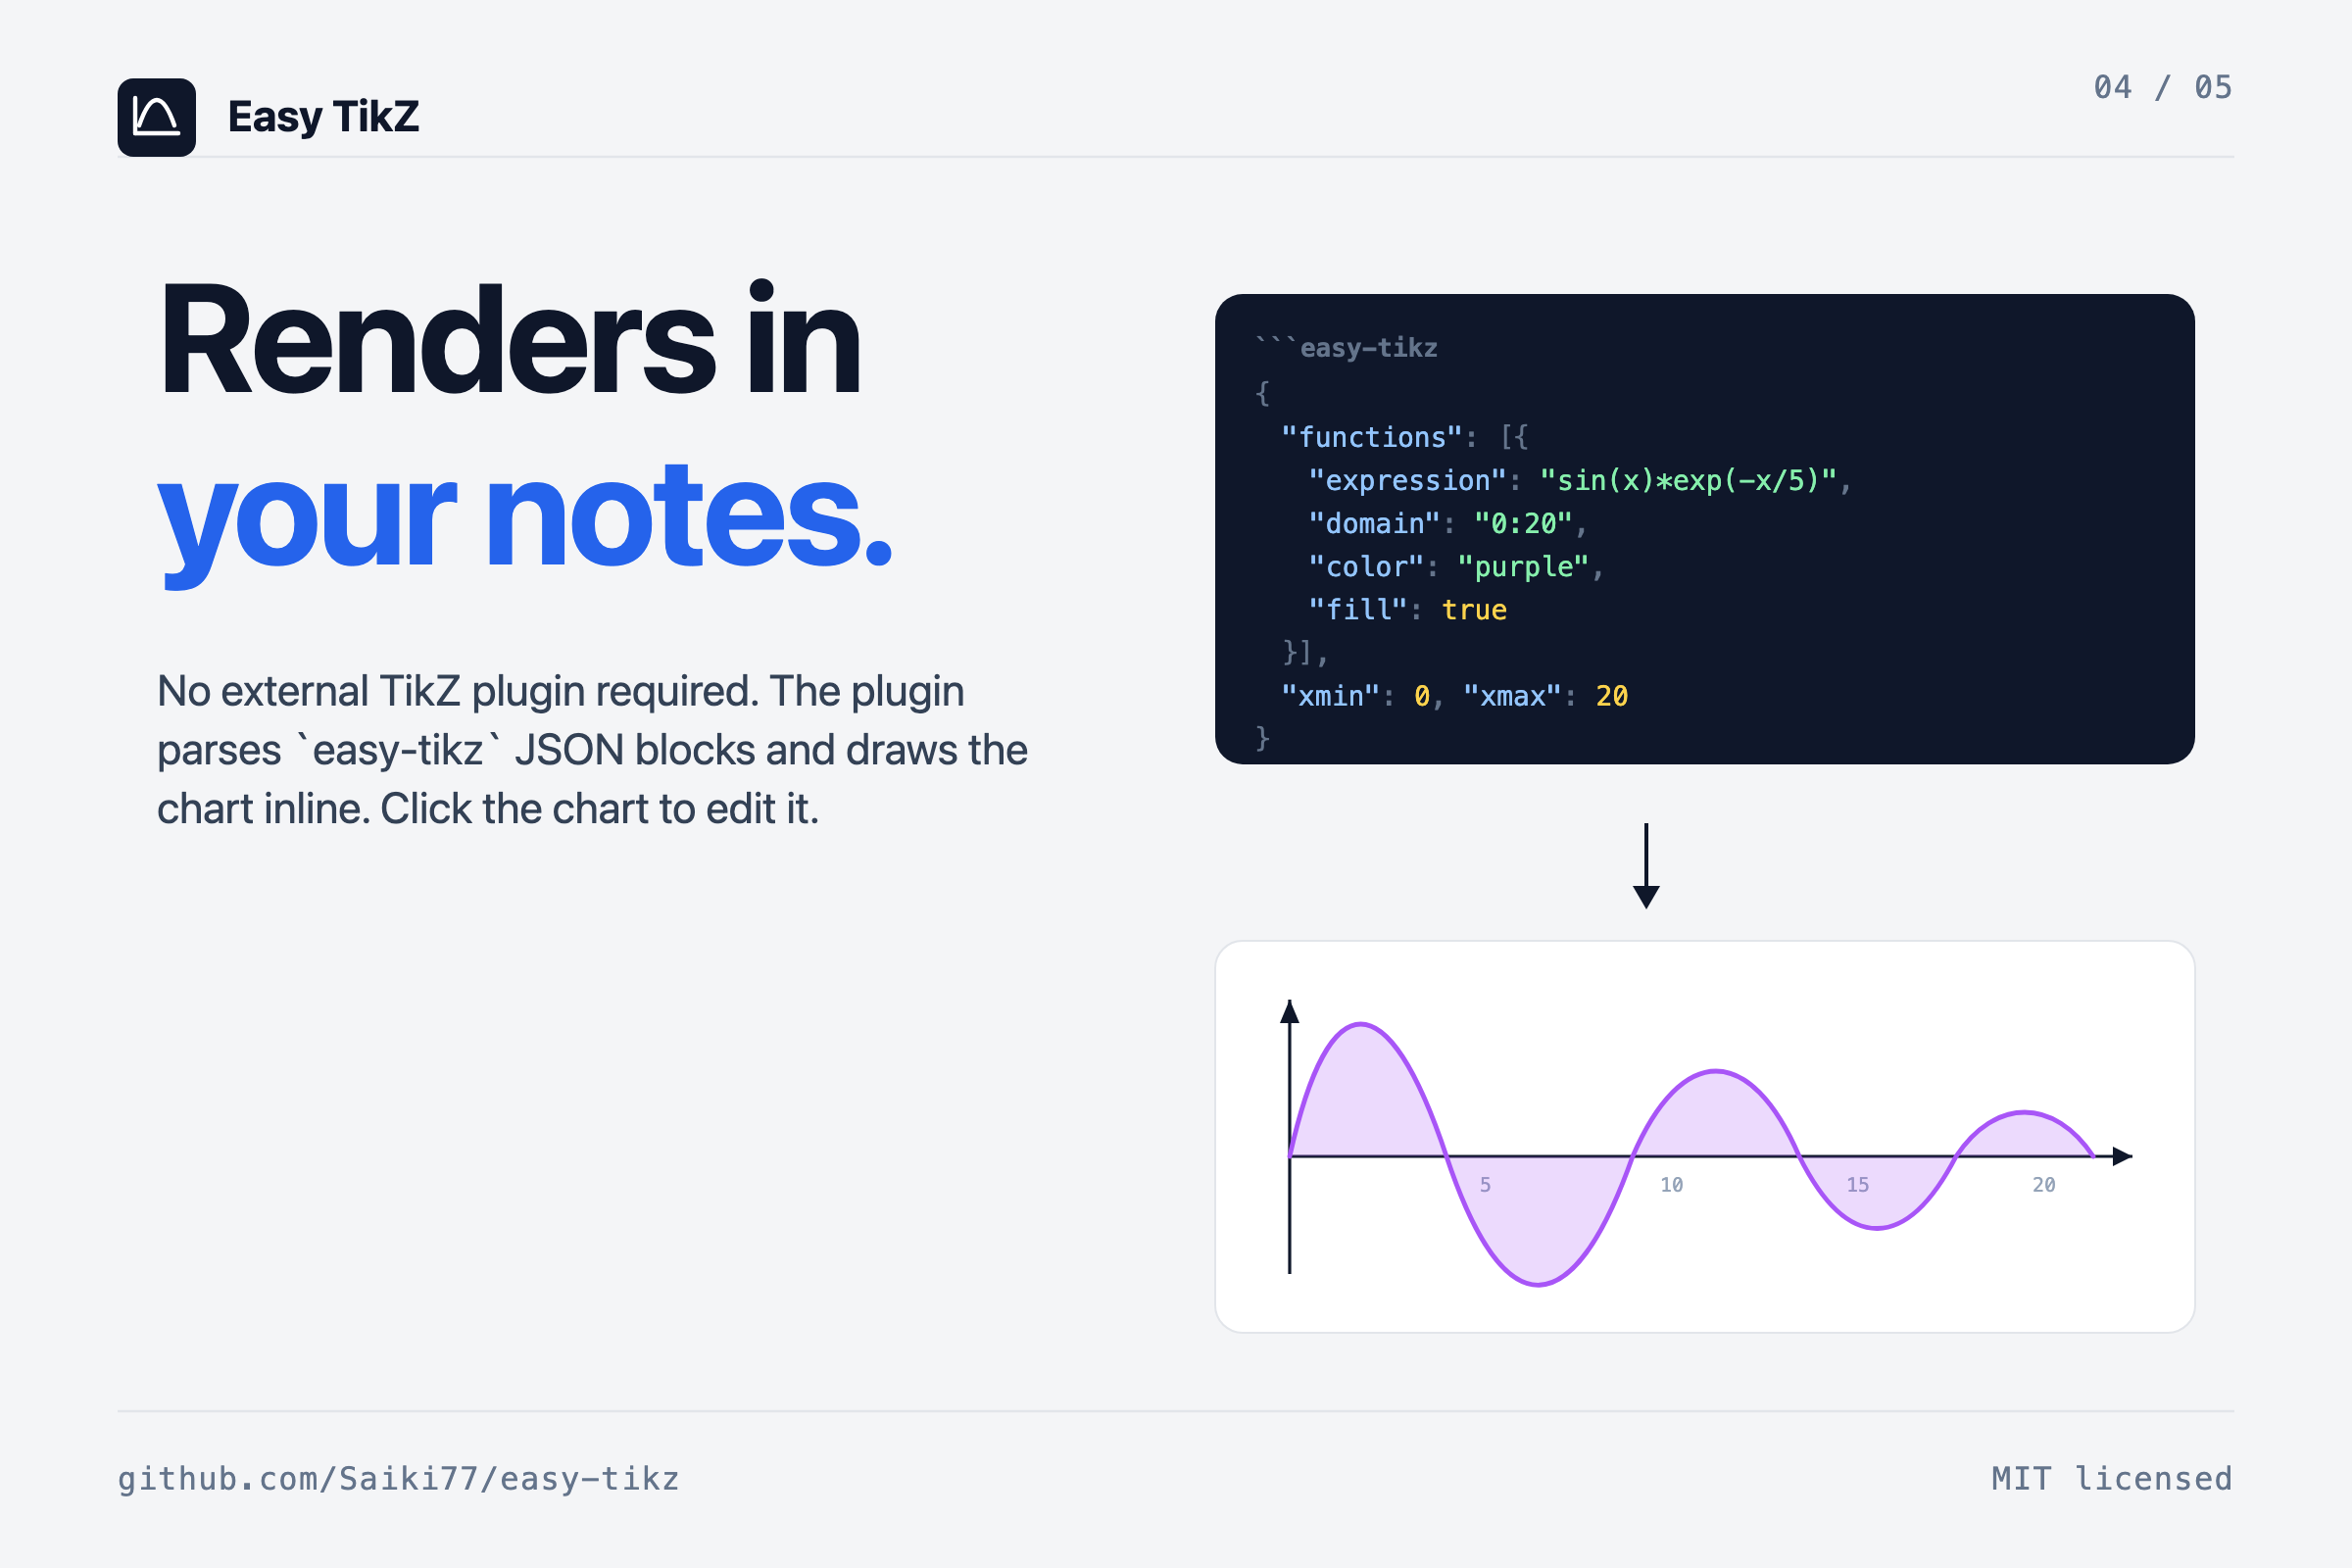
The plugin registers an easy-tikz markdown code-block processor. Insert into note writes a JSON block; the same SVGRenderer / SVG3DRenderer that powers the modal preview renders the chart in your note. Click the rendered chart to re-open the modal pre-filled with every setting - change something, Save changes, the block in the source file is replaced in place.
Plugin setting "Also render plain tikz blocks" opts in to claim the tikz language tag as well; off by default to coexist peacefully with obsidian-tikzjax and similar.
Export
Copy TikZ code produces standalone pgfplots that compiles with any TeX install - \usepgfplotslibrary{fillbetween} is injected automatically when an areaBetween tool is in use, the polar code path emits axis equal, axis equal image lights up when Box aspect is set to Equal. The inline render and the exported TikZ share one in-memory model, so what you see in the modal is what pgfplots draws - and the modal's Copy SVG and Copy PNG buttons each serialize the live scene with theme colours already resolved.
Plugin settings
Settings → Community plugins → Easy TikZ:
- Invert vertical drag in 3D. Trackball convention by default (drag down tilts the scene up); flip for direct manipulation (camera follows finger).
- Max 3D samples per axis. Upper bound of the per-surface Samples slider. Default 80; can go up to 400 for export-quality meshes.
- Also render plain
tikzblocks. Off by default; on if you want one tag for everything (conflicts with obsidian-tikzjax). - 2D pan sensitivity. Default 1.0 (direct: 1 mouse pixel = 1 chart pixel). 0.1–2.0.
Live rendering, briefly
The preview is drawn in-process by a small custom pipeline - no shell-out, no LaTeX compile, no image round-trip - which is what lets the camera follow the cursor without lag. A typical 3D surface (samples=40, 1,600 quads) sits at ~60 fps; the slider's upper end (samples=120, 14,400 quads) settles above 30 fps. Sampled surface data is cached per-surface, keyed by expression + domain + sample count + z-range, so a pure camera change (rotation, zoom) re-projects from the cache without re-evaluating the function. Expression compilation is cached (LRU, 128 entries) so the 500 samples of a 2D curve compile their expression once per render, not once per sample.
Permissions
- Clipboard: writes TikZ code / SVG / PNG on the Copy … buttons. No reads.
- Active note: inserts an
easy-tikzblock on Insert into note, replaces an existing block when saving from click-to-edit. - Network: none.
- Telemetry: none.
- Math evaluation: user expressions are compiled with
Functionand evaluated in-renderer to draw the preview. Nothing is persisted or transmitted.
Development
npm install
npm run dev    # watch mode
npm run build  # production build
src/
  modal.ts         # main modal UI + click-to-edit lifecycle
  renderer.ts      # 2D SVG renderer (functions + tools)
  renderer3d.ts    # 3D SVG / canvas renderer
  settings.ts      # state, serialisation, TikZ code generation
  math.ts          # expression evaluation, extrema, intersections
  colors.ts        # shared palette
  templates.ts     # built-in function templates + plugin data shape
  util.ts          # tick formatting, latex stripping
  styles.css       # all UI styling
  types.ts         # shared interfaces and the Tool union
License
MIT.