DOT Diagrams
 theluckystrike1 downloads
Render Graphviz DOT code blocks as diagrams in your notes, fully offline, with theme-aware colors.
- Overview
- Scorecard
- Updates1
DOT Diagrams draws Graphviz DOT code blocks as diagrams inside your notes. It works offline on desktop and on mobile. It needs no server and no installed Graphviz program. The layout engine is inside the plugin as WebAssembly, so your graph never leaves your device.
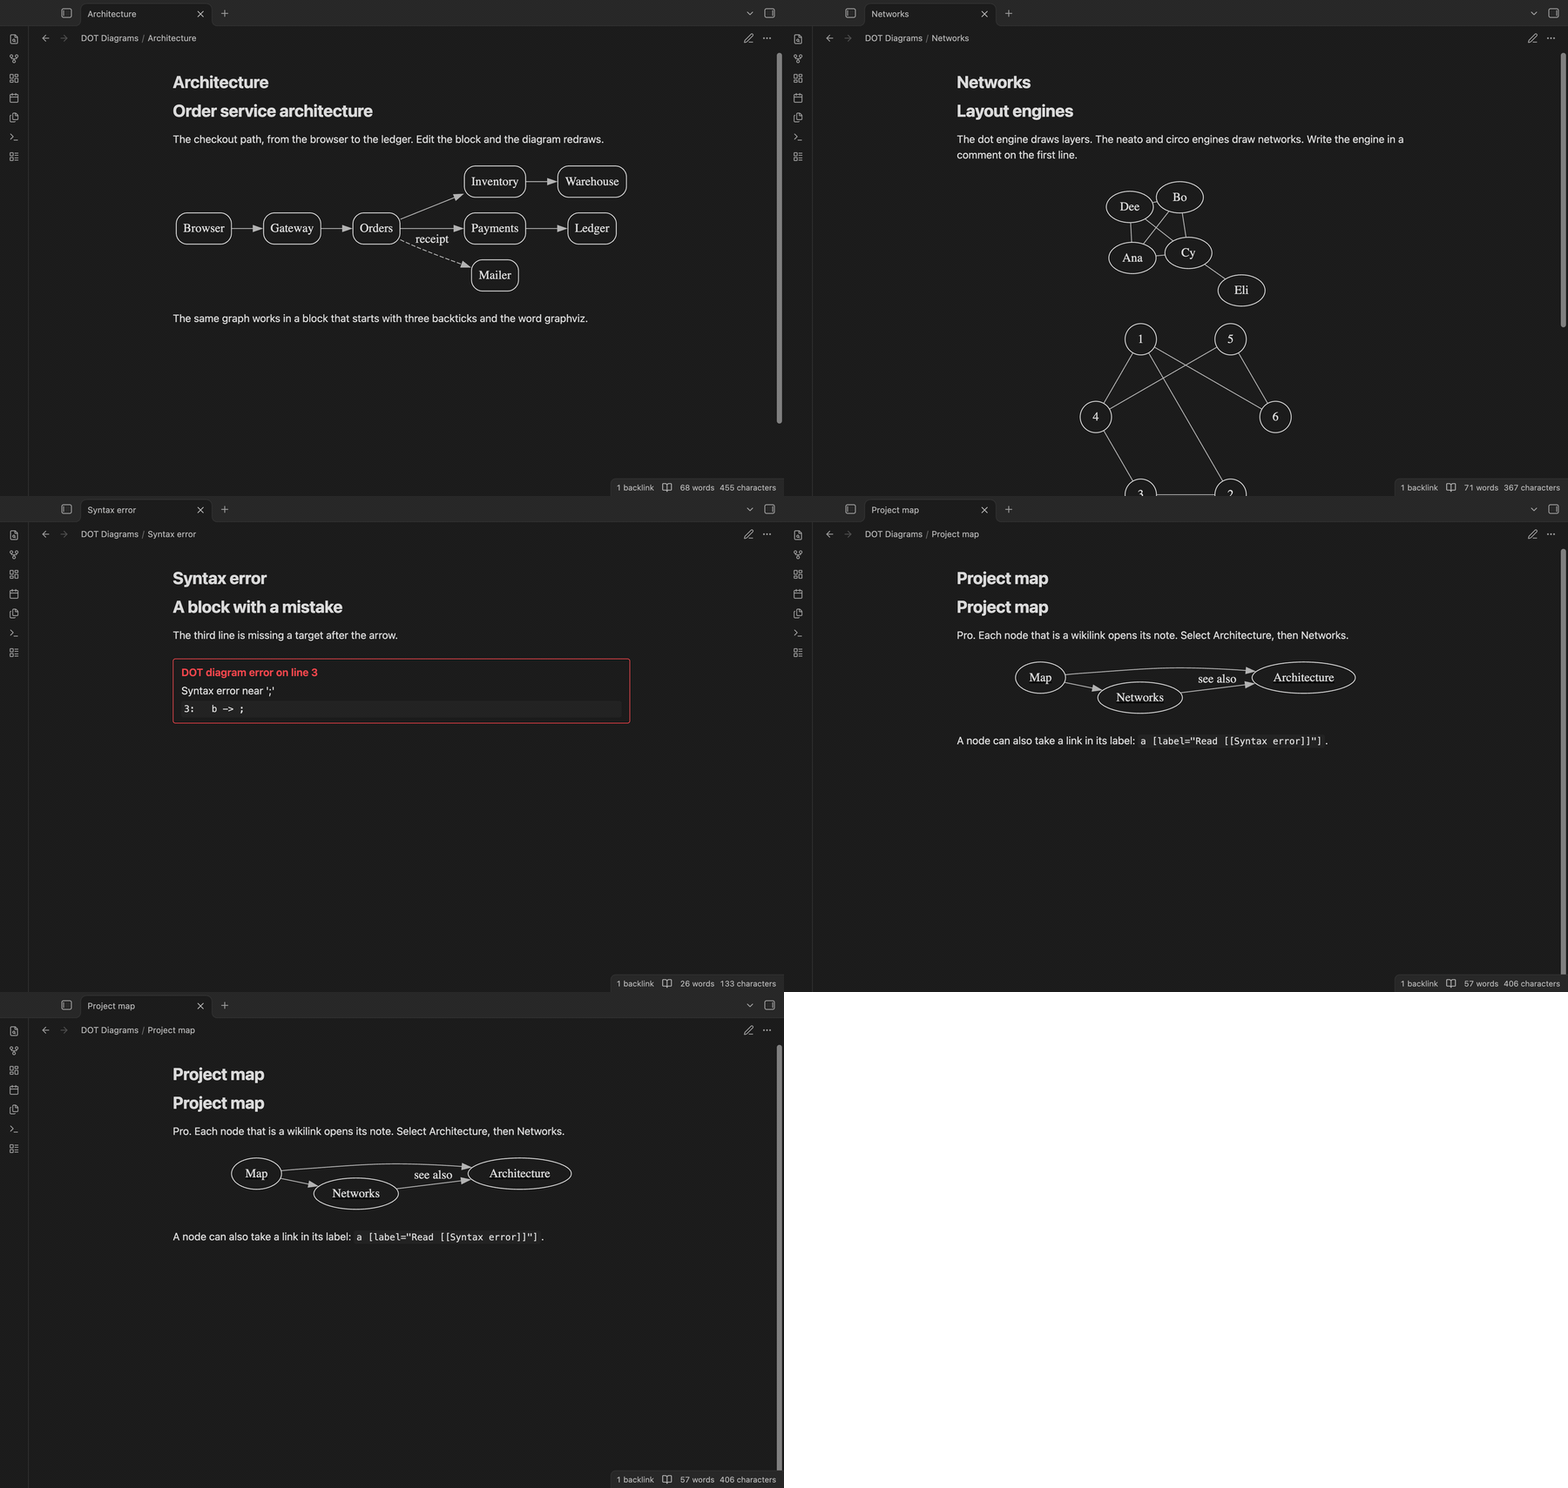
You write a block that starts with three backticks and the word dot or graphviz. DOT Diagrams draws the graph as an SVG in reading view and in Live Preview. The colors follow your theme. If the graph has a mistake, the block shows the line number and the message.
Features
Diagrams in the note
A dot or graphviz block draws as an SVG. It draws again when you edit the block. In Live Preview the block shows the diagram until you move the cursor into it. A button row appears when you hover over a diagram. "Copy" puts the SVG on the clipboard in light colors on white, so you can paste it into a slide.
Colors that follow your theme
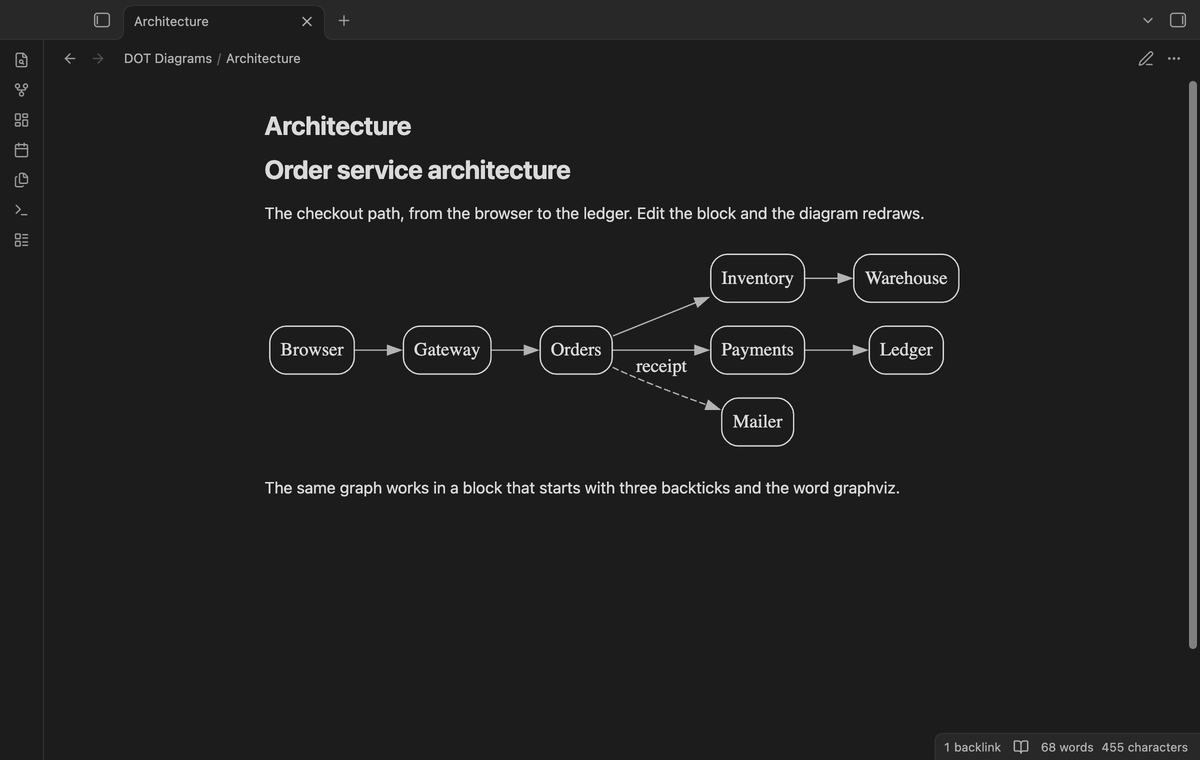
The plugin reads the text, line and fill colors of the current theme and gives them to Graphviz as defaults. The background is transparent. When you change the theme, the open diagrams draw again. Colors that you set in the DOT source, such as color=red, win over the defaults.
Error messages with the line number
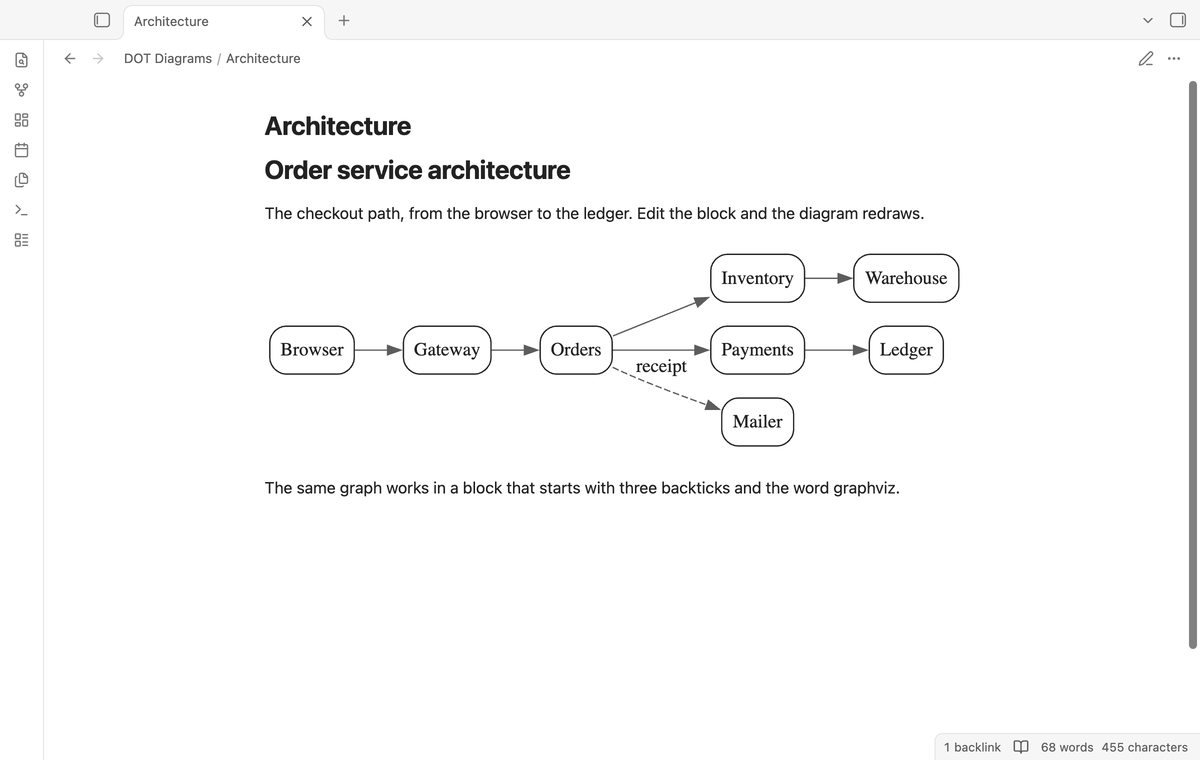
When Graphviz cannot read the block, DOT Diagrams draws nothing and shows a red box. The box gives the line number, the message from Graphviz and the text of that line. The line number is the line of your block. The plugin adds its defaults on the line of the opening brace, so it adds no lines.
Three layout engines
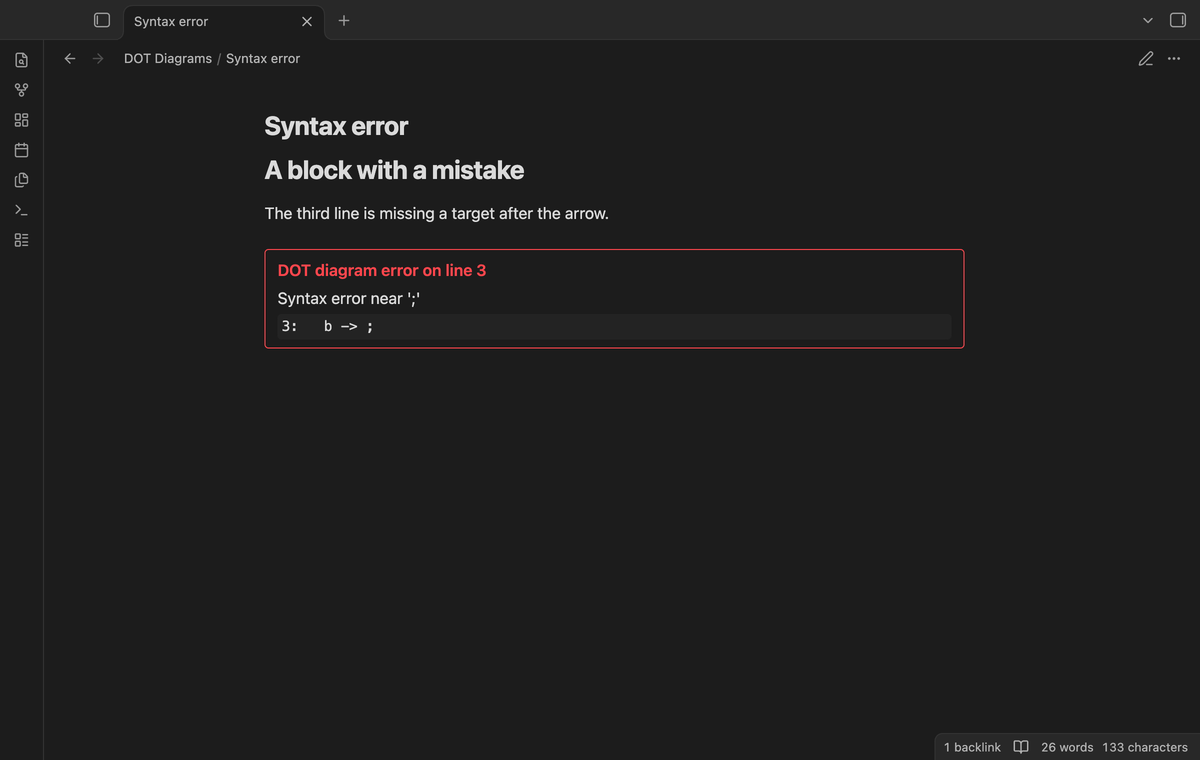
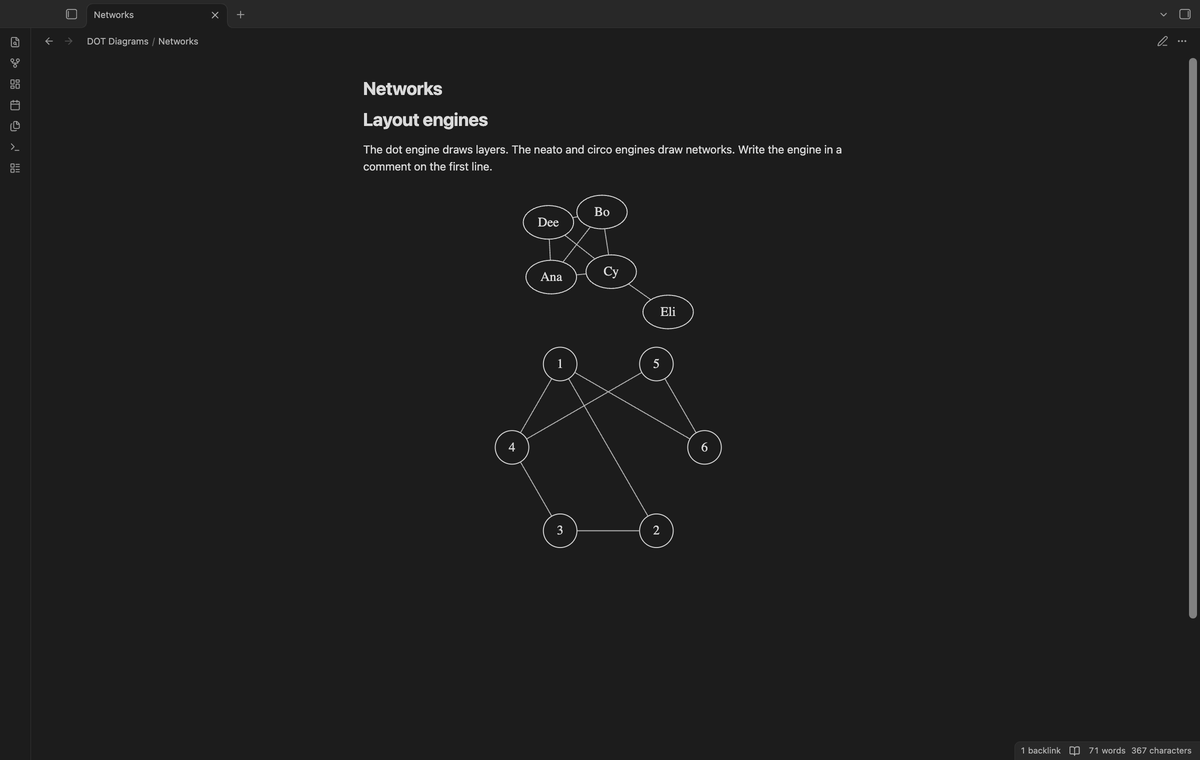
The default engine is dot, which draws layers from top to bottom. Write a comment on its own line to pick another one: // engine: neato draws a spring layout and // engine: circo draws a circle layout. Both are free.
Notes that open from nodes (Pro)
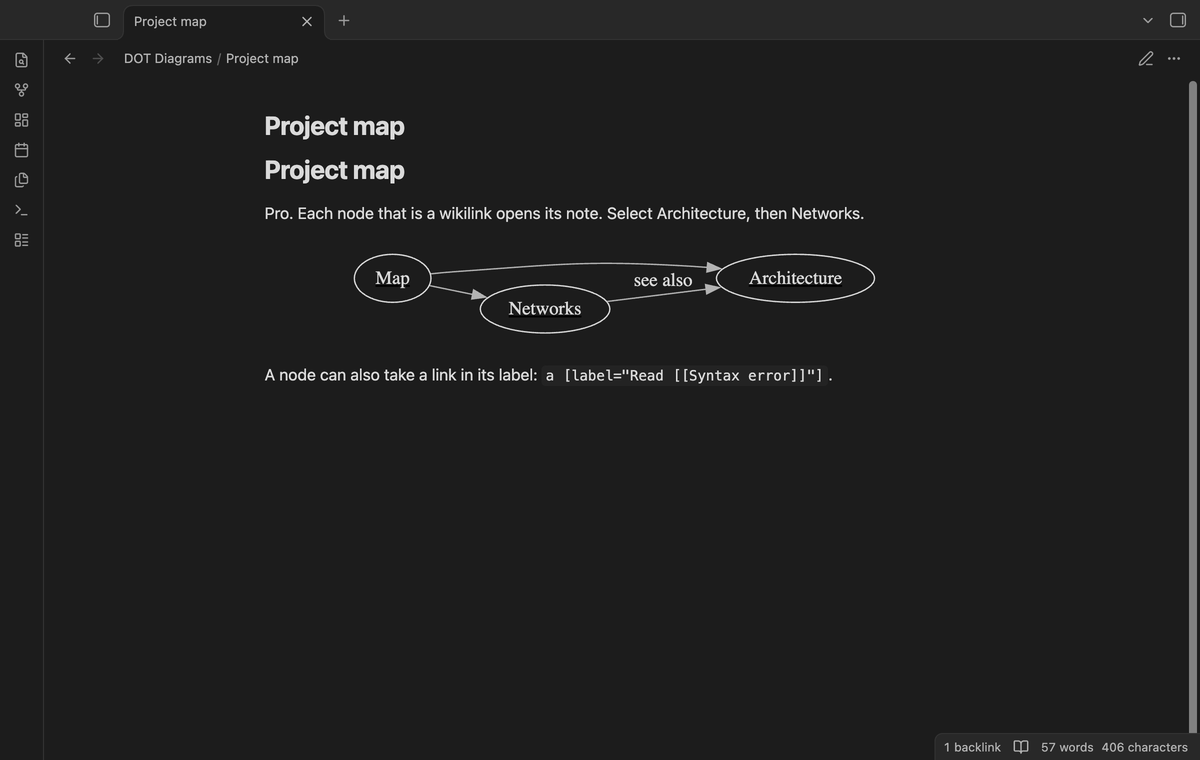
With Pro, a node that is a wikilink opens its note when you select it. Hold Ctrl (Cmd on macOS) to open the note in a new tab. Three forms work: a quoted node id such as "[[Architecture]]" or "[[Notes/Plan|Plan]]", a link in the URL attribute such as URL="[[Architecture]]", and a link in a label such as label="Read [[Syntax error]]". The node shows the note name or the alias. Without Pro, the same nodes show the name as plain text and do nothing.
Export to SVG and PNG (Pro)
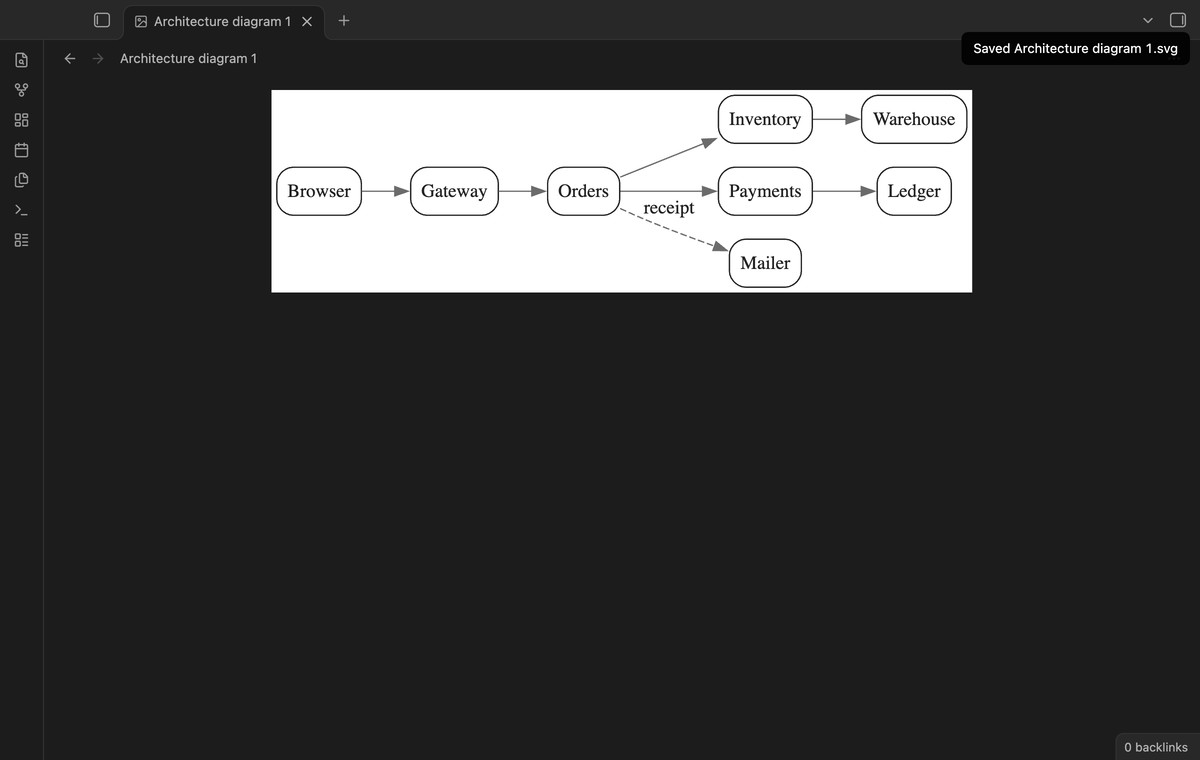
With Pro, the second and third buttons, or the commands "Export the diagram at the cursor to SVG" and "Export the diagram at the cursor to PNG", save the diagram as a file in the attachment folder of the note. The file is light on white and has no note links. The PNG scale is a setting.
More engines and style presets (Pro)
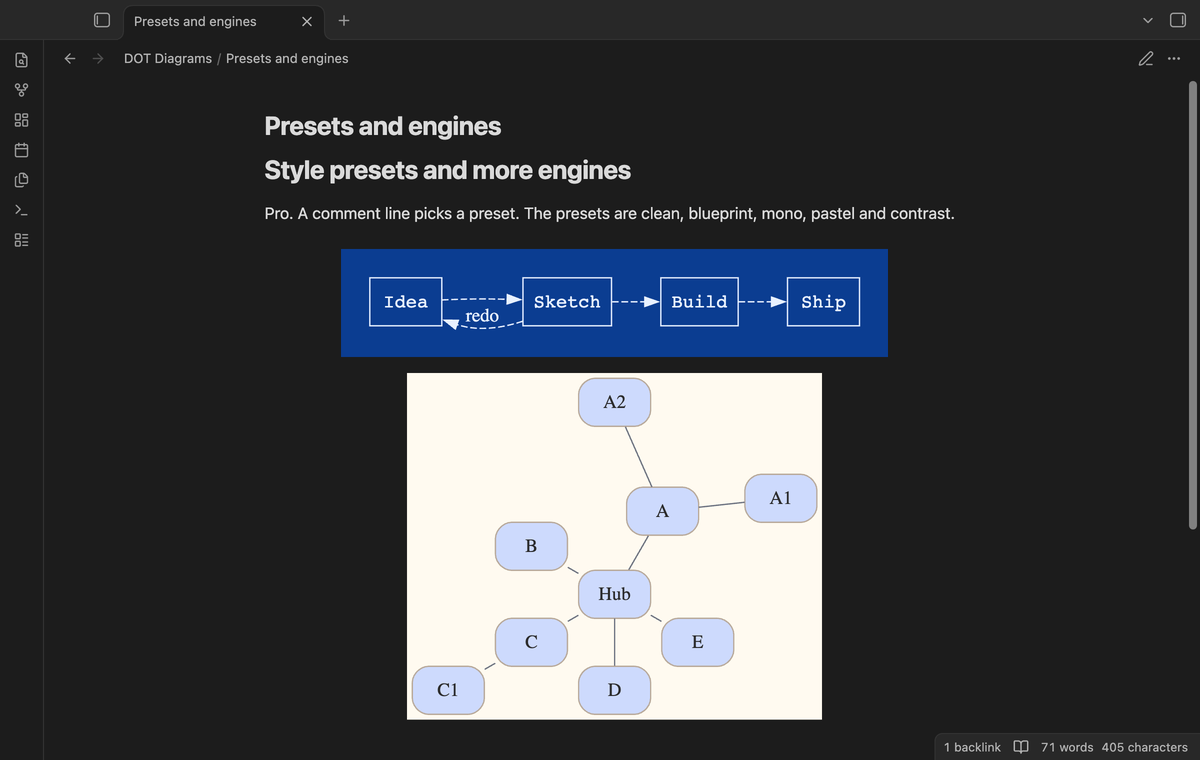
With Pro, fdp, sfdp, twopi and osage also work. A comment such as // preset: blueprint styles one block. The presets are clean, blueprint, mono, pastel and contrast. A preset sets its own colors, so it does not follow the theme. A setting picks a default preset.
Install
- Open "Settings → Community plugins" and turn off restricted mode.
- Select "Browse", search for "DOT Diagrams", then select "Install" and "Enable".
To install by hand, copy main.js, manifest.json and styles.css from the latest release into <vault>/.obsidian/plugins/dot-diagrams/, then enable the plugin. You need Obsidian 1.13.4 or later.
Usage
- Write a fenced block in a note and give it the language
dotorgraphviz. - Write a graph in the DOT language, for example
digraph { a -> b -> c; a -> d }. - Switch to reading view, or move the cursor out of the block in Live Preview.
The first diagram of a session takes a moment longer, because the plugin starts the Graphviz engine then. A diagram that did not change comes from a cache.
Two comment lines set options for one block. Put them on their own lines, anywhere in the block:
// engine: neatochooses the layout engine.// preset: blueprintchooses a style preset (Pro).
A line that starts with # or the form /* engine: circo */ works too. The first line of each kind wins. An unknown name is not an error. The block draws with the default, and a gray note under the diagram says why.
Settings
| Setting | What it does |
|---|---|
| Default layout engine | The engine for blocks without an // engine: line. The default is dot. fdp, sfdp, twopi and osage need Pro. |
| Default style preset | Pro. The preset for blocks without a // preset: line. Empty means the theme colors. |
| Show buttons above diagrams | Shows the Copy, Export SVG and Export PNG buttons when you hover over a diagram. On by default. |
| Edge limit | A block with more edges than this is not drawn. From 50 to 20,000, default 300. |
| PNG export scale | Pro. 1 to 4 pixels for each point of the diagram, default 2. |
The settings tab also has the Pro section: sign in with GitHub, the status line and Refresh.
FAQ
Does my graph leave my device?
No. The renderer is a WebAssembly build of Graphviz inside main.js. A diagram draws on your device with no request. DOT Diagrams also removes <script> elements, event handlers, remote images and javascript: links from the SVG, so a block cannot make your window ask a server for an image.
Why not use Mermaid?
Mermaid is a different language and is built into Obsidian. Use DOT Diagrams when you already have DOT, or when another tool gives you DOT, for example a call graph or a build graph.
How is this different from the Kroki plugin?
The Kroki plugin sends your block to a Kroki server and draws the picture that comes back, so it needs a network or a server that you run. DOT Diagrams draws on your device.
How big is the plugin, and how fast is it?
The plugin file main.js is 0.85 MB. About 0.82 MB of it is the Graphviz engine. The plugin starts the engine only when the first diagram needs it. Layout runs on the main thread, and its cost grows fast with tangled graphs. In a Node test with a tangled graph, 100 edges took 56 ms, 200 edges took 189 ms, 300 edges took 1.8 s and 1,000 edges took 8.7 minutes. So a block with more than 300 edges is not drawn until you raise the limit.
Is the code readable?
main.js is a single minified file, like most plugins. The source is in this repository. The engine is the unmodified distribution file of the Apache-2.0 library @hpcc-js/wasm-graphviz 1.29.1, with two changes that remove its unused network code. The WebAssembly binary sits inside that file as compressed ASCII text, not as base64 and not as a second file. THIRD-PARTY.md lists the licenses and the changes.
Payment, account and network
The core features are free and stay free. Pro features need a GitHub Sponsors sponsorship of theluckystrike: $5 a month or more, or $15 once. When you have paid $15 in total, Pro stays on. Your notes stay readable and editable with or without Pro.
GitHub handles the payment. Sponsor at https://github.com/sponsors/theluckystrike. You need no account for the free features. Pro needs the GitHub account that sponsors.
Until you select "Sign in with GitHub" in the settings, DOT Diagrams makes no network requests. Sign in uses the GitHub device flow. DOT Diagrams sends its public client ID and the scope read:user to https://github.com/login/device/code and shows you a code. While you enter the code at https://github.com/login/device, it asks https://github.com/login/oauth/access_token every few seconds whether sign in is done. The scope read:user is read-only access to your profile, which GitHub needs to show the sponsorship tier. It gives no access to repositories and no write access.
After sign in, DOT Diagrams sends one query to https://api.github.com/graphql: does the signed-in account sponsor theluckystrike, at which tier, and how much it has paid theluckystrike in total. It asks again at most once every 7 days, or when you select Refresh. It sends no note content, file names or other vault data, and it has no telemetry.
Pro keeps working for 14 days without a successful check. The GitHub token stays in the secret storage of Obsidian on this device. It is not written to data.json or other vault files, so it does not sync or reach a git repository. The local storage of this device keeps your GitHub login, the tier and the time of the last check. Sign out deletes the token. You can also revoke the access in your GitHub settings, under Applications.
Support
Report bugs and ask for features in the GitHub issues of this repository. Add your Obsidian version and the DOT text of the block. To support the work, use GitHub Sponsors.