DBML Visualizer
 Mayeenul Islam871 downloads
Renders modified DBML code blocks into interactive Entity Relationship Diagrams (ERDs).
- Overview
- Scorecard
- Updates4
Renders DBML code blocks into interactive ERD diagrams inside Obsidian.
Overview
DBML Visualizer converts dbml fenced code blocks into an interactive, pannable and zoomable ERD (Entity Relationship Diagram). Tables rendered from DBML can be dragged for custom layout; relations are drawn between columns.
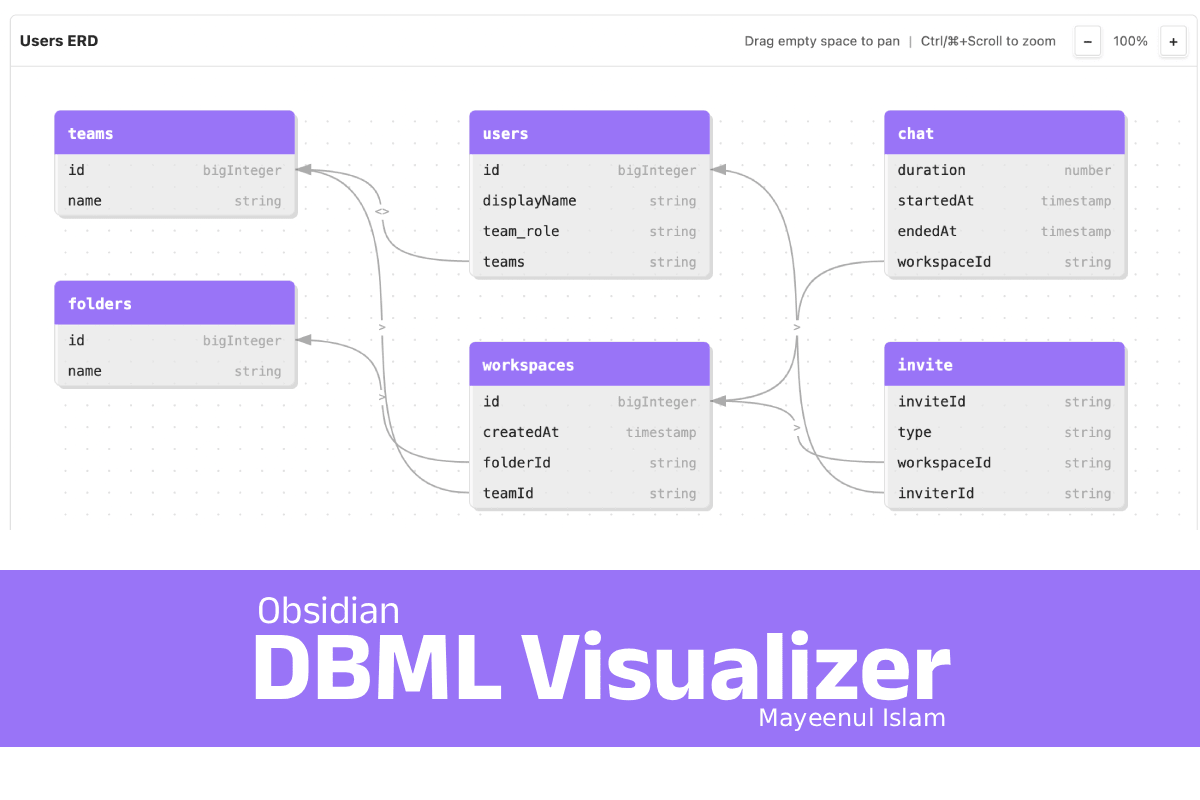
Key features:
- Render
dbml/DBMLcode blocks to SVG ERDs - Automatic layout with link lines and arrowheads
- Pan, zoom, and drag table nodes
- Optional title metadata via code fence info string
Installation
Two ways to install:
Community Plugins (recommended): Install via Obsidian's Community Plugins interface.
Manual (for testing):
- Download
main.jsandmanifest.jsonfrom a GitHub Release. - In your vault, copy the folder to
.obsidian/plugins/obsidian-dbml-visualizer/. - Enable the plugin in Obsidian's Settings → Community plugins.
- Download
Usage
Add a fenced code block with language dbml in a note. Example:
```dbml
Table users {
  id int [pk]
  name varchar
  email varchar
}

Table orders {
  id int [pk]
  user_id int
  total decimal
}

users.id <> orders.user_id
```
or,
```dbml
users {
  id int [pk]
  name varchar
  email varchar
}

orders {
  id int [pk]
  user_id int
  total decimal
}

users.id <> orders.user_id
```
You can pass title in the fence info string:
```dbml title="Customers ERD"
users {
  id int [pk]
  name varchar
  email varchar
}
```
Notes:
- Use
users.id <> orders.user_idstyle relations (supports>,<,<>). - The plugin registers processors for both
dbmlandDBMLfences.
Development
Requirements:
- Node.js (recommended v16+ or v18+)
Common commands (from the plugin root):
npm ci
npm run dev    # build with inline sourcemaps (development)
npm run build  # production build (runs esbuild with 'production' flag)
Built output: main.js (bundle produced by esbuild).
About the author
Mayeenul Islam
https://mayeenulislam.github.io/
The plugin was vibe-coded using free AI models with the knowledge of building BŪNŌN.
BŪNŌN — DBML ER Diagram visualizer
https://mayeenulislam.github.io/bunon/
License
This plugin is licensed under the MIT License — see LICENSE.