
- Overview
- Scorecard
- Updates6
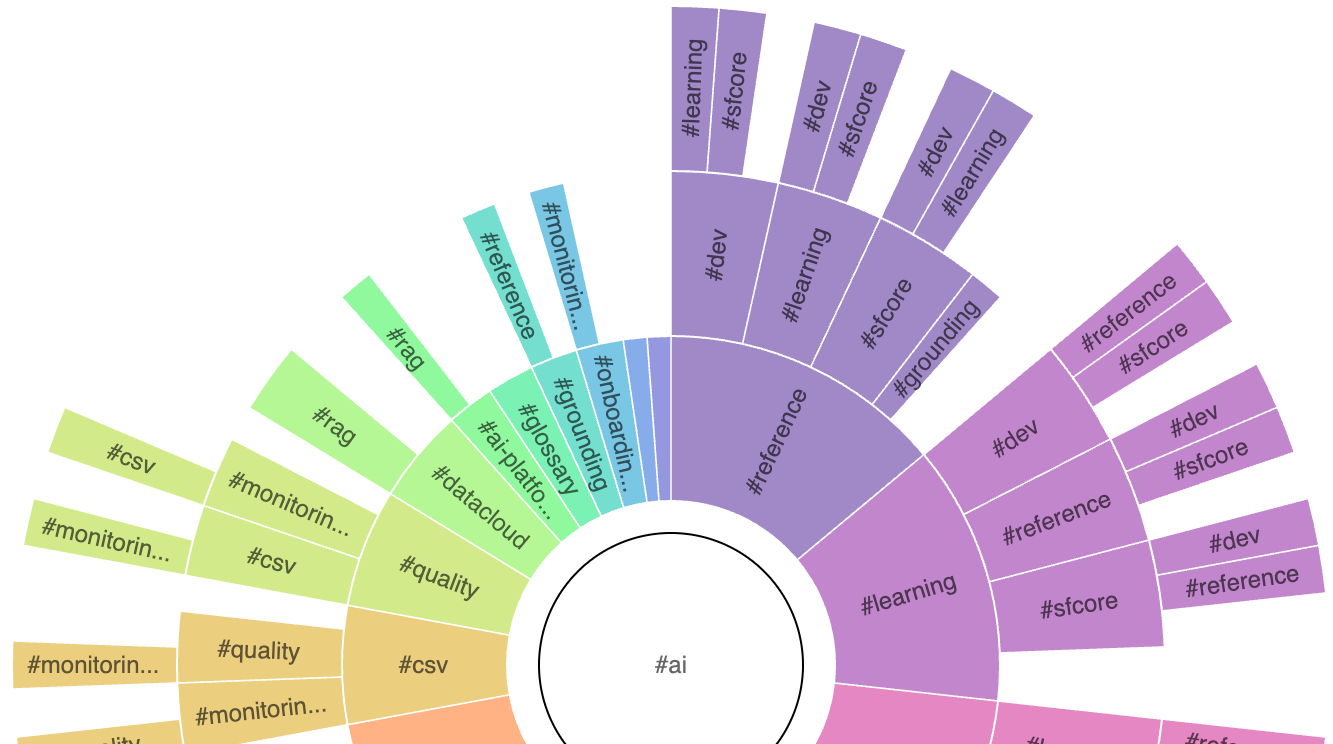
This is a plugin that visualizes the tags in your vault using a sunburst chart. It helps you explore the structure of your tags and their combinations, making it easy to understand how different tags relate to one another.
It is very much a work in progress (including this README) so please stay tuned for updates.
Installation
[!Note]
This plugin requires Dataview
- In Obsidian, open Settings.
- Under Community plugins, select Browse.
- Search for "tagvis" and then select it.
- Select Install.
Prerelease
- Install the BRAT plugin (https://github.com/TfTHacker/obsidian42-brat)
- Click the Add Beta button
- Add this repo (https://github.com/mason-bryant/Obsidian-Tagvis)
Configuration:
Example:
```tagvis
{
    "initialTag": "#ai",
    "maxDepth": 2,
    "ignoreFilesWithTags": ["#foo", "#bar"],
    "filterTags": ["#important"],
    "maxChildren": 15,
    "layout": {
        "width": 800,
        "height": 800
    }
}
```
A single ring of files that are tagged with #work
```tagvis

{
    "initialTag": "#work",
    "maxDepth": 1,
    "ignoreFilesWithTags": ["#archived"],
    "filterTags": [],
    "maxChildren": 25,
    "layout": {
    }
}

```
HealthGood
ReviewNot scanned
About
Visualize tags in your vault as an interactive sunburst chart. Explore tag hierarchies and combinations to reveal relationships and file distribution. Filter by starting tag, depth, and child limits to focus the view.Details
Current version
0.1.5
Last updated
2 years ago
Created
2 years ago
Updates
6 releases
Downloads
1k
Compatible with
Obsidian 0.13.11+
Platforms
Desktop, Mobile
License
MIT