
- Overview
- Scorecard
- Updates7
One plugin for every chart in your vault. Make one from a Bases view, a code block or a script, with less code than other chart plugins need and no second one beside it.
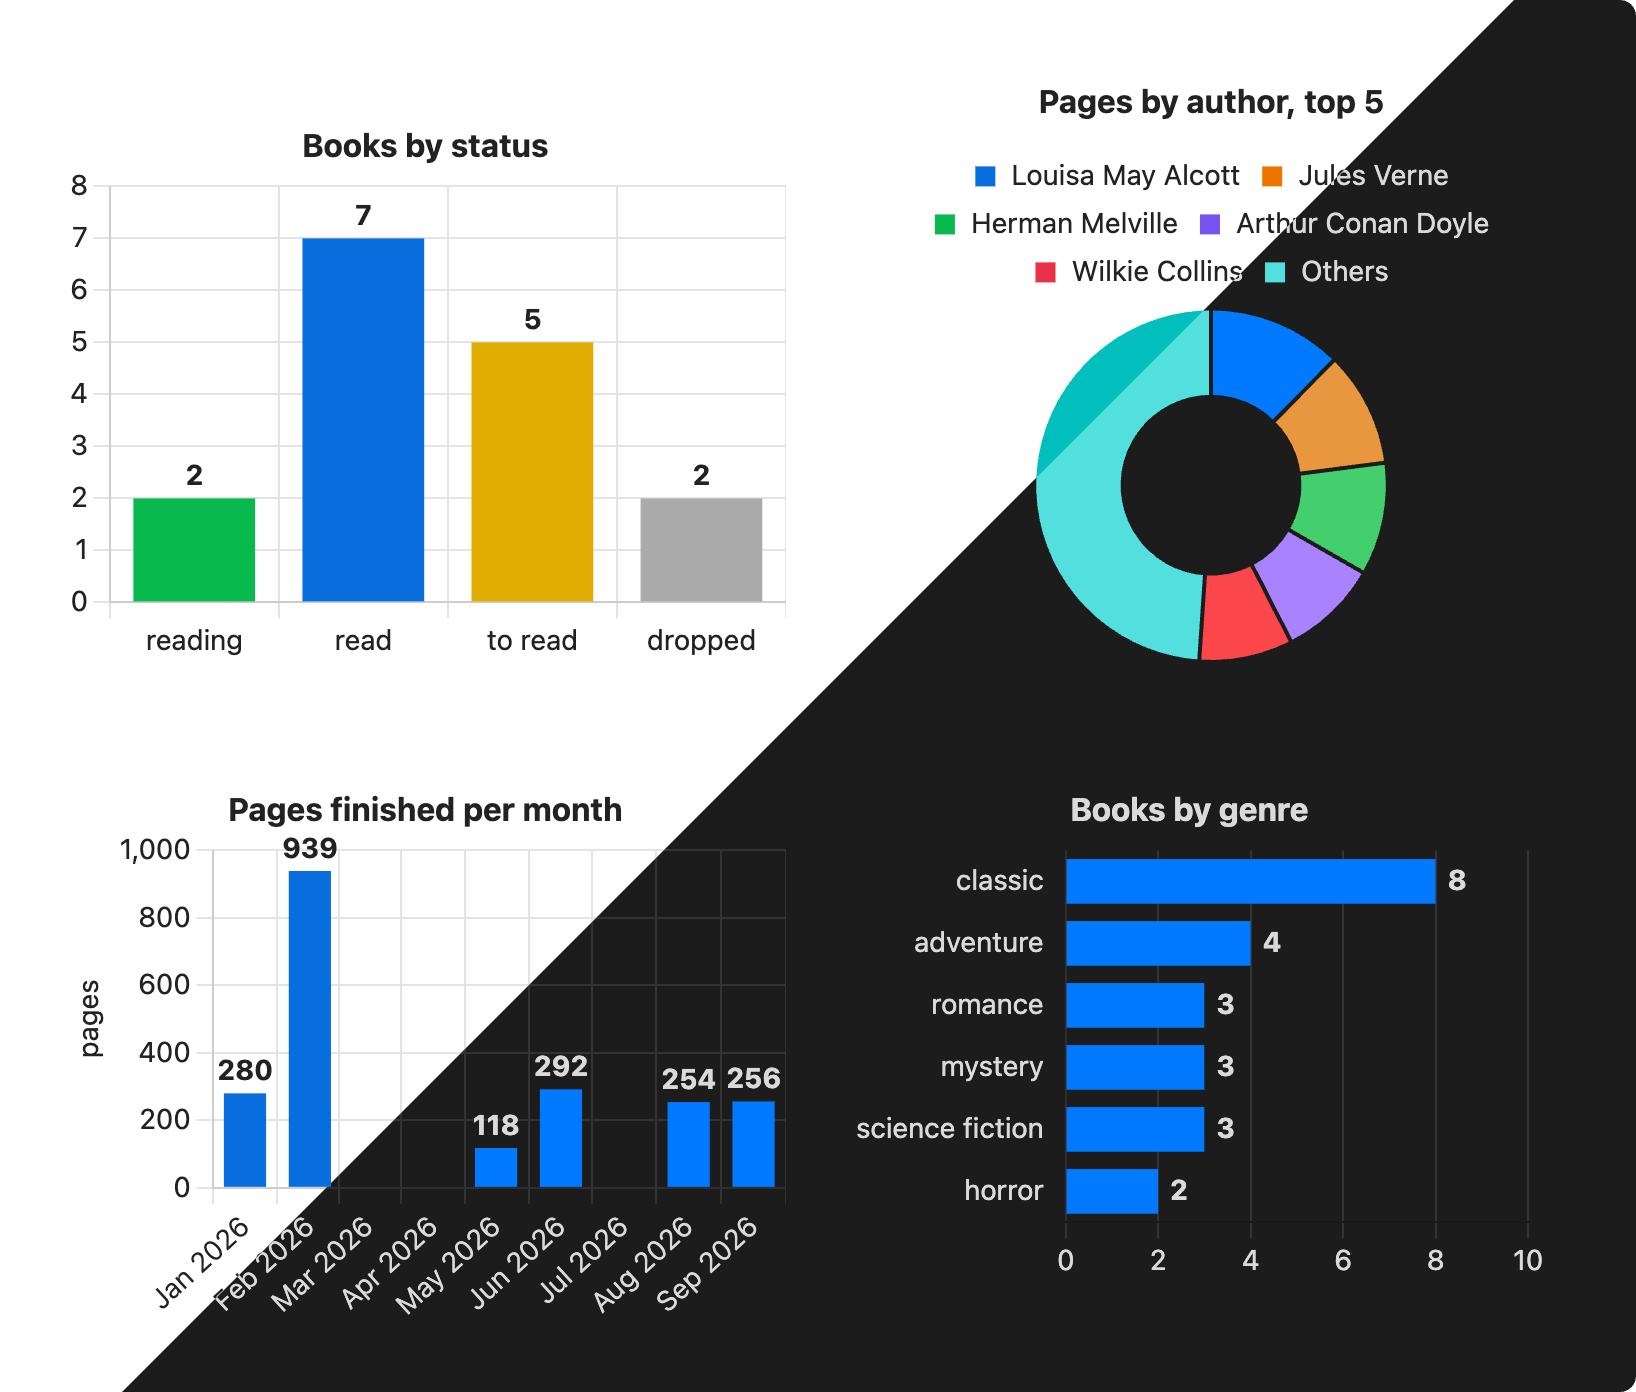
- Sorts by value, keeps the top few and adds up the rest as "Others".
- Plots dates from a Bases view by day, week, month or year, leaving a gap where nothing happened.
- Puts the value on each bar.
- Grows a horizontal bar chart with each bar, so a long list is never squeezed.
- Uses your theme's colors, in light and dark.
Install it from Obsidian's community plugins, or see Installation for manual and beta installs.
Three ways to make a chart
| Way | Use it when | Needs |
|---|---|---|
| Bases view | the numbers are note properties, like books counted by status or hours summed by project | Bases, built into Obsidian |
chart code block |
the numbers are in no note, so you type them in | nothing else |
| Script function | the numbers have to be worked out first, like notes created this month counted by tag | a plugin that runs JavaScript in notes, such as Dataview |
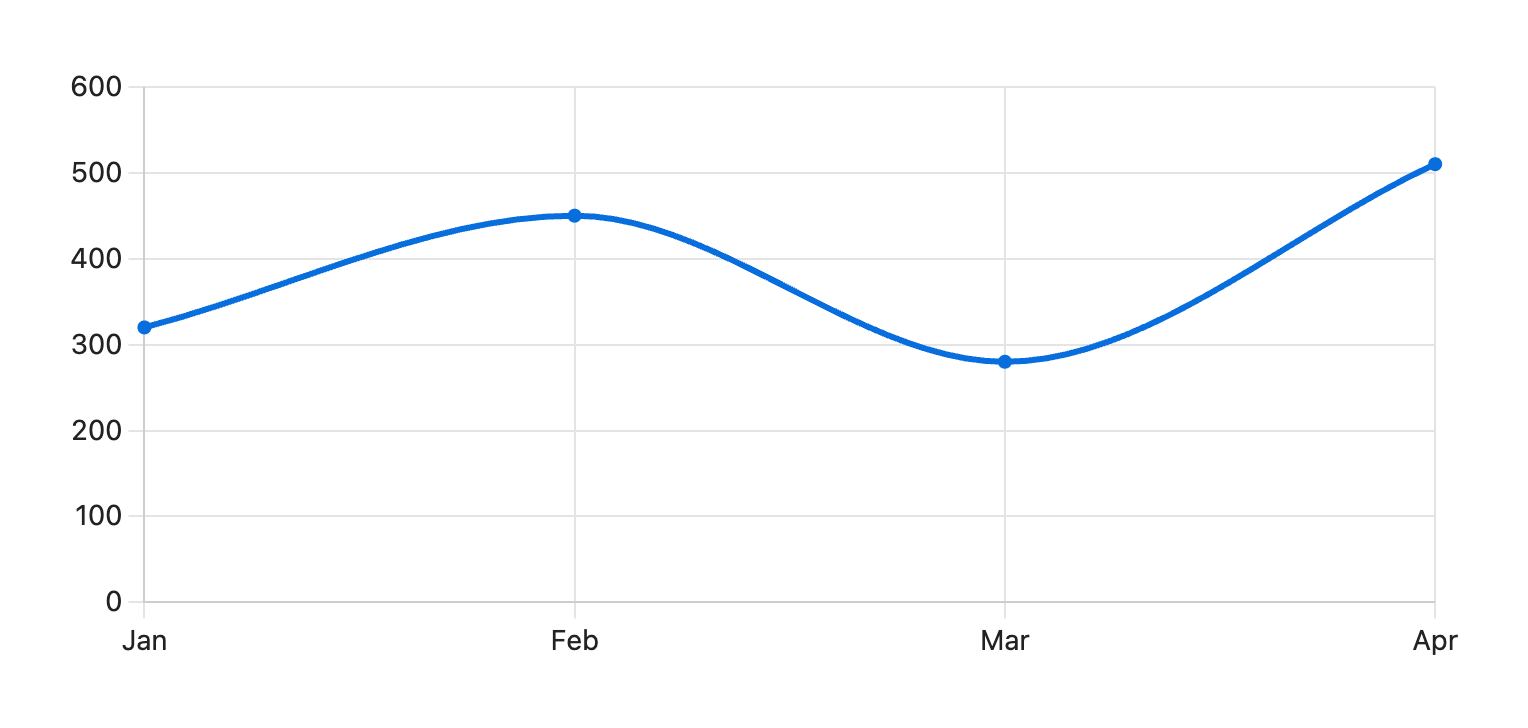
The smallest chart is a code block:
```chart
type: line
labels: [Jan, Feb, Mar, Apr]
series:
  - title: Pages read
    data: [320, 450, 280, 510]
```
A script, before and after
Notes created this month counted by tag, the top 10 as horizontal bars with the count on each, from counts, an object of tag and count. Charts' renderChart leaves the sorting, theme colors, counts on the bars and bar thickness to you. With Chartwork it is one call:
window.chartwork.render(dv.container, {
  kind: "bar",
  horizontal: true,
  labels: Object.keys(counts),
  series: [{ name: "Notes", values: Object.values(counts) }],
  sort: "value",
  topN: 10,
}, dv.component);
The same chart with Charts' renderChart, 45 lines
const top = Object.entries(counts).sort((a, b) => b[1] - a[1]).slice(0, 10);

// renderChart sets no colors, and Chart.js's grey disappears on a dark theme
const css = getComputedStyle(dv.container);
const text = css.getPropertyValue("--text-normal").trim();
const grid = css.getPropertyValue("--background-modifier-border").trim();
const bar = css.getPropertyValue("--interactive-accent").trim();

// Chart.js prints no values on bars by itself
const valueLabels = {
  id: "valueLabels",
  afterDatasetsDraw(chart) {
    const { ctx } = chart;
    ctx.save();
    ctx.font = "bold 12px sans-serif";
    ctx.fillStyle = text;
    ctx.textBaseline = "middle";
    chart.getDatasetMeta(0).data.forEach((el, i) => {
      ctx.fillText(chart.data.datasets[0].data[i], el.x + 6, el.y);
    });
    ctx.restore();
  },
};

window.renderChart({
  type: "bar",
  plugins: [valueLabels],
  data: {
    labels: top.map(([tag]) => tag),
    datasets: [{
      label: "Notes",
      data: top.map(([, n]) => n),
      backgroundColor: bar,
    }],
  },
  options: {
    indexAxis: "y",
    // Without this the bars get thinner as tags are added
    aspectRatio: 600 / (top.length * 28 + 60),
    layout: { padding: { right: 24 } },
    plugins: { legend: { display: false } },
    scales: {
      x: {
        beginAtZero: true,
        ticks: { color: text, precision: 0 },
        grid: { color: grid },
      },
      y: { ticks: { color: text }, grid: { display: false } },
    },
  },
}, dv.container);
Beyond the basics
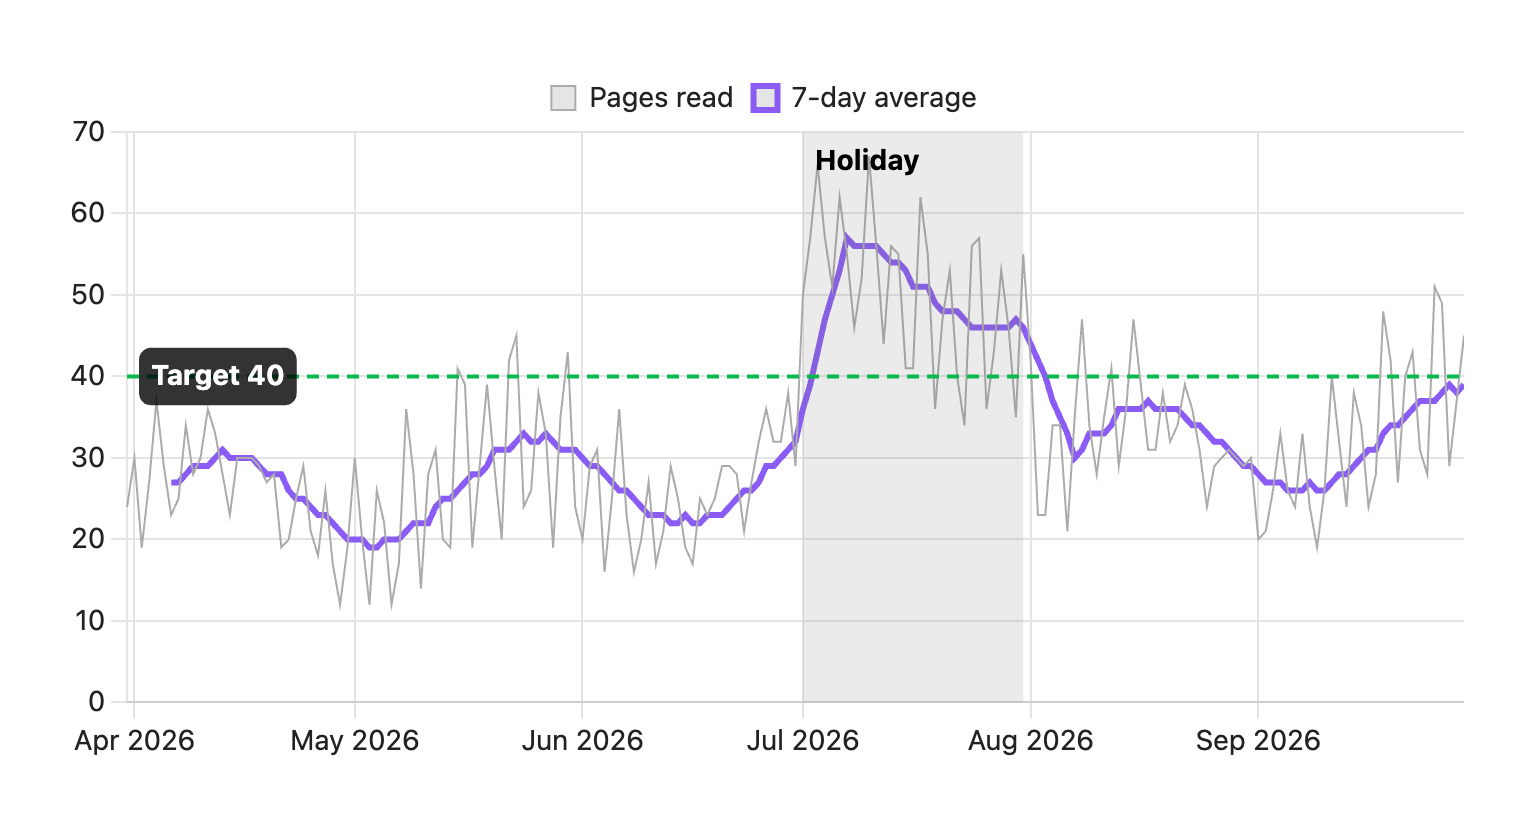
Chartwork runs on Chart.js 4 and bundles time axes, sankey diagrams and annotations for it. A script can pass it a full Chart.js config. This one draws half a year of pages read per day, a 7-day average over it, a shaded holiday and a target line (its script):
More in Beyond the basics.
Switching from another chart plugin
Notes written for Charts work without changes and draw on Chart.js 4, so you no longer need Charts. The Bases view counts notes and adds up values by category or by day, week, month or year. That does the job of Bases Charts and most of what people use Tracker for. Tracker's month calendar and streak summaries, and Charts' chart builder and image export, are not in Chartwork.
What the plugin accesses
- Vault, read-only. Chartwork reads what a Bases view or script hands it, the note or CSV file a
chartblock names, and, for the check command, your notes. It writes nothing to the vault. A Bases view's options are saved into its.basefile by Bases itself. - Clipboard, on request. Copy chart as image puts a PNG of the chart on the clipboard.
- No network. The plugin makes no outbound requests.