Table Dashboard
 dskarbrevik110 downloads
Create dynamic dashboard visualizations from your markdown tables.
- Overview
- Scorecard
- Updates10
Create dynamic dashboard visualizations from your markdown tables. Progress bars, counters, streaks, and more — all powered by your existing data.
Features
- 📊 Multiple Visualizations: Progress bars, counters, percentages, streaks, line plots
- 📁 Flexible Sources: Current file, specific file, or entire folder
- 📋 Table-Powered: Extract and visualize data from markdown tables
- 🏷️ Table Tagging: Filter which tables to scan using HTML comments
- 🎯 Dynamic Goals: Extract goals from table columns
- 📅 Time Periods: Daily, weekly, monthly, yearly, or all-time filtering
- 🎨 Layout Options: Grid or compact-list for multi-widget dashboards
- ➕ Aggregation: Count, sum, average, min, max
- 🛠️ Helpful Errors: Clear guidance and examples when configuration is incorrect
Installation
Manual Installation
- Download
main.js,manifest.json, andstyles.cssfrom releases - Create folder:
<vault>/.obsidian/plugins/table-dashboard/ - Copy files into that folder
- Reload Obsidian and enable the plugin
From Source
cd <vault>/.obsidian/plugins/
git clone <repo-url> table-dashboard
cd table-dashboard
npm install
npm run build
Quick Start
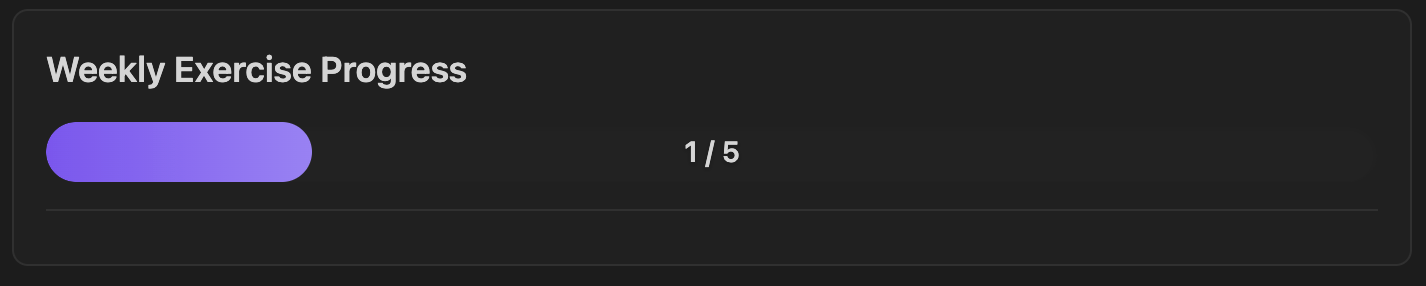
Simple Table Tracker
Visualize data from a table in the current file:
<!-- table-tag: weekly -->

| Activity | Done |
|----------|------|
| Exercise | ✓    |
| Reading  | ✓    |
```table-dashboard
type: progress_bar
source: current-file
tableTag: weekly
keyColumn: Activity
key: Exercise
valueColumn: Done
value: "✓"
goal: 5
label: Weekly Exercise
```
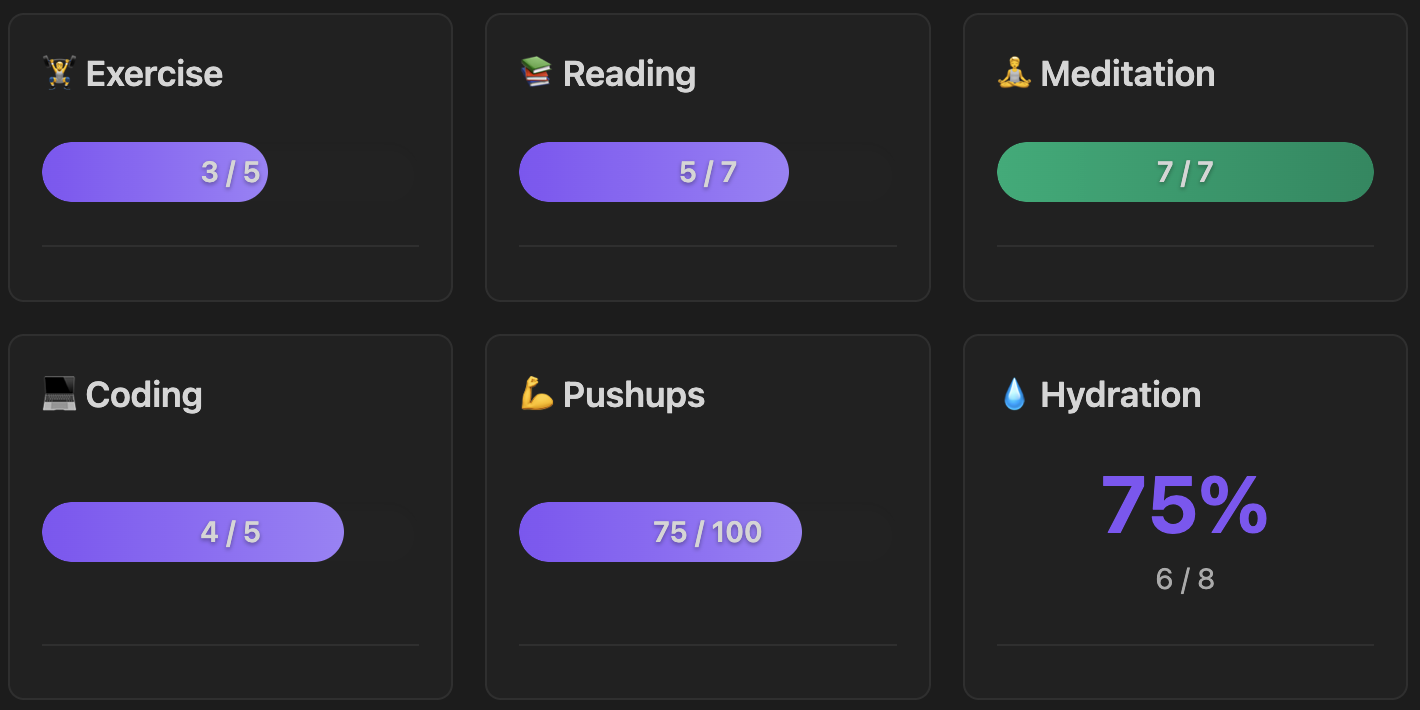
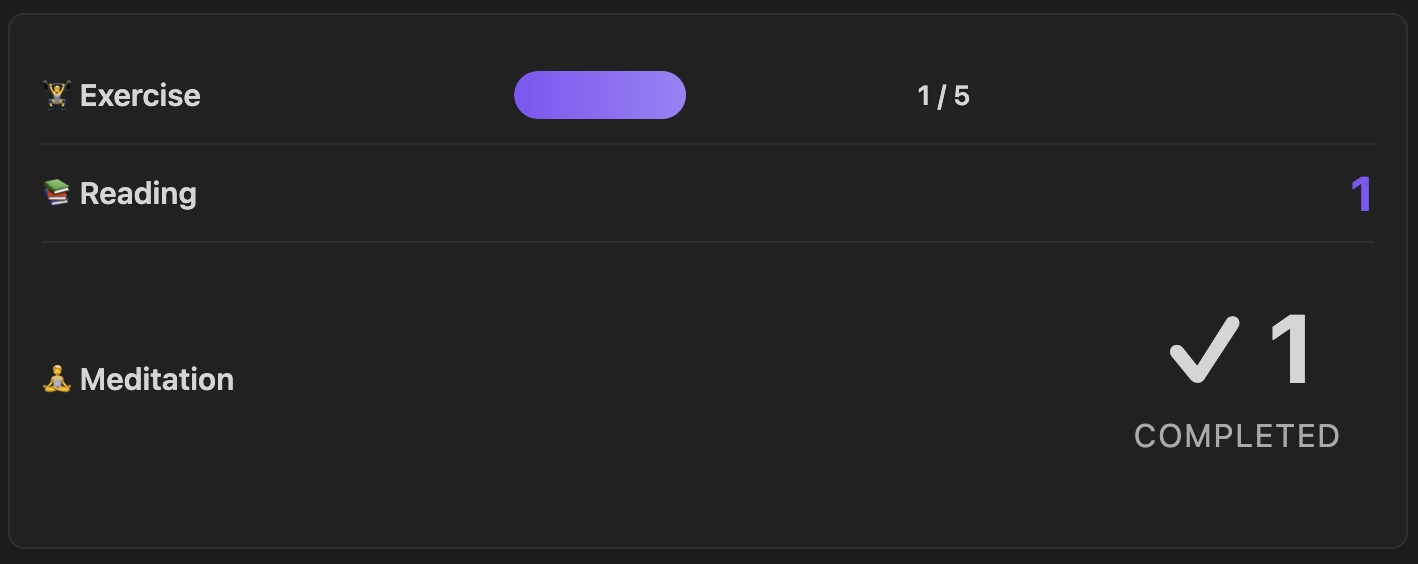
Multi-Widget Dashboard
Multiple trackers in one block with compact layout:
````table-dashboard
layout: compact-list
source: current-file
tableTag: weekly

type: progress_bar
keyColumn: Activity
key: Exercise
valueColumn: Done
value: "✓"
goal: 5
label: 🏋️ Exercise

---

type: counter
keyColumn: Activity
key: Reading
valueColumn: Done
value: "✓"
label: 📚 Reading

---

type: counter
keyColumn: Activity
key: Meditation
valueColumn: Done
value: "✓"
label: 🧘 Meditation
## Source Types
### Current File
Scan tables in the file containing the tracker block:
type: progress_bar
source: current-file
keyColumn: Activity
key: Exercise
valueColumn: Done
value: "✓"
label: Exercise Progress
### Specific File

Scan tables in a specific file (useful for dashboards):
type: progress_bar
source: file:Trackers/Monthly Habits.md
keyColumn: Activity
key: Exercise
valueColumn: Done
value: "✓"
goal: 20
label: Monthly Exercise
### Folder (Pattern Mode)

Scan multiple files in a folder, counting text pattern occurrences:
type: streak
source: folder:Daily Notes
pattern: "- [x] Meditation"
period: monthly
label: Meditation Streak
**Note:** For folder mode, filenames should include dates in `YYYY-MM-DD` format for period filtering and streak calculation.

## Table Mode

### Basic Structure

Tables require a **key column** (to identify rows) and a **value column** (to extract data):

```markdown
| Activity | Done |
|----------|------|
| Exercise | ✓    |
| Reading  | ✓    |
```
type: counter
source: current-file
keyColumn: Activity
key: Exercise
valueColumn: Done
value: "✓"
label: Exercise Count
### Table Tagging

Filter which tables to scan using HTML comment tags:

```markdown
<!-- table-tag: weekly -->

| Activity | Done |
|----------|------|
| Exercise | ✓    |

<!-- table-tag: monthly -->

| Activity | Done |
|----------|------|
| Project  | ✓    |
```
type: counter
source: current-file
tableTag: weekly
keyColumn: Activity
key: Exercise
valueColumn: Done
value: "✓"
label: Weekly Exercise
### Value Types

**Text matching** - count cells containing specific text:
```yaml
value: "✓"          # Match checkmark
value: "done"       # Match "done"
value: "yes"        # Match "yes"
```

**Numeric** - extract and aggregate numbers:
```yaml
value: numeric
aggregate: sum      # Sum all numbers
```

**Any** - count any non-empty cell:
```yaml
value: any
```

### Numeric Values

Sum numeric values from a table:

```markdown
<!-- table-tag: reps -->

| Activity | Reps |
|----------|------|
| Pushups  | 25   |
| Situps   | 30   |
```
type: counter
source: current-file
tableTag: reps
keyColumn: Activity
key: Pushups
valueColumn: Reps
value: numeric
aggregate: sum
label: Total Pushups
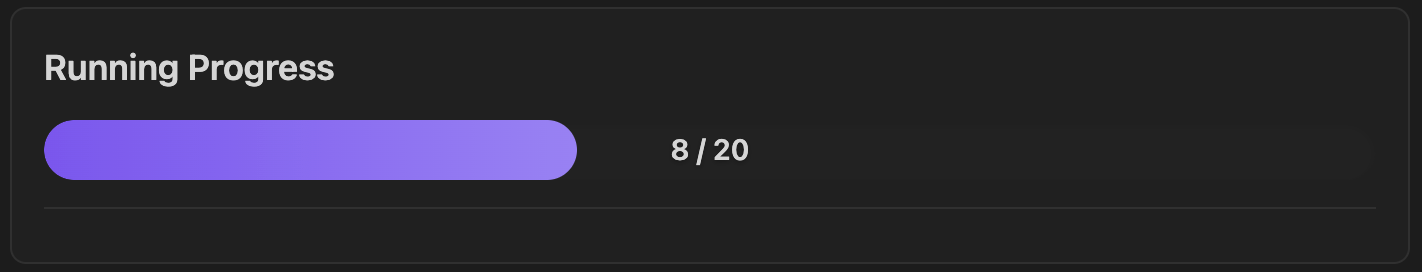
### Dynamic Goals

Extract goals from a table column:

```markdown
<!-- table-tag: goals -->

| Activity | Current | Goal |
|----------|---------|------|
| Running  | 8       | 20   |
```

```table-dashboard
type: progress_bar
source: current-file
tableTag: goals
keyColumn: Activity
key: Running
valueColumn: Current
value: numeric
aggregate: sum
goalColumn: Goal
label: Running Progress
```
Visualization Types
| Type | Description | Best For |
|---|---|---|
progress_bar |
Visual bar showing progress toward goal | Goal tracking |
counter |
Simple count display | Totals |
percentage |
Percentage of goal completed | Completion rates |
streak |
Consecutive days (folder mode) or count | Habit streaks |
line_plot |
Trend chart over time (folder mode) | Trends |
Layouts
Grid Layout (Default)
```table-dashboard
layout: grid
gridColumns: 2
source: current-file
tableTag: weekly

type: progress_bar
keyColumn: Activity
key: Exercise
valueColumn: Done
value: "✓"
goal: 5
label: Exercise

---

type: counter
keyColumn: Activity
key: Reading
valueColumn: Done
value: "✓"
label: Reading
```
Compact List
```table-dashboard
layout: compact-list
source: current-file
tableTag: weekly

type: progress_bar
keyColumn: Activity
key: Exercise
valueColumn: Done
value: "✓"
goal: 5
label: Exercise

---

type: progress_bar
keyColumn: Activity
key: Reading
valueColumn: Done
value: "✓"
goal: 3
label: Reading
```
Configuration Reference
Required Parameters
| Parameter | Description |
|---|---|
type |
Visualization: progress_bar, counter, percentage, streak, line_plot |
source |
Where to scan: current-file, file:<path>, or folder:<path> |
Table Mode Parameters
| Parameter | Required | Description |
|---|---|---|
keyColumn |
✅ | Column containing row identifiers |
valueColumn |
✅ | Column to read values from |
value |
✅ | What to match: numeric, any, or exact text like "✓" |
key |
❌ | Filter to rows containing this value in keyColumn |
tableTag |
❌ | Filter to tables with this HTML comment tag |
goalColumn |
❌ | Column to extract dynamic goal from |
aggregate |
❌ | How to combine values: count (default), sum, average, max, min |
Pattern Mode Parameters
| Parameter | Required | Description |
|---|---|---|
pattern |
✅ | Text to search for in file content |
useRegex |
❌ | Enable regex matching (default: false) |
Common Optional Parameters
| Parameter | Description |
|---|---|
goal |
Static goal number |
label |
Display label |
period |
Time filter (folder mode): daily, weekly, monthly, yearly, all-time |
Block-Level Parameters
Apply to entire dashboard (before first type:):
| Parameter | Description |
|---|---|
layout |
grid (default) or compact-list |
gridColumns |
Number of columns for grid layout |
source |
Default source for all widgets |
tableTag |
Default table tag for all widgets |
Examples
See examples/widget-screenshot-demo.md for ready-to-use templates.
Error Handling
When you misconfigure a widget, the plugin displays helpful error messages with guidance on how to fix the issue.
Example: Missing required fields
```table-dashboard
type: counter
source: current-file
keyColumn: Activity
```
This configuration is missing valueColumn and value, which are required for table mode. Instead of a cryptic error, you'll see:
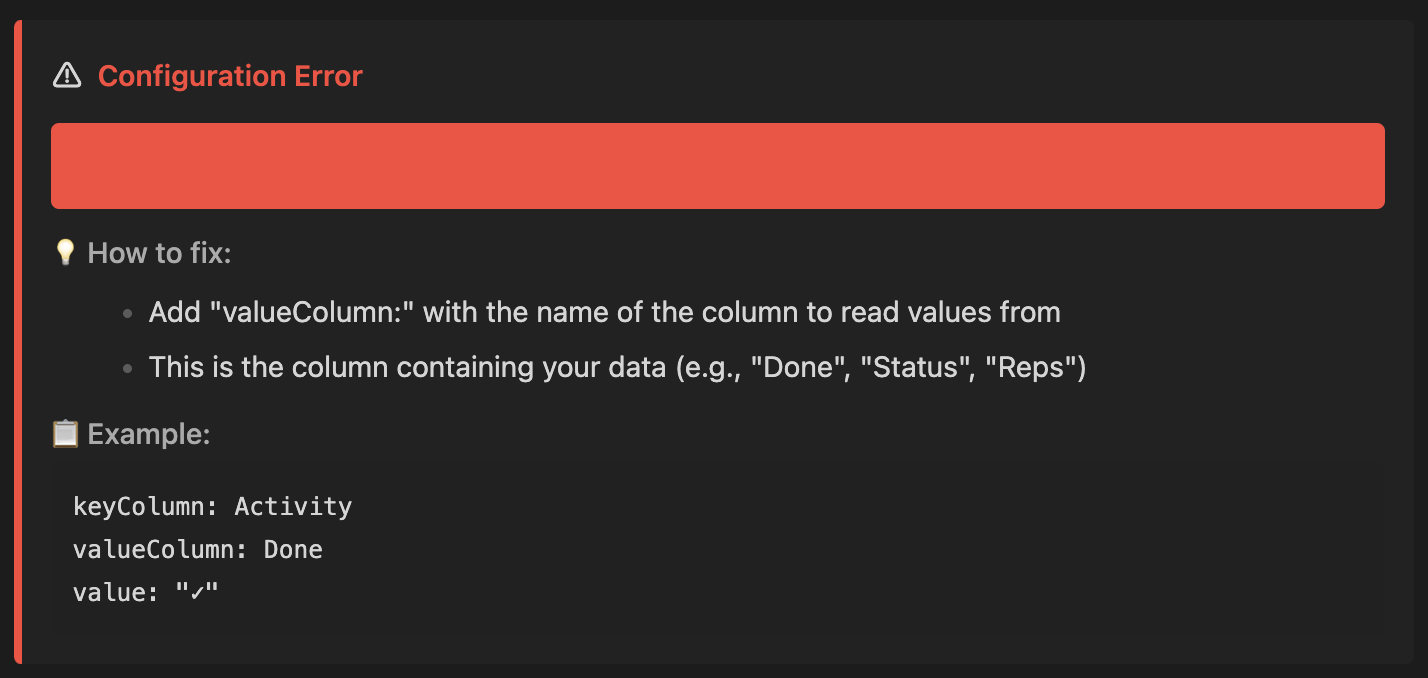
The error display includes:
- ⚠️ Clear description of what's wrong
- 💡 Step-by-step guidance on how to fix it
- 📋 Example code snippet showing correct syntax
Troubleshooting
Tracker shows 0:
- Verify
keyColumnmatches your table header exactly (case-insensitive) - Check that
keyvalue exists in your table - For
tableTag: ensure the HTML comment is above the table - Check
valuematches what's in your cells
Streak shows 0:
- Streaks require folder mode with date-named files (YYYY-MM-DD)
- For current-file mode, streak shows the count instead
Doesn't update:
- Trackers update on file save
- Reload Obsidian (Cmd+R / Ctrl+R) if stuck
Period filtering not working:
- Only works with
source: folder:... - Filenames must include dates in YYYY-MM-DD format
Development
npm install
npm run dev          # Watch mode
npm run build        # Production
npm test             # Run tests
License
MIT License - see LICENSE file for details.