Mandala Chart
 Gurio144 downloads
Interactive 9×9 Mandala Chart for structured goal planning — inspired by Shohei Ohtani's method. Supports markdown, 5 languages, and print export.
- Overview
- Scorecard
- Updates4
An interactive Mandala Chart plugin for Obsidian — the 9×9 goal-planning framework popularized by baseball star Shohei Ohtani.
Languages / 言語: 🇯🇵 日本語 · 🇺🇸 English · 🇨🇳 中文 · 🇰🇷 한국어 · 🇪🇸 Español
(Auto-detected from your Obsidian language setting)
What is a Mandala Chart?
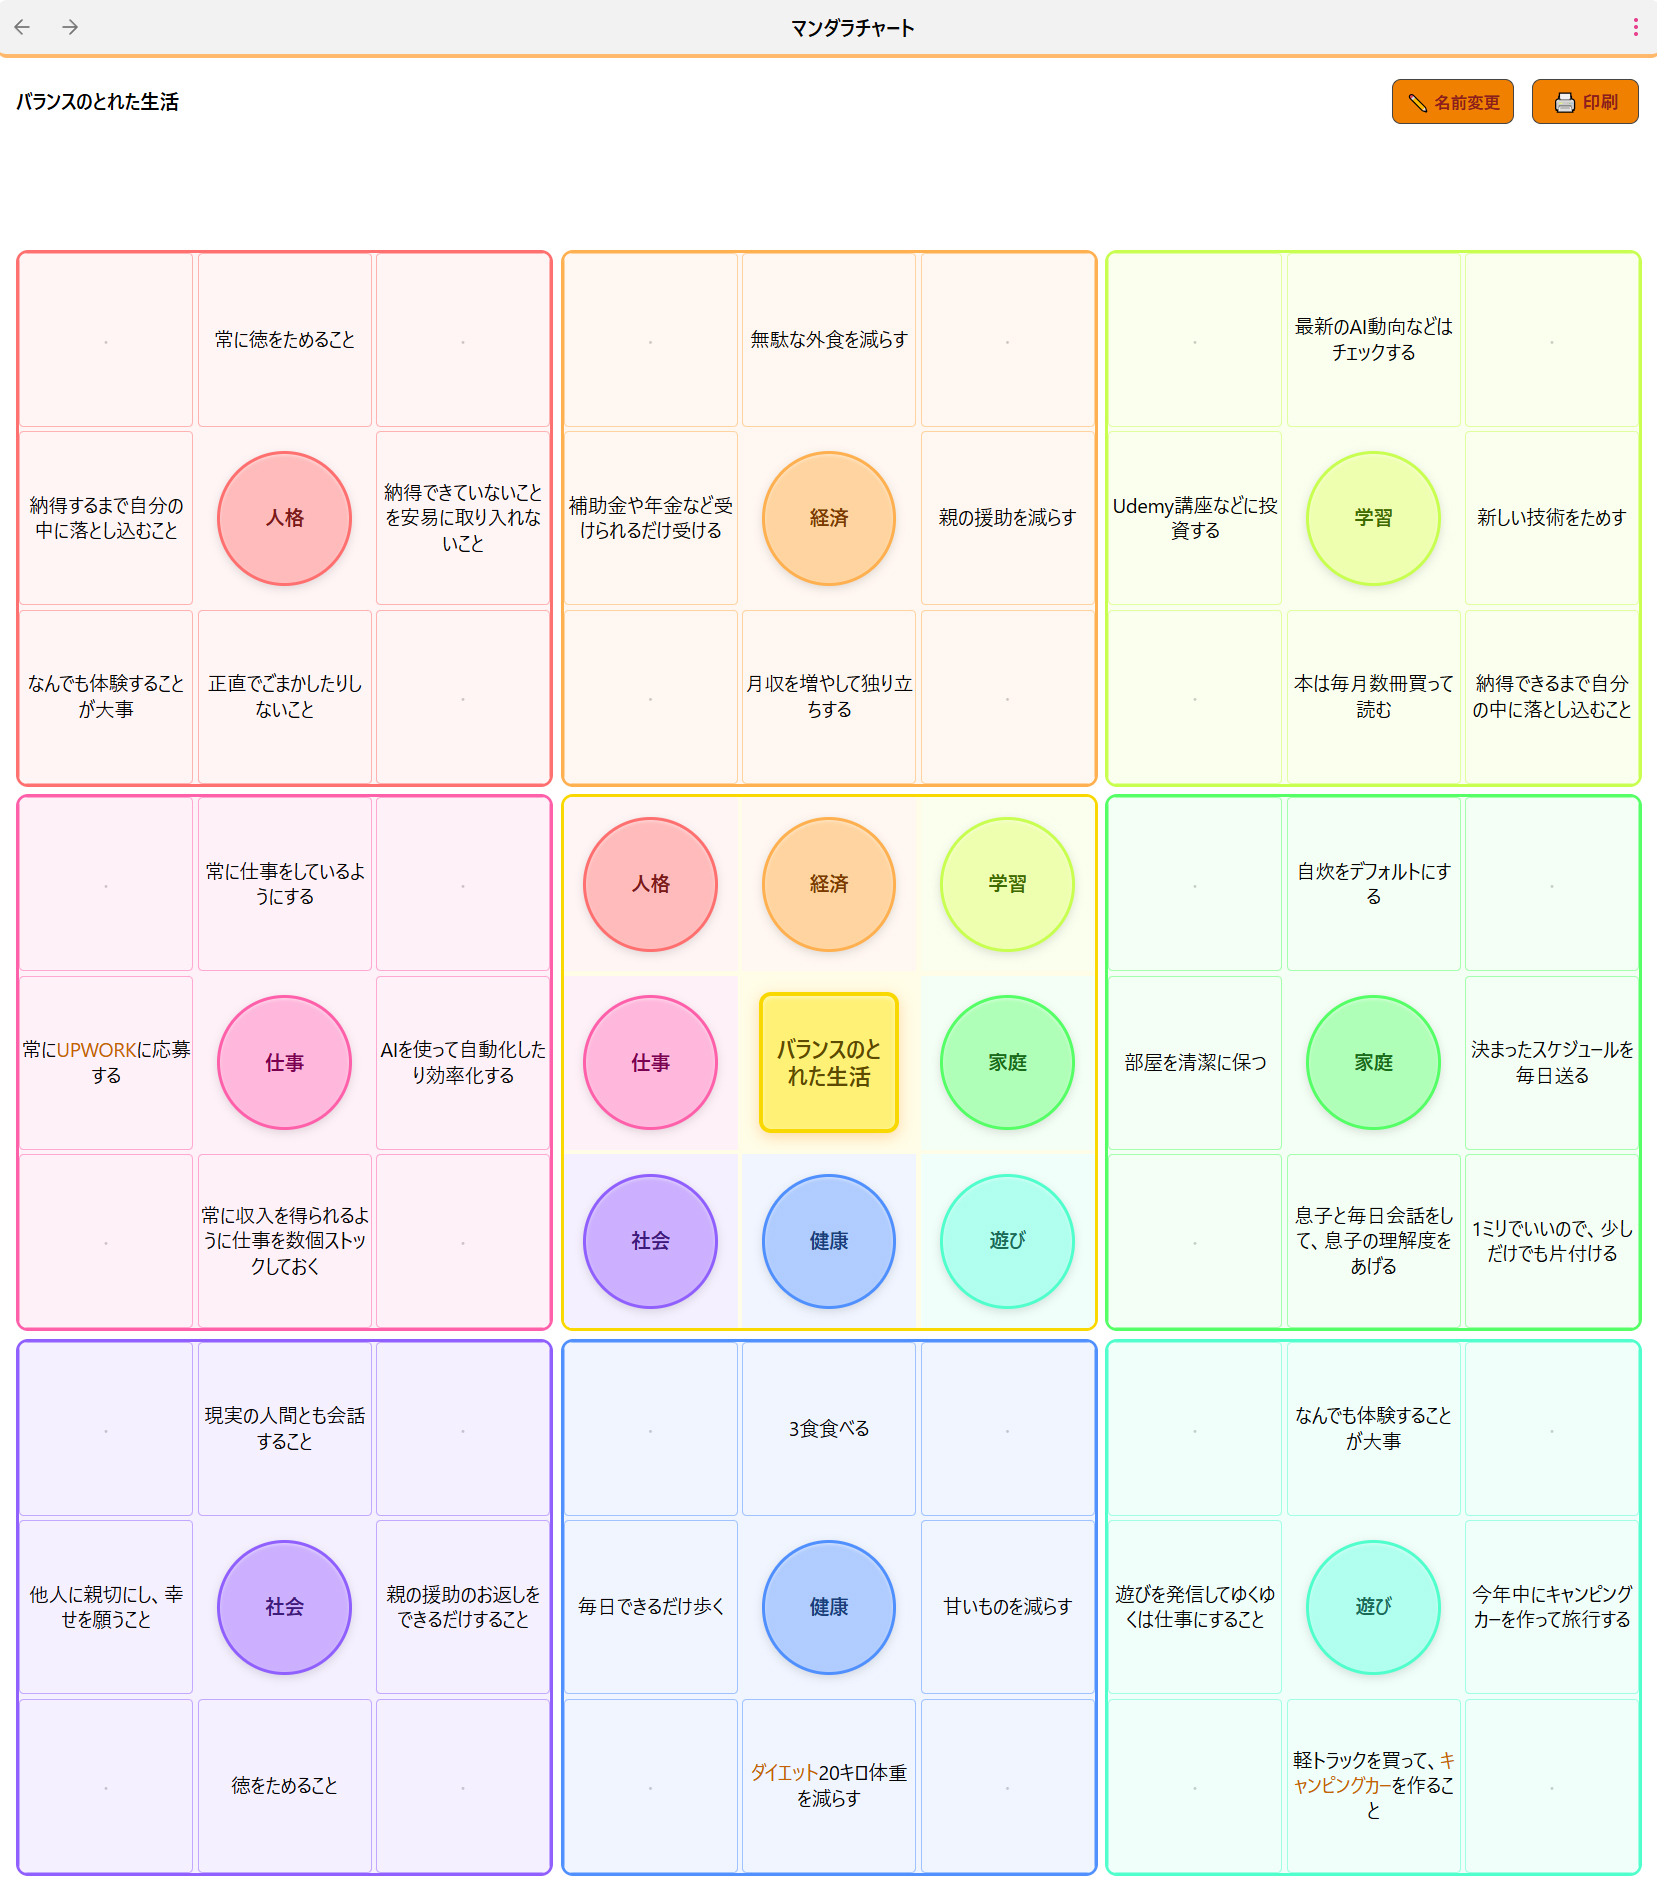
A Mandala Chart is a 9×9 grid used for structured goal planning. You place your main goal in the center, surround it with 8 key themes, and then expand each theme into 8 supporting ideas — giving you 64 action items at a glance.
Screenshots
Overview — 9×9 全体表示
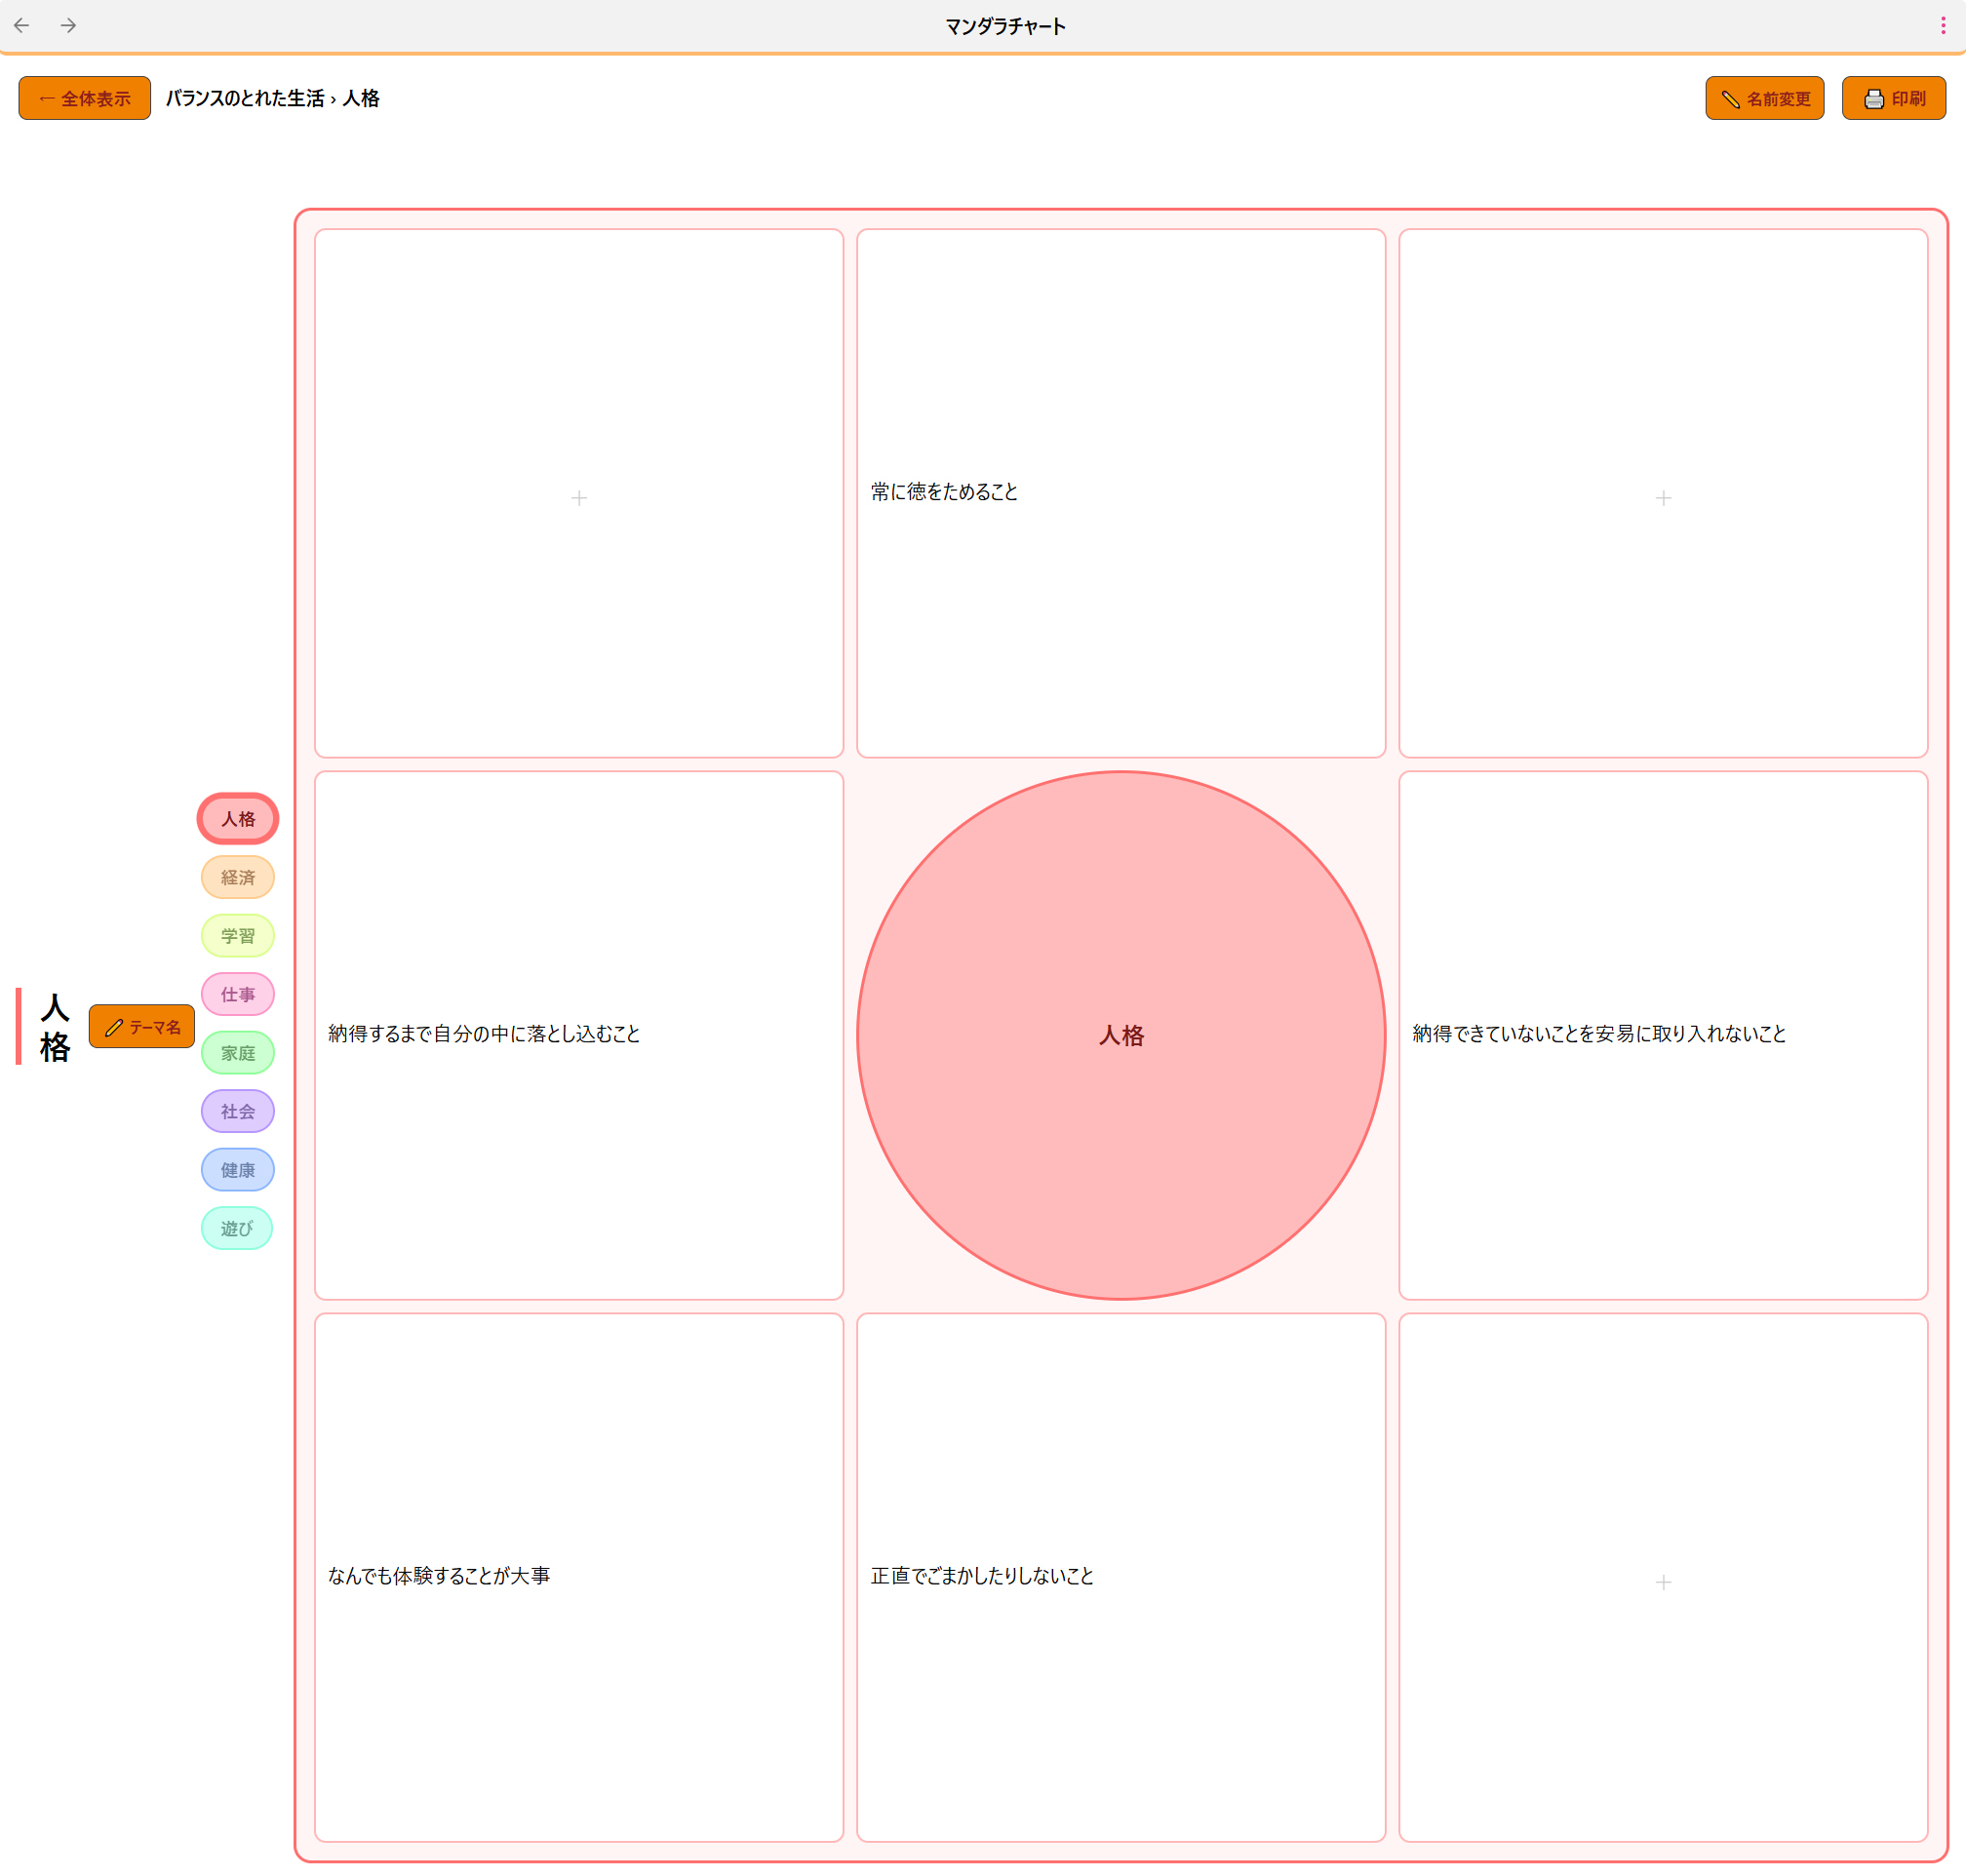
Focus Mode — テーマフォーカスモード
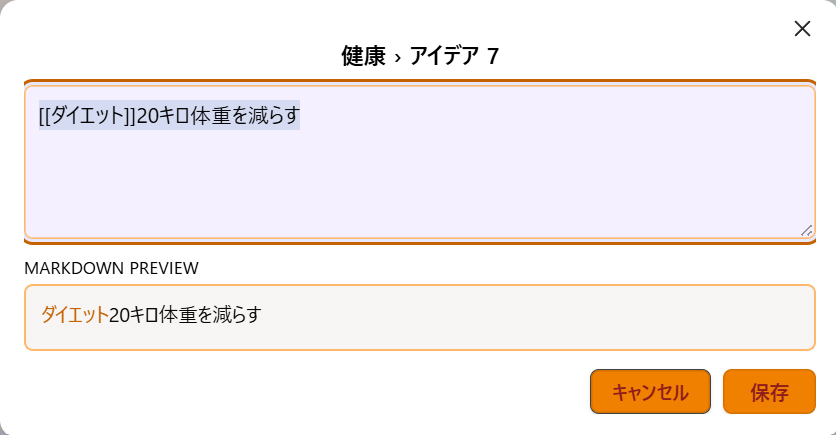
Edit Dialog — Markdown ライブプレビュー付き編集
Features
- 🎯 Interactive 9×9 grid — click any cell to edit inline
- 🔍 Two view modes — full overview and focus mode for each theme
- 🌈 Rainbow pastel colors — 8 themes colored clockwise in rainbow order
- ⭕ Circle design — all theme labels rendered as circles
- ✍️ Markdown support — use
#tags,[[links]],**bold**in any cell - ⊞ Open full view — transfer any embedded chart to the full-screen tab with one click
- 🖨 Print-ready — exports a clean A4 landscape page
- 🌐 5 languages — Japanese, English, Chinese, Korean, Spanish
- 📌 Ribbon icon — one-click access from the left sidebar
- 📝 Code block embed — embed charts directly in any note
- 💾 Auto-save — changes saved instantly
Installation
Community Plugin (Recommended)
- Open Obsidian → Settings → Community Plugins
- Disable Safe Mode if needed
- Click Browse and search for "Mandala Chart"
- Click Install, then Enable
Manual Installation
- Download the latest release
- Extract to your vault's
.obsidian/plugins/mandala-chart/folder - Enable the plugin in Settings → Community Plugins
BRAT (Beta)
https://github.com/gurio318/obsidian-mandala-chart
Usage
Method 1: Ribbon Icon
Click the ⊞ grid icon in the left sidebar to open a dedicated Mandala Chart tab. Your data is saved automatically between sessions.
Method 2: Embed in a Note
Use the command palette (Ctrl/Cmd + P) → "Insert Mandala Chart into note", or type the code block manually:
```mandala
{
  "center": "My Main Goal",
  "themes": [
    { "theme": "Theme 1", "items": ["", "", "", "", "", "", "", ""] },
    { "theme": "Theme 2", "items": ["", "", "", "", "", "", "", ""] },
    { "theme": "Theme 3", "items": ["", "", "", "", "", "", "", ""] },
    { "theme": "Theme 4", "items": ["", "", "", "", "", "", "", ""] },
    { "theme": "Theme 5", "items": ["", "", "", "", "", "", "", ""] },
    { "theme": "Theme 6", "items": ["", "", "", "", "", "", "", ""] },
    { "theme": "Theme 7", "items": ["", "", "", "", "", "", "", ""] },
    { "theme": "Theme 8", "items": ["", "", "", "", "", "", "", ""] }
  ]
}
```
Editing
- Click any circle in the center grid → opens a focused theme view
- Click any cell → opens an edit dialog (Ctrl/Cmd+Enter to save)
- Theme pills at the top → switch between themes in focus mode
- ← Overview button → return to the 9×9 view
Printing
Click 🖨 Print (top right) to open a print-optimized A4 landscape page with all 81 cells.
Color Design
The 8 themes follow a clockwise rainbow gradient around the center:
| Position | Color |
|---|---|
| NW ↖ | 🔴 Red |
| N ↑ | 🟠 Orange |
| NE ↗ | 🟡 Yellow-Green |
| E → | 🟢 Green |
| SE ↘ | 🩵 Teal |
| S ↓ | 🔵 Blue |
| SW ↙ | 🟣 Purple |
| W ← | 🩷 Pink |
The center main goal is highlighted in yellow ⭐
Data Format
Charts are stored as JSON in the mandala code block. You can edit the JSON directly or use the interactive UI.
{
  "center": "My Goal",
  "themes": [
    {
      "theme": "Theme Name",
      "items": ["idea1", "idea2", "idea3", "idea4", "idea5", "idea6", "idea7", "idea8"]
    }
  ]
}
Language Support
The UI language is automatically detected from your Obsidian locale setting. Supported languages:
| Language | Code |
|---|---|
| 日本語 | ja |
| English | en |
| 中文 (简体) | zh |
| 한국어 | ko |
| Español | es |
Contributing
Contributions, bug reports, and feature requests are welcome! Please open an issue or PR on GitHub.
License
MIT License — free to use, modify, and distribute.
Acknowledgements
Inspired by the Mandala Chart planning method, made famous by Shohei Ohtani's high school goal-setting chart.