Kinetica
 Benoit23 downloads
Create animated step-by-step diagrams and interactive function plots with sliders, right inside your notes.
- Overview
- Scorecard
- Updates9
Create visual explanations inside Obsidian: step-by-step diagrams and function plots that respond to sliders. Start from a template and use the editor to build an explanation without writing JavaScript.
Kinetica is an early beta. The community listing is being prepared. Desktop use has been tested on macOS; mobile testing is still needed.
Get started | Examples | Contributing
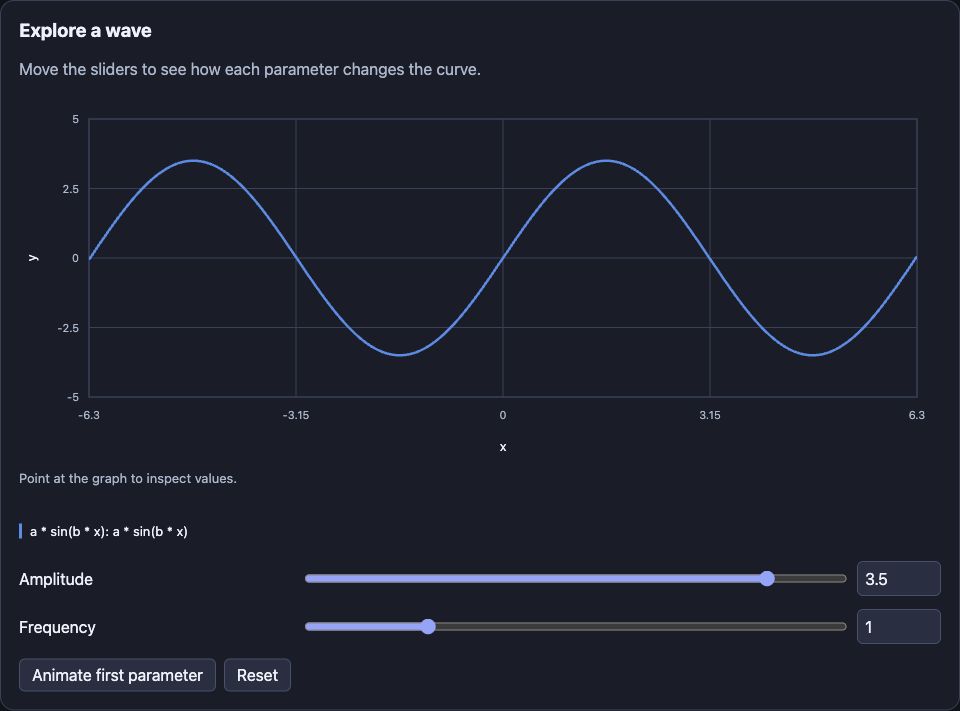
The interface supports English and Russian and follows your Obsidian theme.
Create your first visualization
- Open the command palette and run Kinetica: Create visualization, or click the workflow icon on the ribbon.
- Pick a scene or graph template.
- Edit the title and content. In a scene, drag blocks, add arrows and duplicate a step to create the next state. In a graph, enter formulas and define parameters for sliders.
- Click Save to note. A new Markdown note appears in the current note's folder.
- View it in Reading view or Live Preview. Click Edit to reopen the visual editor.
Add visualization to current note appends a new block to the active note. Edit visualization in current note works from source mode too and offers a chooser when there are several visualizations.
The interface follows Obsidian's language, with English and Russian supported. You can override the language in settings. Reopen notes after changing it; reload the plugin to refresh command names.
Scenes
- Blocks with a label, value, color and highlight
- Drag positioning, arrow-key movement and numeric coordinates
- Directed arrows with labels
- Steps with an explanation and code excerpt
- Duplicate, reorder or delete steps
- Play, pause, back, next, restart, speed and direct step selection
- Smooth position changes between matching block IDs
- Undo and redo in the editor, plus a discard confirmation
Each step stores its own state. Editing a block changes the current step only. Duplicate the current step, then move objects or change values to describe what happens next. New objects appear immediately; existing objects animate between positions. Active line numbers and named variables can be stored per step. The player highlights active lines and changed values. Optional prediction questions pause playback until answered or revealed. Code is displayed without execution.
The canvas uses an 800 by 440 coordinate space. A block is 140 by 74 units. The initial version supports rectangular blocks and straight arrows. It is not a general drawing application.
Graphs
Enter formulas such as a * sin(b * x), exp(rate * x) or 1 / x. Define a, b or rate in the slider editor. The player recomputes the graph locally as a slider moves.
- Up to 8 curves and 12 parameters
- Named axes and explicit axis ranges
- A slider and numeric input for each parameter
- Curve values under the pointer
- Animate the first parameter from minimum to maximum, pause or reset
- Reduced-motion support for transitions
Operators: + - * / ^, parentheses and unary signs. Power is right-associative: 2^3^2 means 2^(3^2). -2^2 means -(2^2).
Functions: sin, cos, tan, asin, acos, atan, sqrt, abs, exp, log, ln, log10, floor, ceil, round, min, max, pow. Trigonometry uses radians; log and ln are natural logarithms. Constants: pi, e. Use * for multiplication, including 2 * x.
Parameter names start with a letter and use letters, digits or underscores. Function names, x, pi and e are reserved. A slider only changes a curve if that parameter appears in the formula. Preview slider changes are temporary. Change Initial value in the editor to save a different starting value.
Plots sample 401 points across the X range. Undefined results are omitted and large jumps are split. This is an educational plotter, not a numerical solver: very narrow features and discontinuities between samples can be missed. Resize the axis range to inspect them.
Learning tools and Plotly
- Follow code lines and variable changes with each scene step
- Ask prediction questions before readers continue
- Explore a queue with linked sliders, diagram, metrics and chart
- Compare one worker against a pool, or play two scenes together
- Import Plotly figure JSON created with Python, including offline scientific and 3D plots
- Export any visualization as one standalone HTML file
Read Learning tools for creation steps, Python examples and limits. The full Plotly runtime is included locally. Python scripts are not executed. Geographic maps and remote resources are not supported. Full Plotly makes the viewer about 5 MB. The plugin shares one Plotly payload with its HTML exporter and stays below 5 MB.
Portable documents
A visualization is versioned JSON inside a motion fenced code block in the note. Copying the note copies the full visualization; there are no hidden asset dependencies. Recipients need Kinetica to view the interactive version. With the plugin disabled, the note retains its readable source data.
The editor can import JSON from another user or an assistant. Imported documents receive a fresh ID. If you manually duplicate a block inside the same note, give its id a new value before editing either copy. Use top-level fenced blocks for visual editing; editing blocks nested in blockquotes is not supported in this version. The editor refuses to save when it detects a duplicate ID or a conflicting edit to that visualization. Unrelated edits to the surrounding note are preserved.
Examples are in examples/. Documents must contain version: 1 or version: 2, a unique id, type, title and description plus fields for that type. Limits are 100 steps, 64 blocks and 128 arrows per step, and 500,000 characters in the serialized block. Label and expression limits are checked before rendering.
No JavaScript or HTML from a document is executed. Formulas are parsed by a restricted mathematical interpreter; they cannot access files, the network or JavaScript objects. Unknown functions and parameters produce validation errors.
Install the beta
Download the three plugin files from GitHub Releases You can also build them locally with the development commands below.
- Place
main.js,manifest.jsonandstyles.cssin<vault>/.obsidian/plugins/kinetica/. - Reload Obsidian and enable Kinetica under Settings > Community plugins.
- Copy an example note into the vault, or run Create visualization.
Minimum API version: Obsidian 1.8.7. Live desktop verification was performed on Obsidian 1.14.4 for macOS. The code avoids Node/Electron APIs and adapts to narrow screens, but mobile devices and other desktop operating systems have not been tested yet. Validation messages are translated into Russian.
This plugin runs offline. It uses no accounts, remote services, telemetry or external scripts. It reads and writes the notes you create or edit, and saves its language setting in its own plugin directory.
Use it on an HTML page
The standalone viewer works without Obsidian. Download kinetica.js and kinetica-example.html from the HTML release, keep them together and open the HTML file. To embed your own document, use a <kinetica-player> element with the JSON from a motion block.
See HTML embedding for the full copyable example, theme options, script escaping and limitations. The same scene and graph format works in notes and web pages.
Development
Use Node.js 22. Install and run checks:
npm ci --ignore-scripts
npm run check
npm run dev rebuilds JavaScript on changes. Run npm run build after changing styles or manifest too. The installable files are written to dist/. Reload the plugin in a test vault after copying them there.
src/model.ts owns document validation and conflict-aware replacement. src/expression.ts parses math. src/player.ts, src/plot.ts and src/draw.ts render without the Obsidian API. src/editor.ts owns editable drafts and history. src/main.ts adapts those components to commands, Markdown rendering and vault storage.
Tests cover expression parsing, invalid input, serialization, concurrent edit protection, playback, slider behavior, editor history and failed saves. CI runs formatting, lint, tests and the production build. It uploads a build artifact. Pushing a version tag runs a separate release workflow that tests, attests and publishes the installable files.
Distribution
See RELEASING.md for build, release and community-directory submission steps. The release tag must match the manifest version without a v prefix, currently 0.3.2.
Follow the current Obsidian submission guide for community-directory submission. No repository, release or submission is created by the build scripts.
The step-by-step interaction was inspired by the author's Voidlearn textbook. This plugin uses its own portable document format and renderer; it does not include the textbook's 292 scenes or execute their TypeScript modules.