Inline Local Graph
 tkoxff1k downloads
Visualize the local graph inline within your notes.
- Overview
- Scorecard
- Updates11
Displays a custom local graph of the current note directly at the bottom of the note content.
Utilizes the unused space at the bottom of your notes!
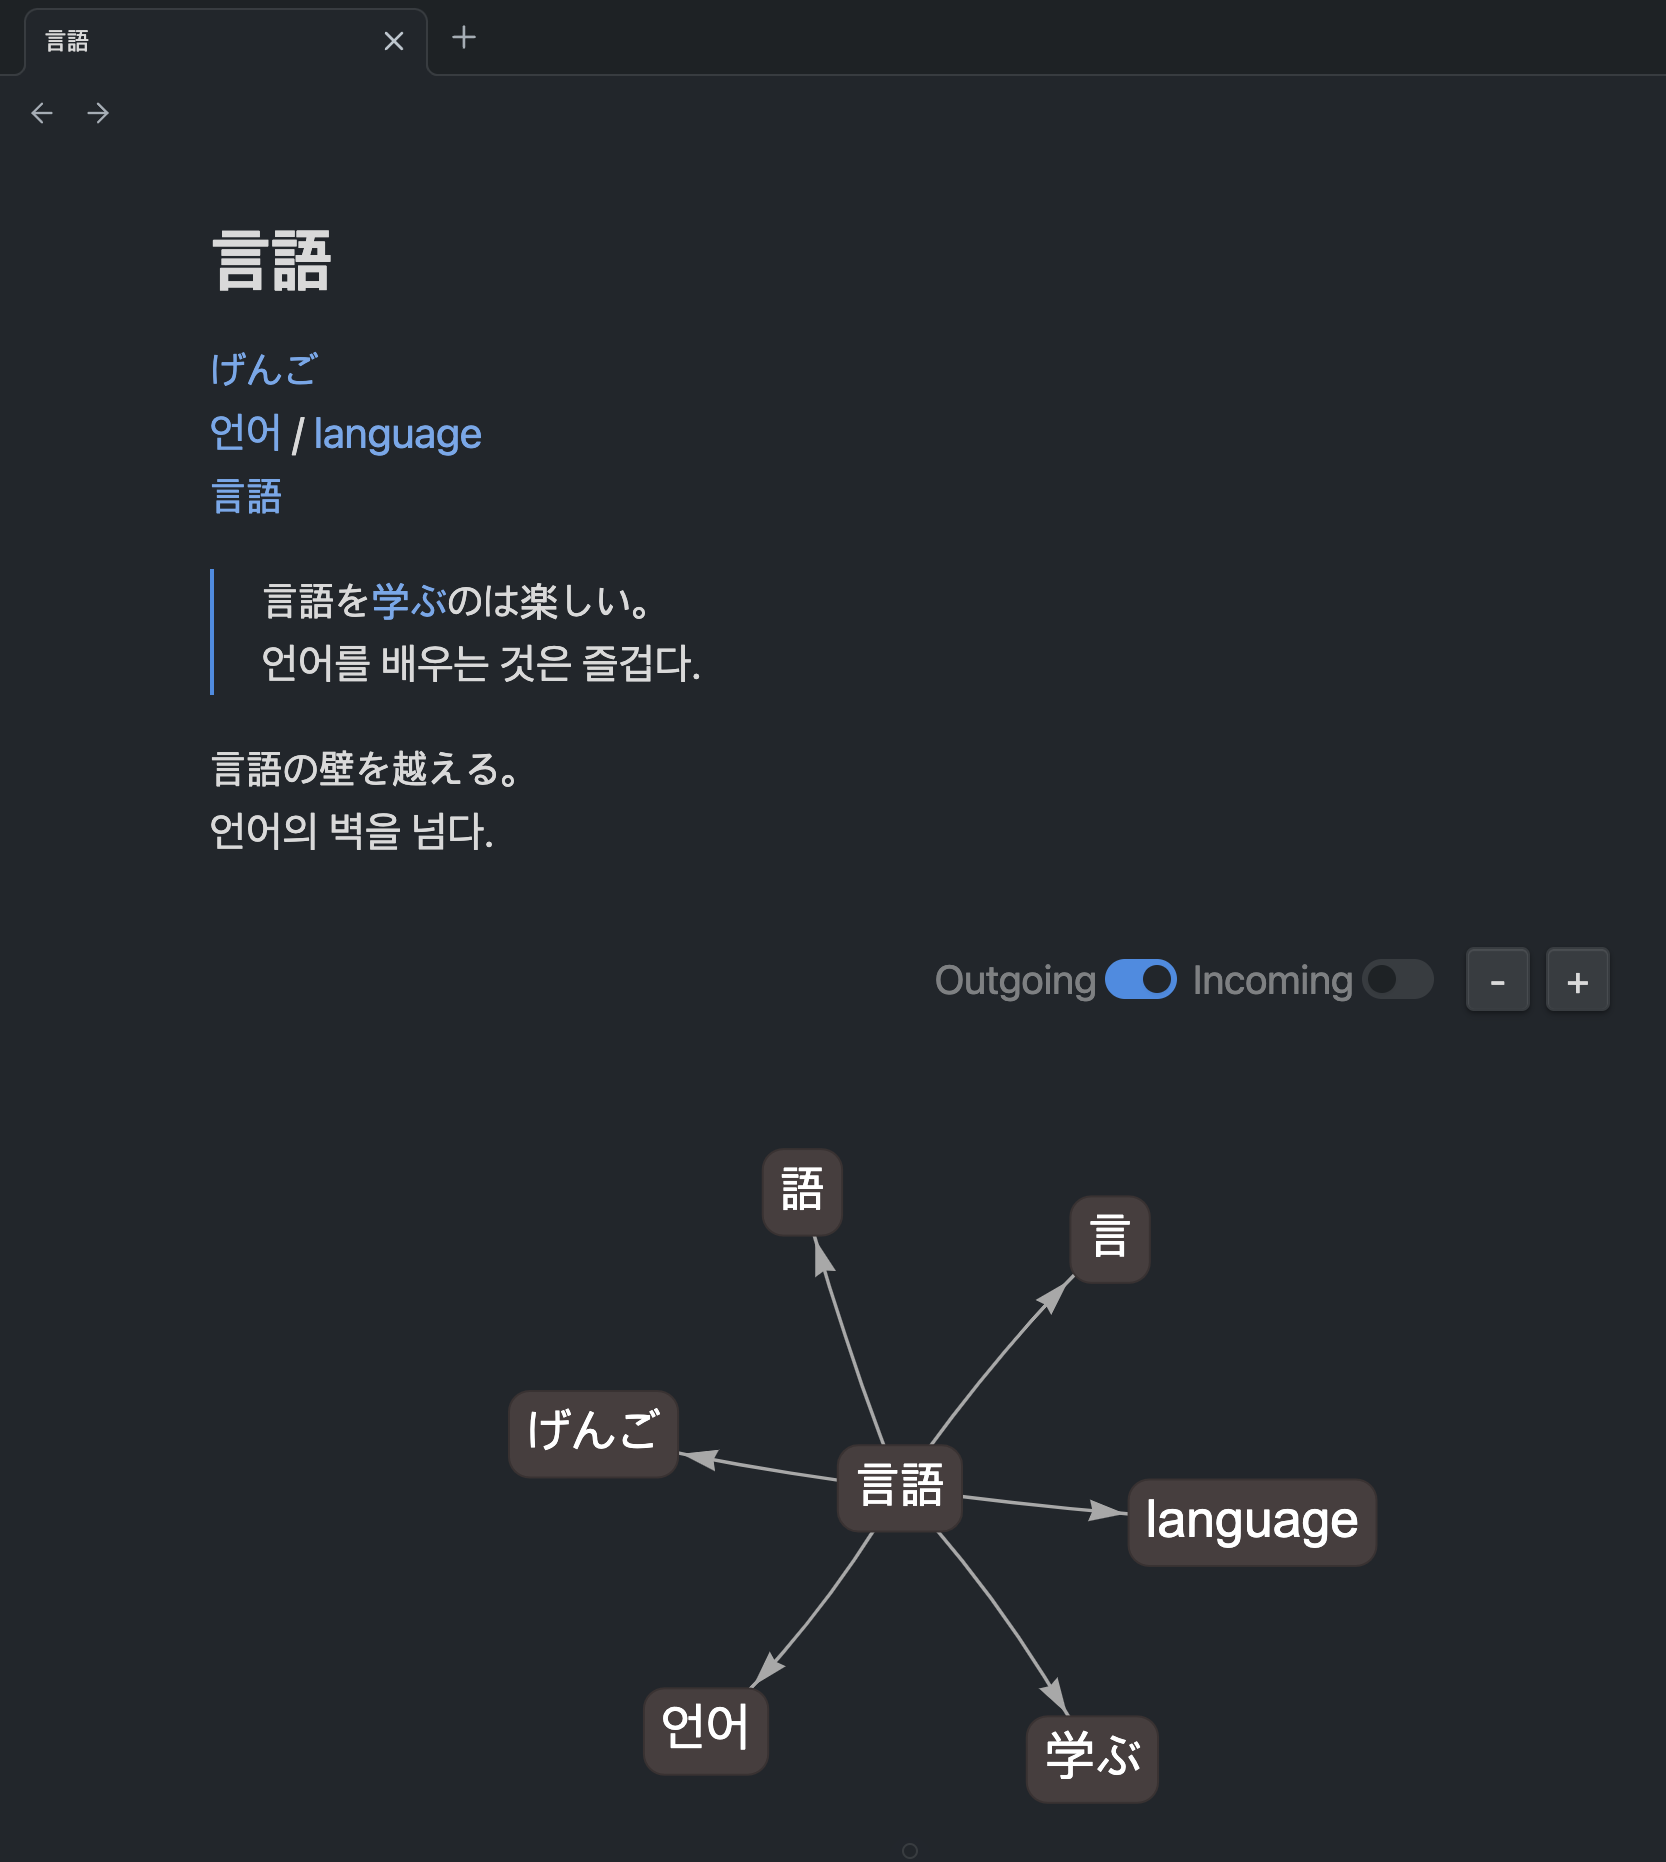
Why
Obsidian's local graph lives in a side panel — you have to open it, resize it, and look away from what you are reading. Inline Local Graph puts the same information where your eyes already are: at the end of the note, in the space that is usually blank.
It is especially handy for notes that are short but heavily interlinked — vocabulary cards, glossaries, daily notes, MOCs — where the links are the content.
Example: learning foreign words
The screenshot above is a vocabulary card for the Japanese word 言語 (gengo, "language"). It links out to its kana reading (げんご), its Korean and English equivalents (언어 / language), the two kanji it is built from (言, 語), and a verb it often appears with (学ぶ).
The whole word family sits right below the card, so reviewing one word pulls its neighbours back into view — no side panel, no context switch.
Features
Practical local graph visualization
A custom local graph focused on clarity, displaying links and backlinks without flashy visual effects, making it easy to understand and navigate between notes.
- Outgoing and incoming links — toggle each independently from the control bar or settings
- Node styling — shape, background color, and font size
- Label truncation — with separate limits for alphabet and CJK (Korean/Japanese/Chinese) labels, so wide characters do not stretch nodes
- Node limit — cap how many nodes are displayed to keep dense notes readable
- Image links excluded — embedded images do not clutter the graph
- Localized UI — English, Korean, and Japanese
Installation
From Obsidian's community plugins
- Open Settings → Community plugins and make sure Restricted mode is off.
- Click Browse, search for Inline Local Graph.
- Click Install, then Enable.
Manual installation
- Download
main.js,manifest.json, andstyles.cssfrom the latest release. - Copy them into
<your vault>/.obsidian/plugins/inline-local-graph/. - Reload Obsidian and enable the plugin in Settings → Community plugins.
Usage
Simply enable the plugin, and the inline local graph will automatically appear at the bottom of your note.
A small control bar sits above the graph:
| Control | What it does |
|---|---|
| Outgoing | Show or hide links going out of the current note |
| Incoming | Show or hide backlinks pointing at the current note |
| + / − | Zoom the graph in and out |
Click any node to open that note. Mouse-wheel zooming is intentionally disabled so scrolling through a note never gets trapped inside the graph.
Settings
Settings live under Settings → Community plugins → Inline Local Graph.
Graph
| Setting | Description | Default |
|---|---|---|
| Show arrows on edges | Toggle arrow display on graph edges. | On |
| Show graph border | Toggle the border around the graph container. | Off |
| Show outgoing links | Toggle whether to display outgoing links in the graph. | On |
| Show incoming links | Toggle whether to display backlinks in the graph. | On |
| Skip image links | Toggle whether to exclude image files from the graph. | On |
| Initial zoom | Set the initial zoom scale for the inline graph. | 1.0 |
| Max displayed nodes | Maximum number of nodes shown, excluding the active note (which is always shown). Outgoing links are prioritized over backlinks. Range 1–200. | 30 |
Node style
| Setting | Description | Default |
|---|---|---|
| Node shape | Ellipse, Box, Circle, Dot, or Text only. | Box |
| Node background color | Set the background color of graph nodes. | #888888 |
| Node font size | Set the font size of node labels. | 14 |
| Truncate labels | Shorten long node labels with an ellipsis (...). | On |
| Max label length (alphabet languages) | Maximum characters before truncation for alphabet-based languages. | 20 |
| Max label length (Korean/Japanese/Chinese) | Maximum characters before truncation for non-alphabet languages. | 10 |
Dependencies
This plugin uses the vis-network.js library to render interactive network graphs inside your notes.
Support
If this plugin is useful to you, you can support its development:
License
MIT © TKOxff