
- Overview
- Scorecard
- Updates25
Plugin of Obsidian that creates interactive graphs from YAML.
This file only covers the basics of how to use this plugin for more information go to Graphs Wiki.
If you have a cool graph that helps show the capabilities of this plugin please post it in this thread discussion.
Features
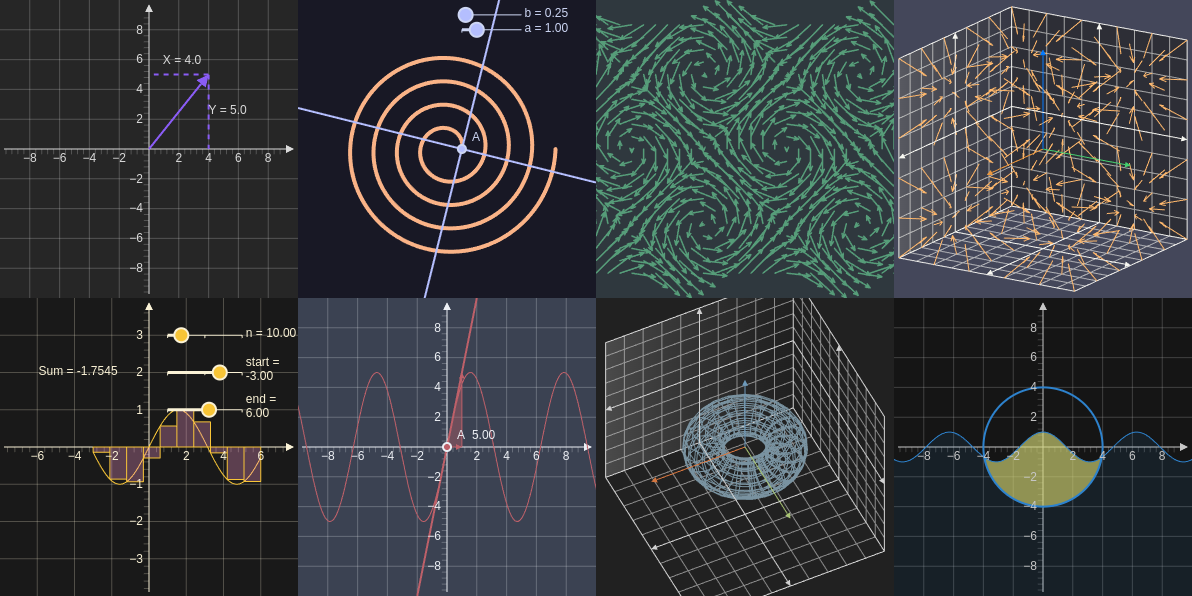
- Built in graph types (circle, derivative, vector fields, etc.)
- Complex mathematical function support
- Interactable
- 3D graphs
- Export graphs as SVG
Export graphscommand in read mode
- Syntax highlighting
- Obsidian theme support
Installation
Can be found in the community plugin browser in Obsidian.
- make sure to turn off restricted mode
- you can paste this link into your browser and it will bring you to the page
obsidian://show-plugin?id=graphs
- click install
How to use
To create a graph create a code block with the language set to graph.
```graph
bounds: [Xmin, Ymax, Xmax, Ymin]
elements: [
    {type: name, def: []}
]
```
Examples
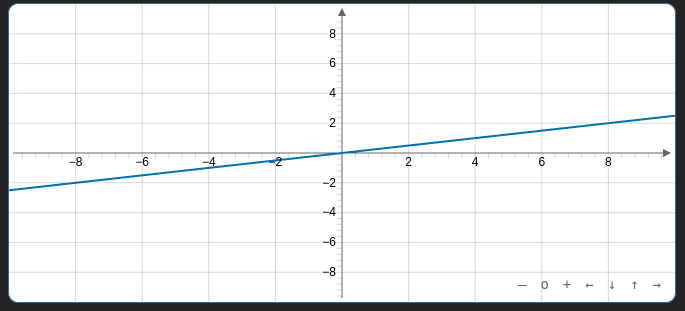
Line
```graph
bounds: [-10, 10, 10, -10]
elements: [
    {type: line, def: [[0,0],[4,1]]}
]
```
Sin Riemannsum
```graph
bounds: [-8,4,8,-4]
elements: [
    {type: slider, def: [[1,3],[5,3],[1,10,50]], att: {name: "n"}},
    {type: slider, def: [[1,2],[5,2],[-10,-3,0]], att: {name: "start"}},
    {type: slider, def: [[1,1],[5,1],[1,6,10]], att: {name: "end"}},
    {type: functiongraph, def: ["f:Math.sin(x)", "f:e1", "f:e2"]},
    {type: riemannsum, def: ["f:Math.sin(x)","f:e0", "left", "f:e1", "f:e2"], att: {fillColor: "#ffff00", fillOpacity: 0.3}},
    {type: text, def: [-4, 2, "'Sum = ' + f:e4.toFixed(4)"], att: {fillColor: "#ffff00", fillOpacity: 0.3}},
]

```
Bugs
If you find any bugs with this plugin please create a new issue so that they can be resolved.
Contributing
If you want to contribute please create an issue or pull request.
For making changes to the wiki you can find the repository here. All of the pages are markdown files in the content folder.
Attribution
This plugin uses
63%
HealthGood
ReviewCaution
About
Create interactive graphs from YAML code blocks with built-in types such as lines, functions, vector fields, and 3D plots. Interact with sliders and mathematical functions, render complex expressions, and export graphs as SVG with syntax highlighting and Obsidian theme support.Details
Current version
1.9.3
Last updated
2 years ago
Created
2 years ago
Updates
25 releases
Downloads
4k
Compatible with
Obsidian 0.15.0+
Platforms
Desktop, Mobile
License
GPL-3.0
Sponsor