FieldForge
 Kerekes Stefan205 downloads
Visual property explorer for your vault. Pick frontmatter fields and forge them into pivot tables and charts — no Dataview queries needed.
- Overview
- Scorecard
- Updates4
Visual property explorer for Obsidian. Pick frontmatter fields and forge them into pivot tables and charts — no Dataview queries needed.
Why
Most dashboard tooling in Obsidian (Dataview, Dashboard Plus, …) is query-centric: you write a query, then render it. FieldForge flips that — you just pick fields:
- Rows — group by any frontmatter property or a file field (folder, tags, created, …)
- Columns — pivot a second property into columns (optional)
- Values — count files, or aggregate a numeric property (sum / avg / min / max / distinct)
The view re-forges instantly on every change. No query syntax, no code blocks.
Screenshots
 |
 |
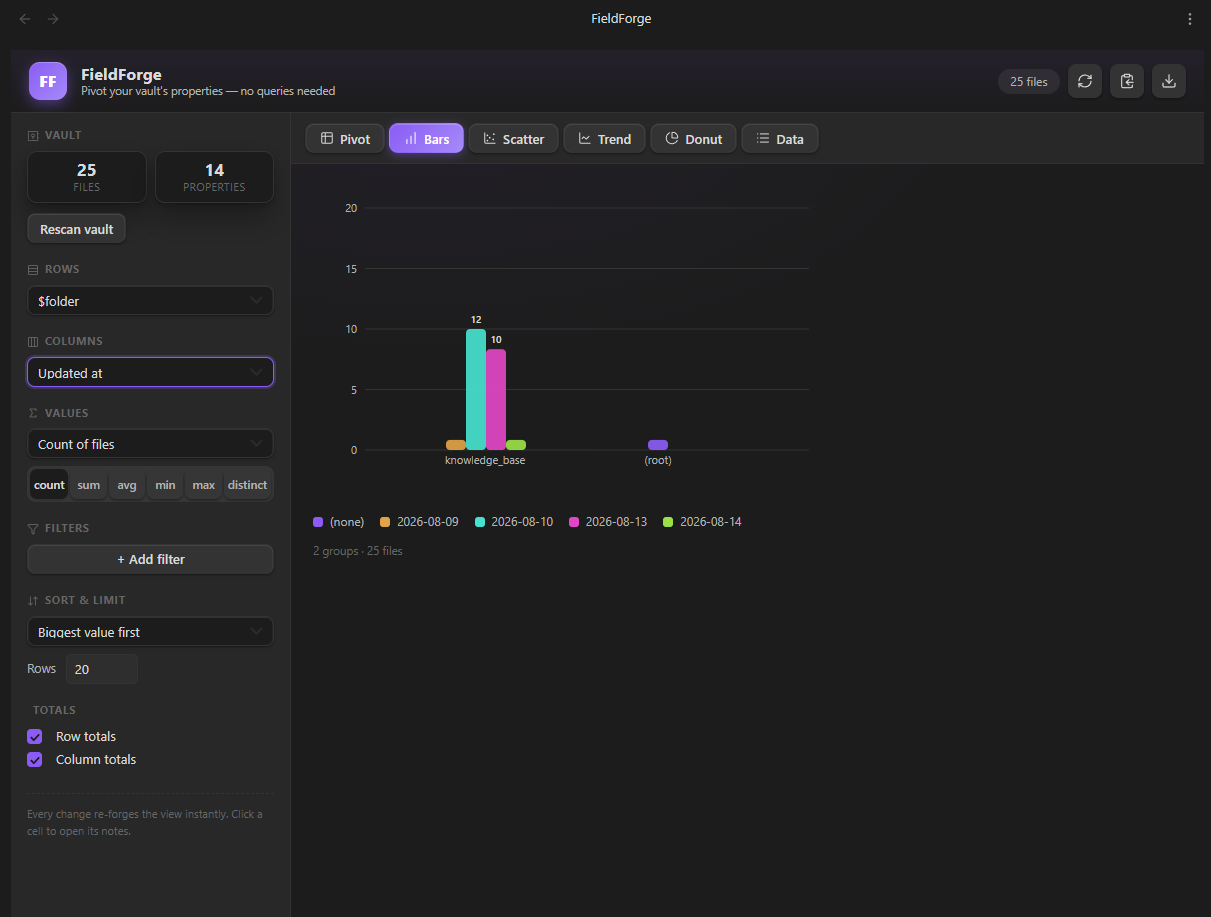
| Pivot table with heatmap cells | Grouped bar chart |
 |
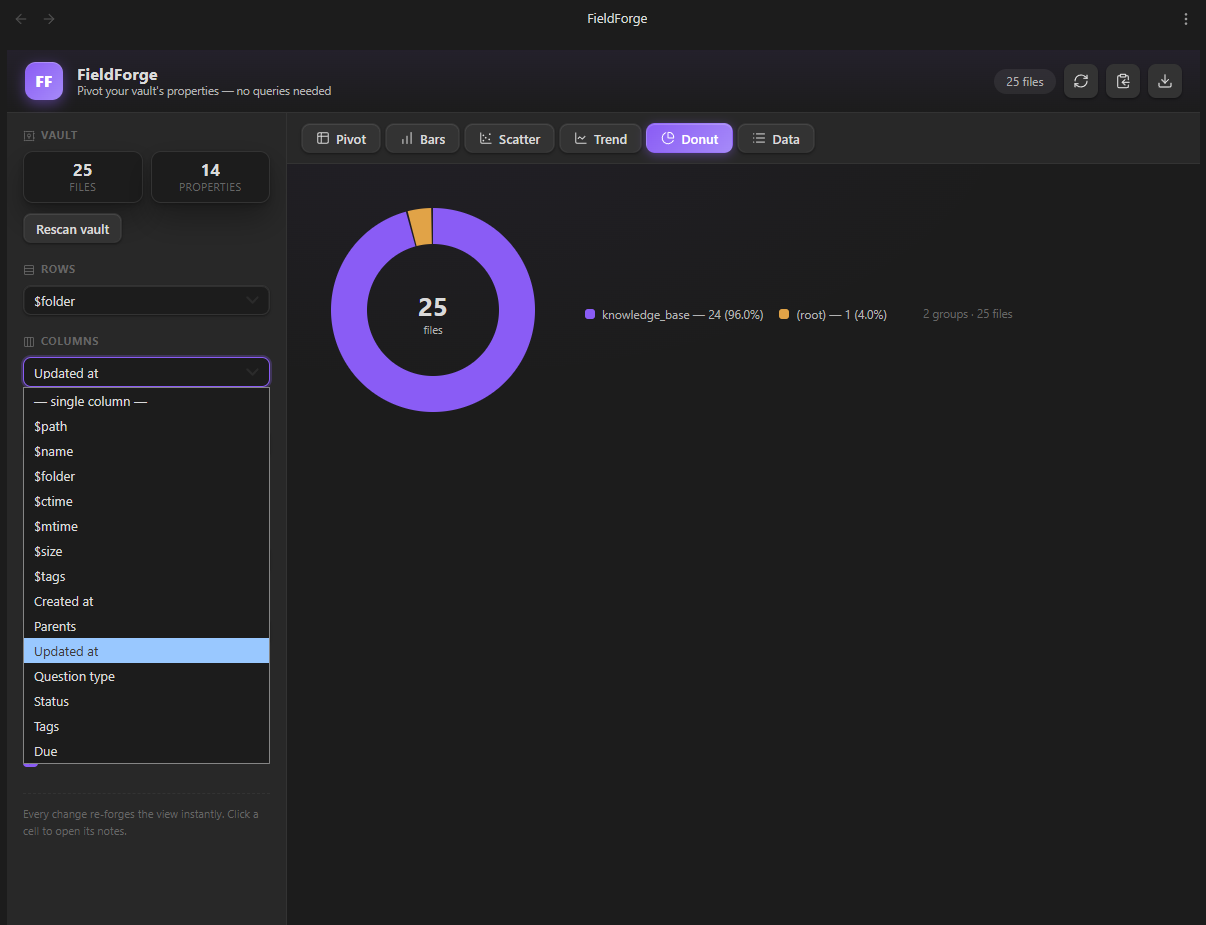 |
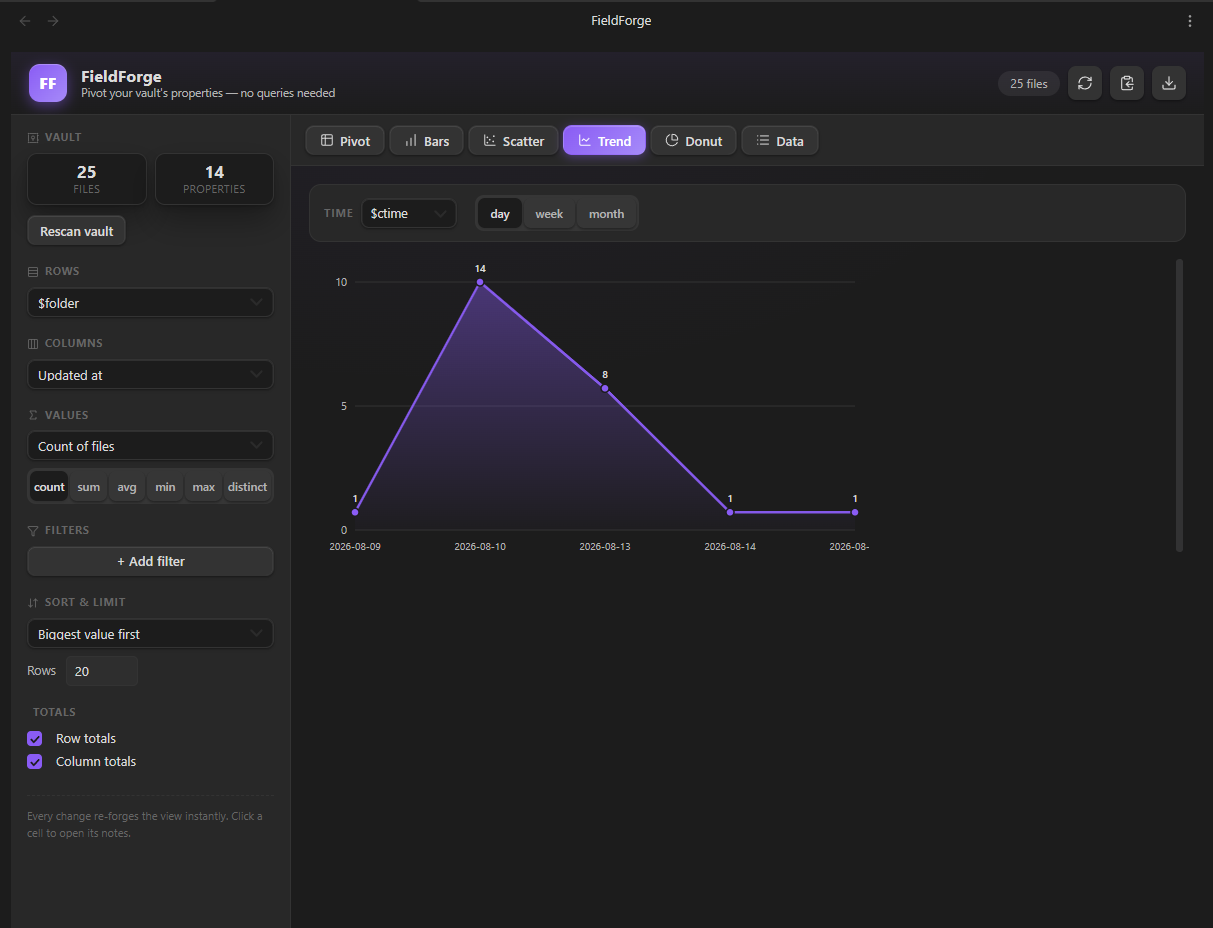
| Files created over time | Share of totals per group |
Features
- Pivot table with per-column heatmap coloring, row/column totals, hover tooltips listing the files in each cell, and click-to-open-note
- Bar chart — single-series or grouped by columns, with value labels and hover tips
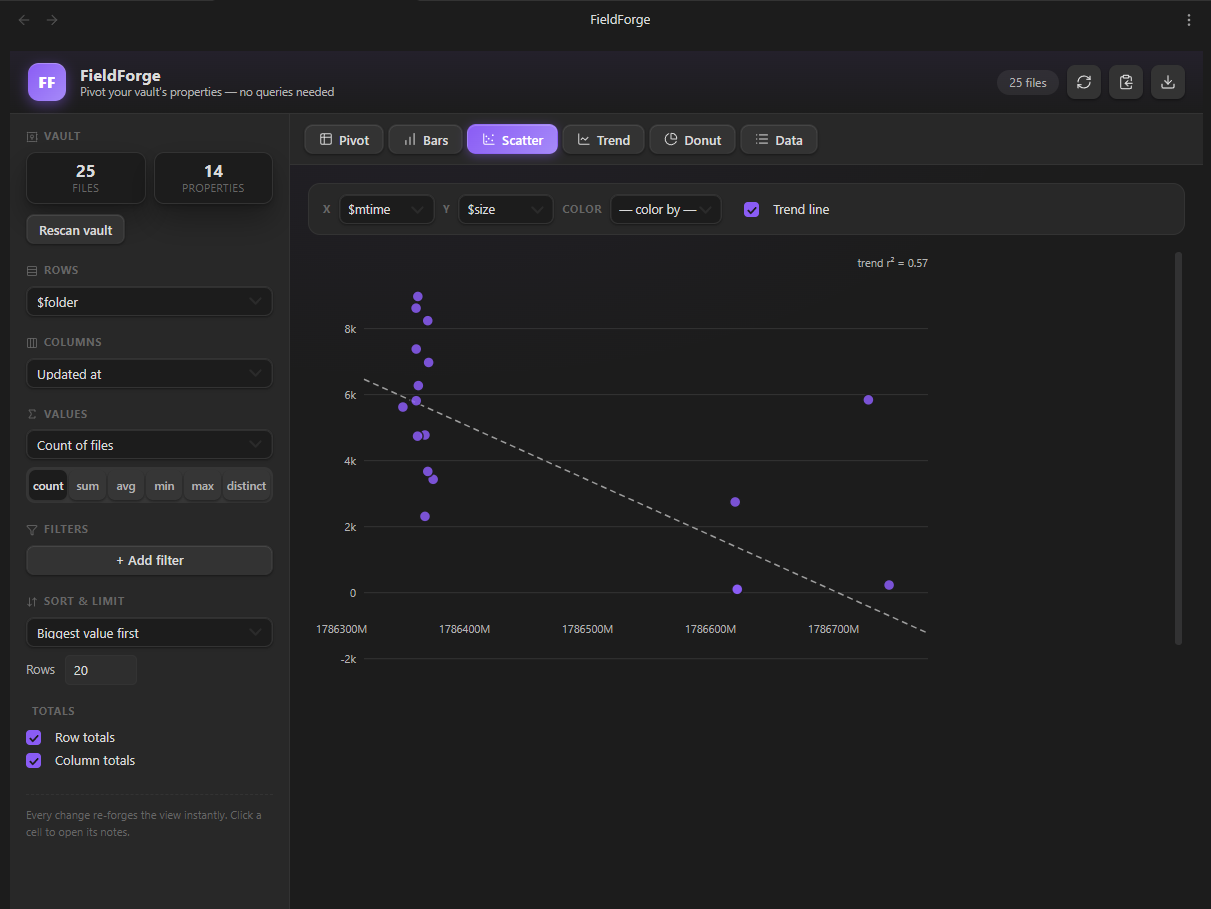
- Scatter plot — any two numeric/date properties, color-coded by a category, with an optional least-squares trend line (r² shown)
- Trend chart — file counts over time (day / week / month buckets) as an area chart
- Donut chart — share of totals with legend
- Data grid — searchable raw table, toggle columns with chips, click to open
- Filters — equality, ≠, contains, >, <, exists, is empty
- Export — copy the current view as a Markdown table or download CSV
- Auto-refresh — the view rebuilds itself (debounced) as you edit your vault
- Theme-native — built entirely on Obsidian design tokens; adapts to any theme, light and dark, desktop and mobile
Install
- Build (requires Node 18+):
cd fieldforge npm install npm run build - Copy the folder into your vault:
(the folder must contain<your-vault>/.obsidian/plugins/fieldforge/main.js,manifest.json, andstyles.css) - In Obsidian: Settings → Community plugins → enable FieldForge (toggle "Restricted mode" off first if needed).
- Click the table icon in the left ribbon, or run FieldForge: Open FieldForge from the command palette.
Usage tips
- Start with Rows = Folder and Values = Count of files to see your vault at a glance.
- To compare two properties (e.g. Type × Status), set Rows and Columns, then click the Bars tab.
- The Scatter tab needs numeric fields — pick e.g.
Created × Wordsand color byType. - Click any pivot cell to jump to the note behind the number.
Development
npm run dev        # watch mode (esbuild)
npm run typecheck  # tsc --noEmit
npm run build      # typecheck + production bundle
Structure
src/
├── main.ts            # plugin entry: ribbon, commands, view registration
├── view.ts            # view shell: header, tabs, canvas, config state
├── data/
│   ├── schema.ts      # types, built-in fields, value helpers
│   ├── scanner.ts     # vault scan via metadata cache
│   └── pivot.ts       # filter → bucket → aggregate engine
└── ui/
    ├── controls.ts    # sidebar: field pickers, aggregation, filters
    ├── pivotTable.ts  # heatmap table + markdown/CSV export
    ├── dataGrid.ts    # searchable raw table + export
    └── charts.ts      # dependency-free SVG charts (bar/scatter/trend/donut)
preview.html is a standalone design mock — open it in any browser to see the UI
(light/dark toggle included) without running Obsidian.
License
MIT © 2026 Kerekes Stefan
HealthExcellent
ReviewPassed
About
Explore frontmatter and file fields visually by building pivot tables and charts without writing Dataview queries. Group and pivot by any property, aggregate numeric values (count/sum/avg/min/max), switch between pivot table, bar, scatter, trend and donut views, filter results, and export to CSV or Markdown.Details
Current version
1.0.3
Last updated
2 months ago
Created
2 months ago
Updates
4 releases
Downloads
205
Compatible with
Obsidian 1.4.0+
Platforms
Desktop, Mobile
License
MIT