- Overview
- Scorecard
- Updates5
Feature:
- compatiable with mobile
- latest echarts version(v6.0.0)
Install
install from obsidian plugin market
- Not published yet
manual install
- download assets from release
- create a folder named
echarts-litein your obsidian vault plugin folder({your obsidian vault path}/.obsidian/plugins/) - move the downloaded assets to the new created folder
- reload Obsidian
- enable the plugin
install from BRAT(Currently Recommended)
- Install BRAT if you haven't installed it yet.
- Enable BRAT in Settings → Community plugins
- Open Command Palette(Ctrl+P) and type
BRAT: Plugins: Add a beta plugin for testto open the Community Plugin Manager. - input the plugin repository url: https://github.com/x-ideas/obsidian-echarts-lite
- select the latest version
- click
Add pluginbutton to install the plugin. - enable
echarts-liteplugin in Settings → Community plugins if it's not enabled automatically.
How to Use
```dataviewjs

const option = {
    tooltip: {
        trigger: "axis",
        axisPointer: {
            type: "shadow",
        },
    },
    legend: {},
    xAxis: {
        type: "category",
        data: ["Mon", "Tue", "Wed", "Thu", "Fri", "Sat", "Sun"],
    },
    yAxis: {
        type: "value",
    },
    series: [
        {
            name: "name",
            data: [150, 230, 224, 218, 135, 147, 260],
            type: "bar",
        }
    ]
}
app.plugins.plugins['echarts-lite'].api.render(option, this.container)
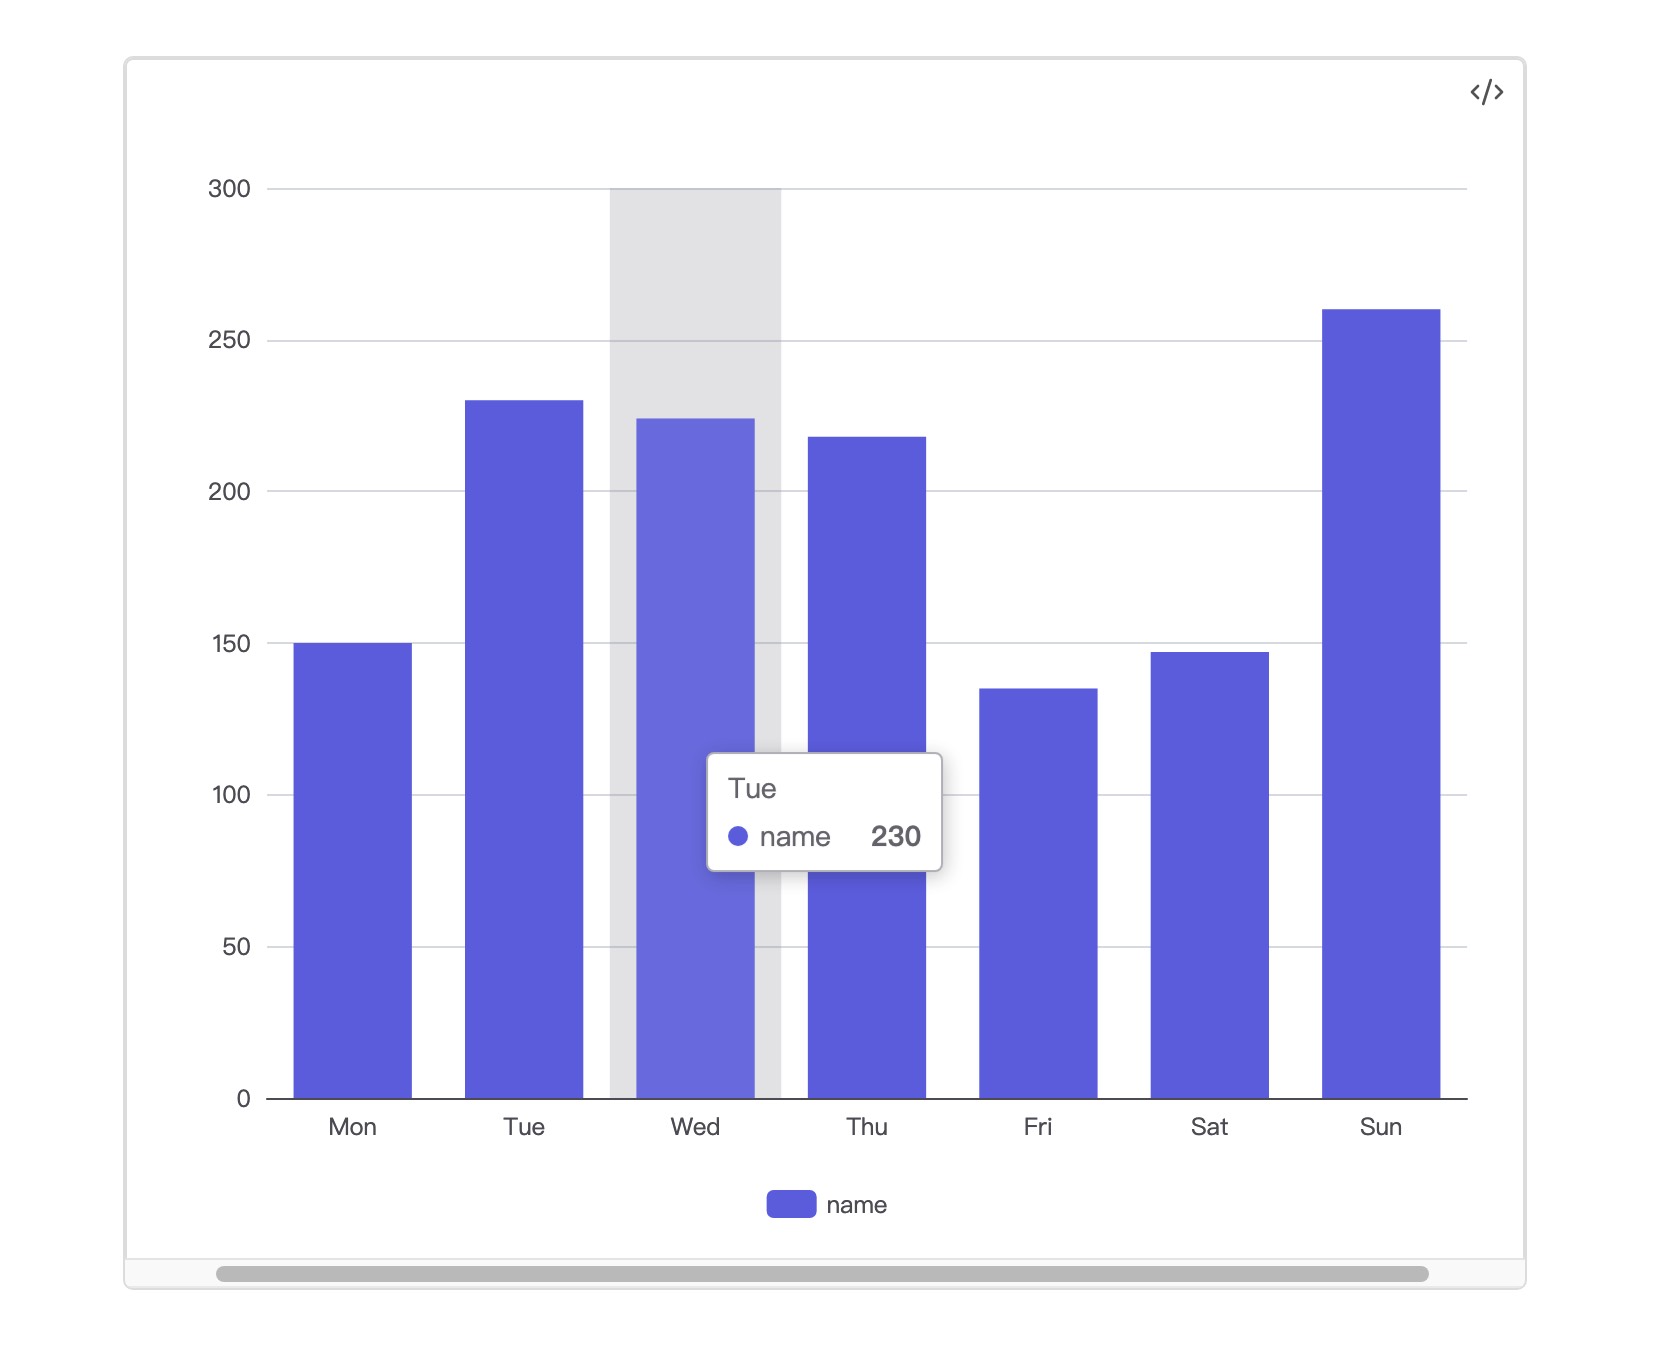
and the result will be like this:
Other
- ispired by obsidian-echarts
HealthExcellent
ReviewSatisfactory
About
Render mobile-friendly ECharts v6 charts directly inside Obsidian notes. Call the plugin API with standard ECharts option objects from scripts or dataviewjs to draw interactive bar, line, pie and other chart types.Details
Current version
1.1.3
Last updated
Last week
Created
2 years ago
Updates
5 releases
Downloads
442
Compatible with
Obsidian 0.15.0+
Platforms
Desktop, Mobile
License
MIT
Author