Bases Link Graph
 theluckystrike1 downloads
Draws the notes that a base selects as an interactive graph. Links become edges, and you click a node to open its note.
- Overview
- Scorecard
- Updates1
Bases Link Graph draws the notes that a base selects as a graph. Each note is a node, and each link between two of those notes is an edge. Set the filters of the base, and the graph shows only those notes.
Bases Link Graph is a view for the core Bases plugin. It uses only the public Bases API.
Features
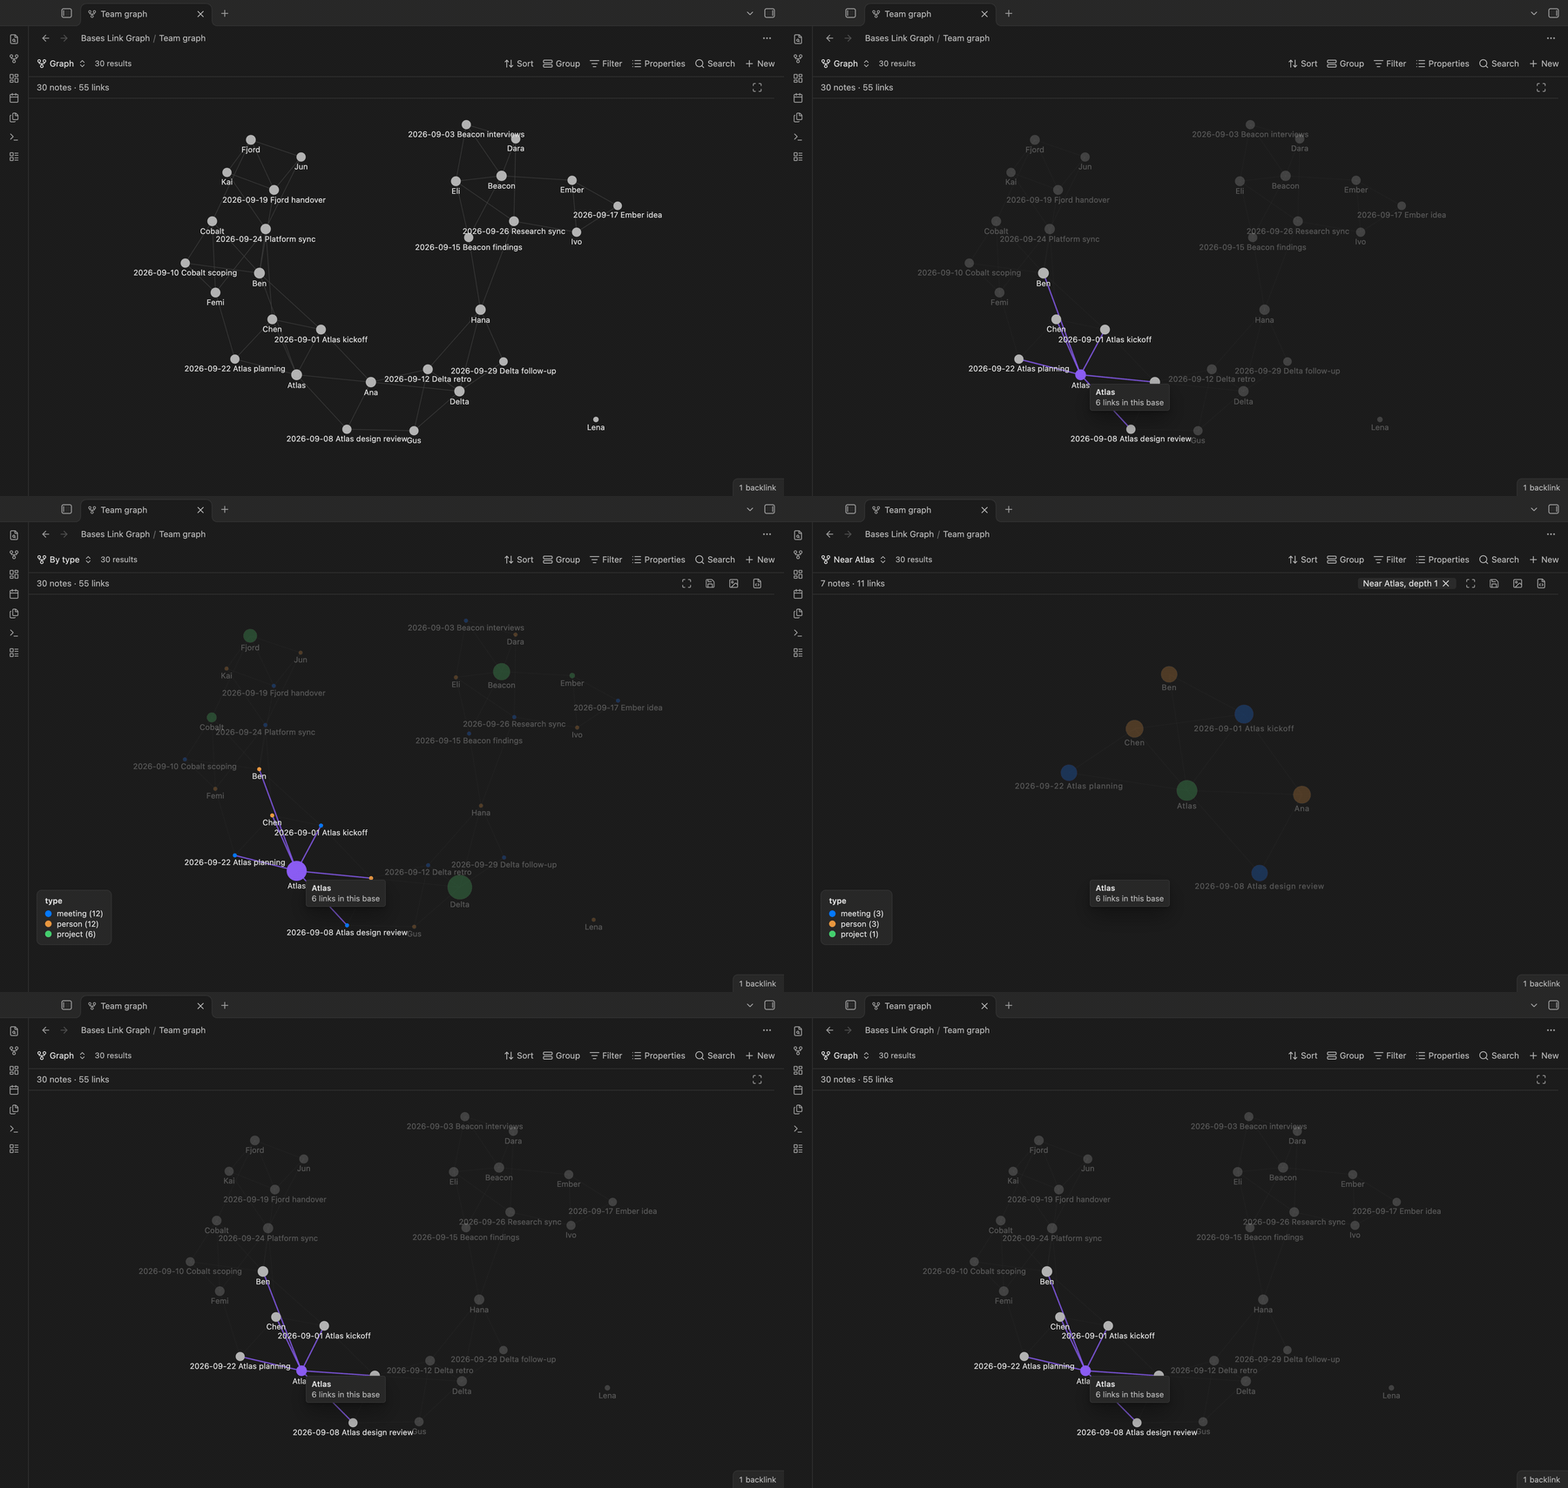
The notes of a base as a graph
Every row of the base becomes one node, so the node count is the same as the result count. A link from one note in the base to another note in the base becomes an edge. Links to notes outside the base are left out. A small force layout places linked notes near each other. Notes with more links are a little larger.
Click to open, hover to preview
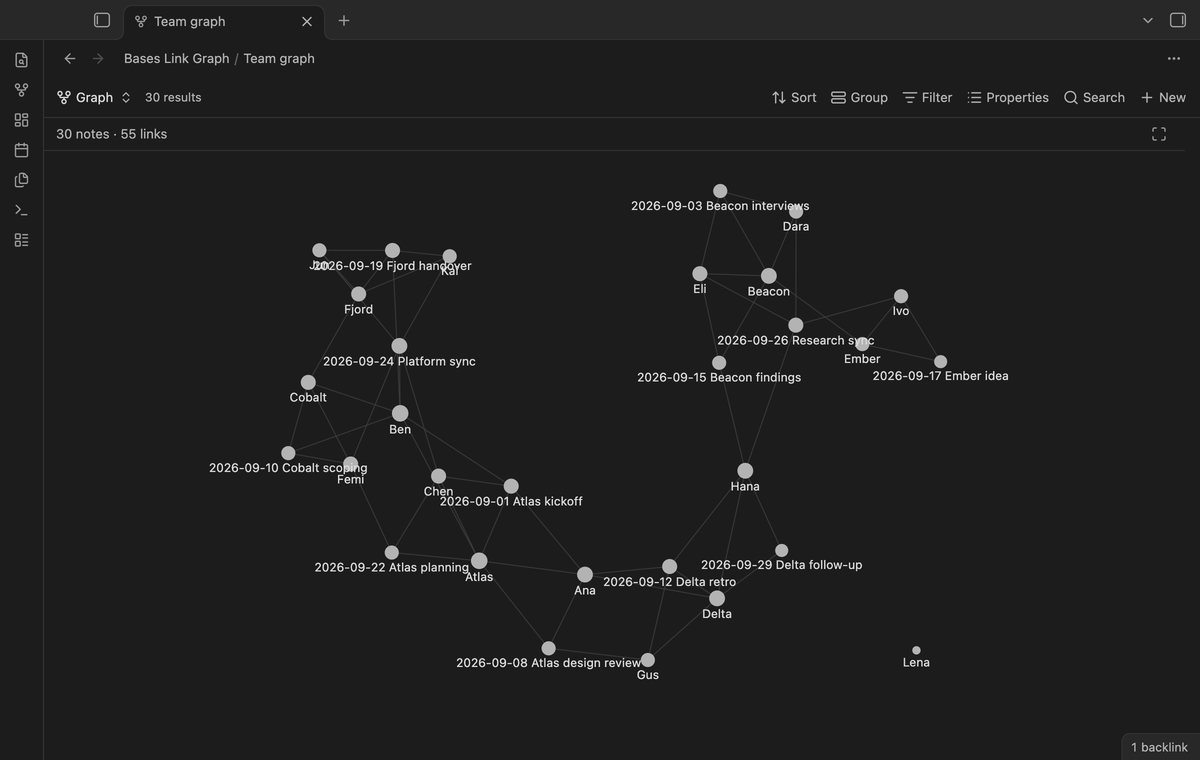
Click a node to open its note. Ctrl-click (Cmd-click on macOS) opens it in a new tab. Hover over a node to light up its links and see a card with its name. Hold Ctrl (Cmd on macOS) while you move onto a node to see the page preview of the note. Scroll to zoom, drag the background to pan, and drag a node to move it. Double-click the background to fit the graph in the view.
Live update and embeds
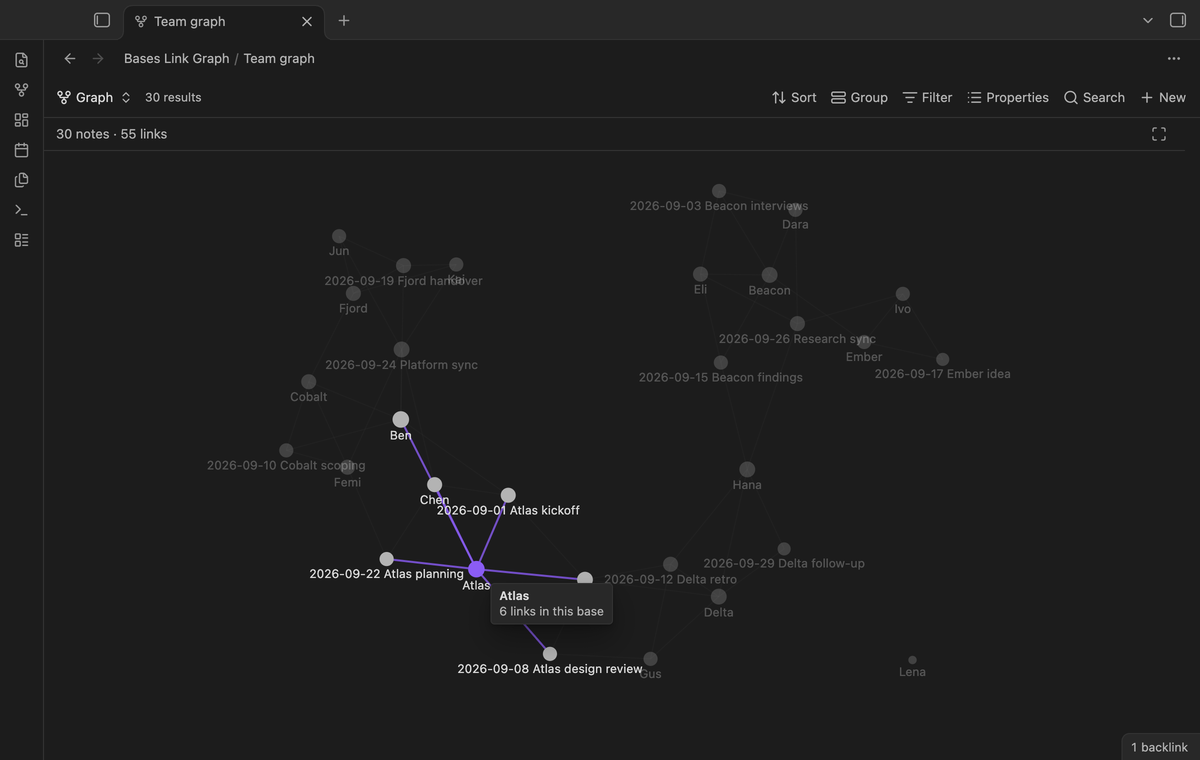
When you add or remove a link in a note of the base, the graph draws again after a short delay. The nodes keep their place, so the graph does not jump. You can embed the view in any note with ![[Your base.base#View name]], for example in a weekly review. The colors follow your theme.
Size and color by a property (Pro)
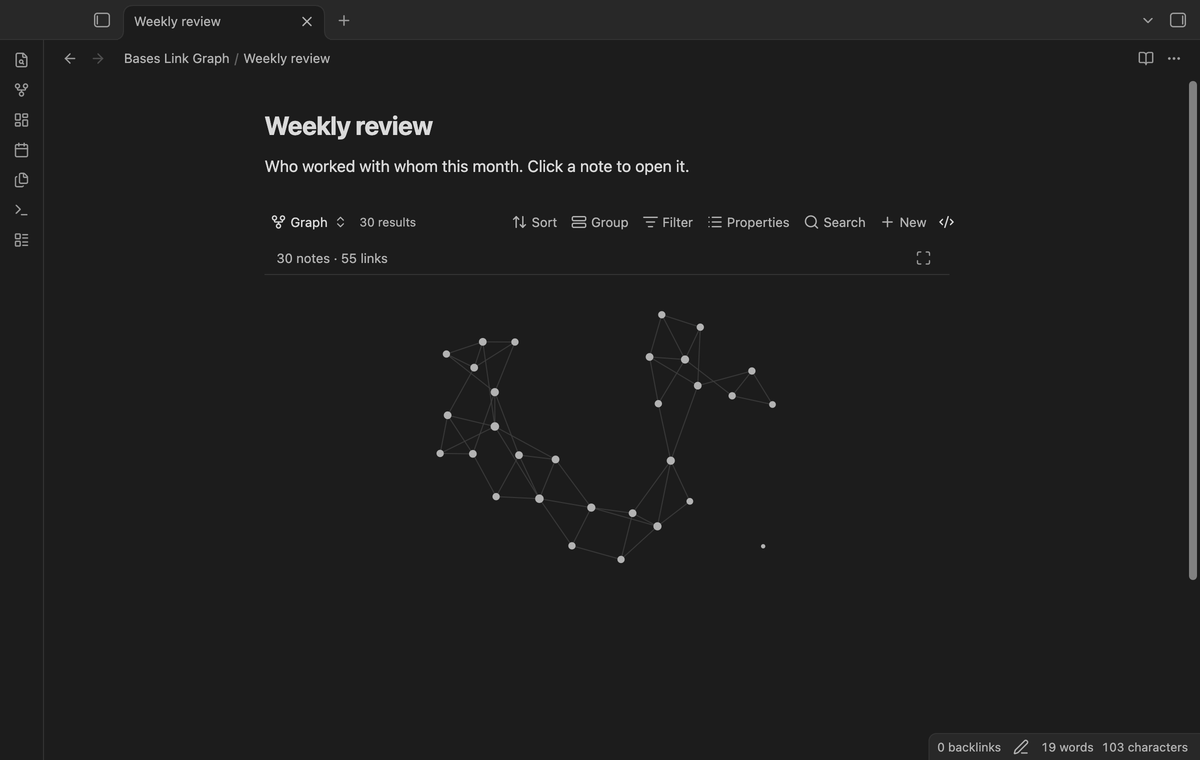
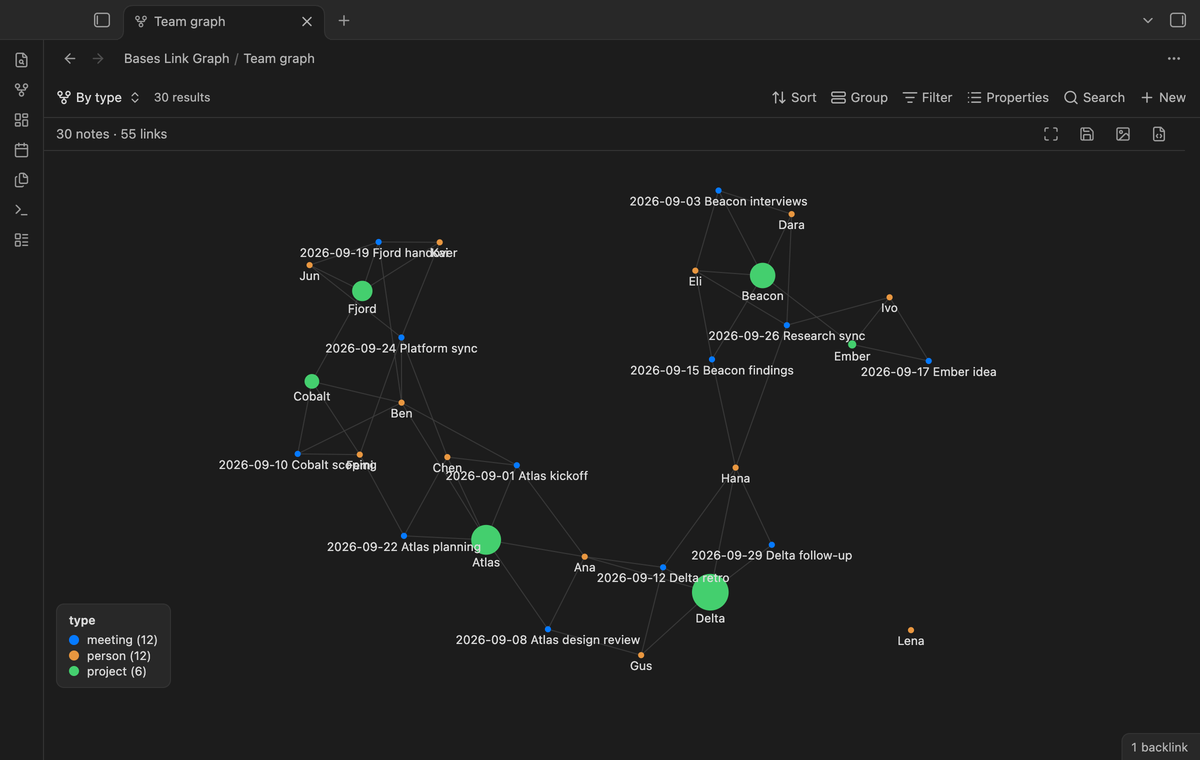
Set "Size by" to a number property, for example hours or rating. The area of each node then follows the value. Set "Color by" to any property, for example type. A legend shows each value and its count. Many different numbers become five ranges. With more than eight values, the less common ones share one "Other" color.
Edges from shared values (Pro)
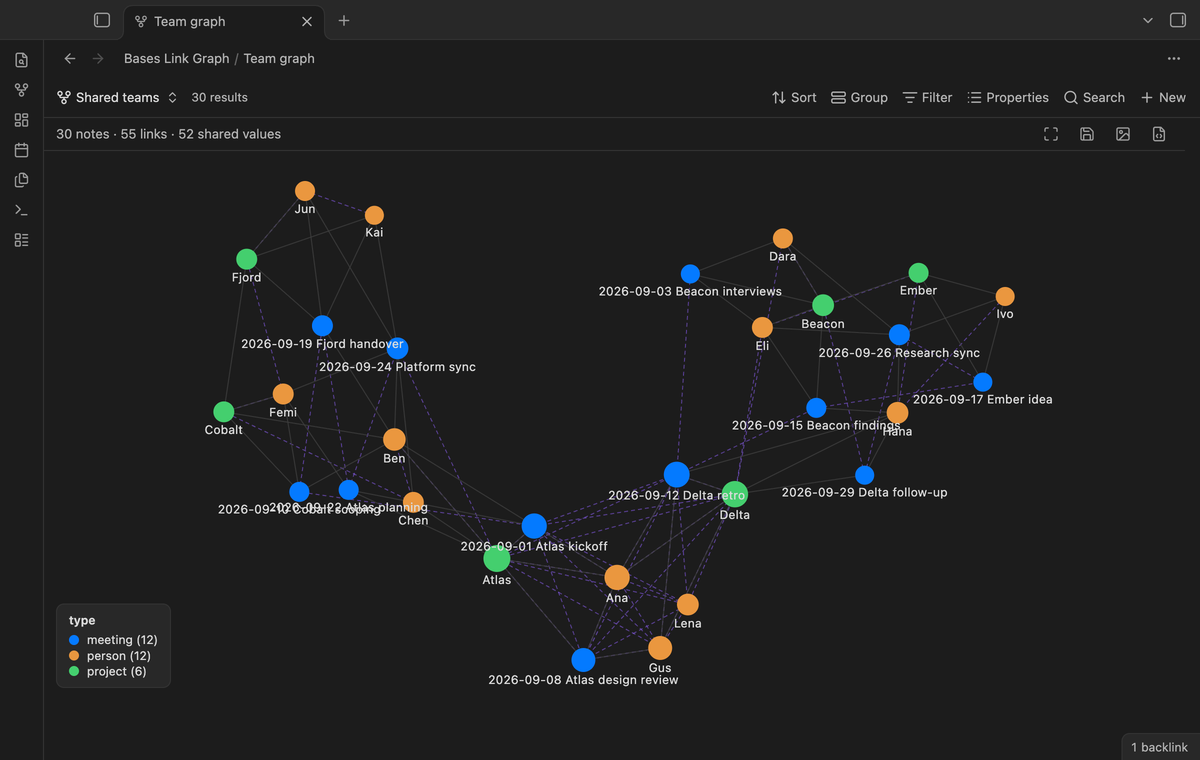
In "Join notes that share", type one or more property names, for example team or tags. Notes with the same value get a dashed edge. Case, a leading # and wikilink brackets do not matter, so [[Alpha]], alpha and [[Alpha|the alpha]] are the same value. A value that more than 12 notes share joins them in a chain, so that one common tag does not fill the view with lines.
Local depth (Pro)
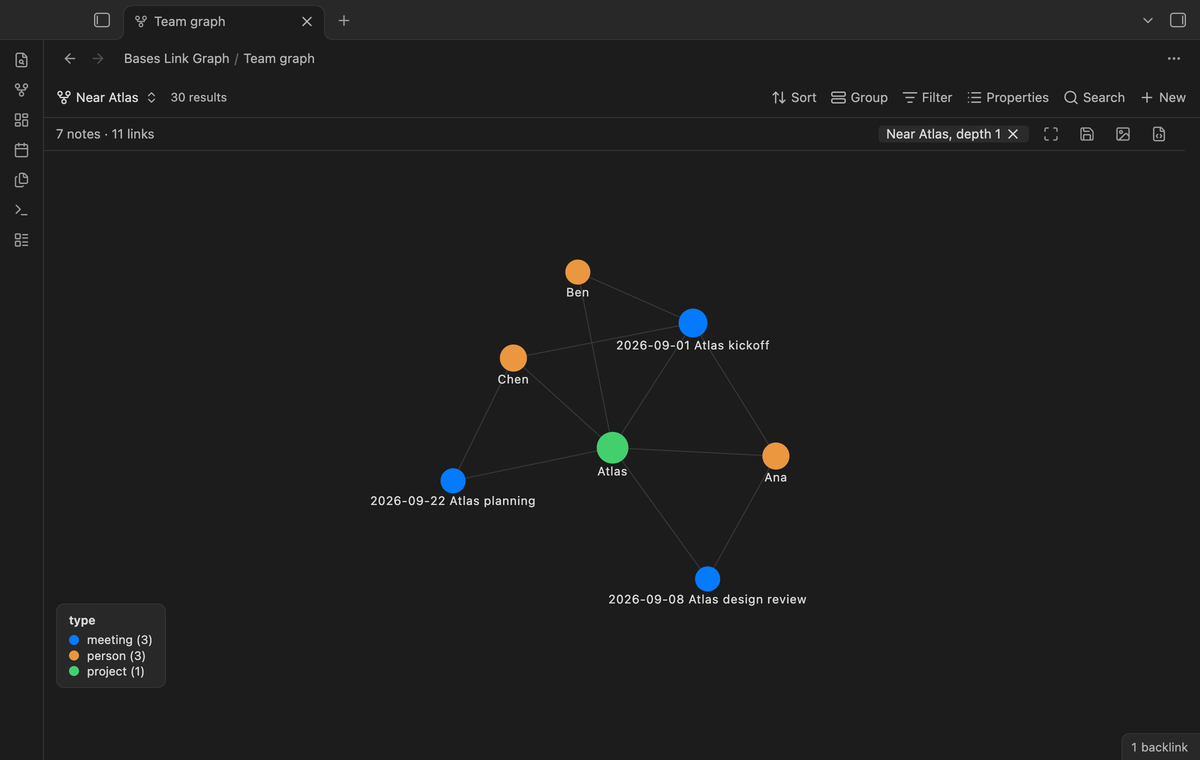
Right-click a node and select "Show only notes near this one". The graph then shows that note and the notes that are up to N edges away, in both directions. Set N with the "Local depth" slider, from 1 to 5. Select the x on the chip above the graph to show all notes again.
Export and saved layouts (Pro)
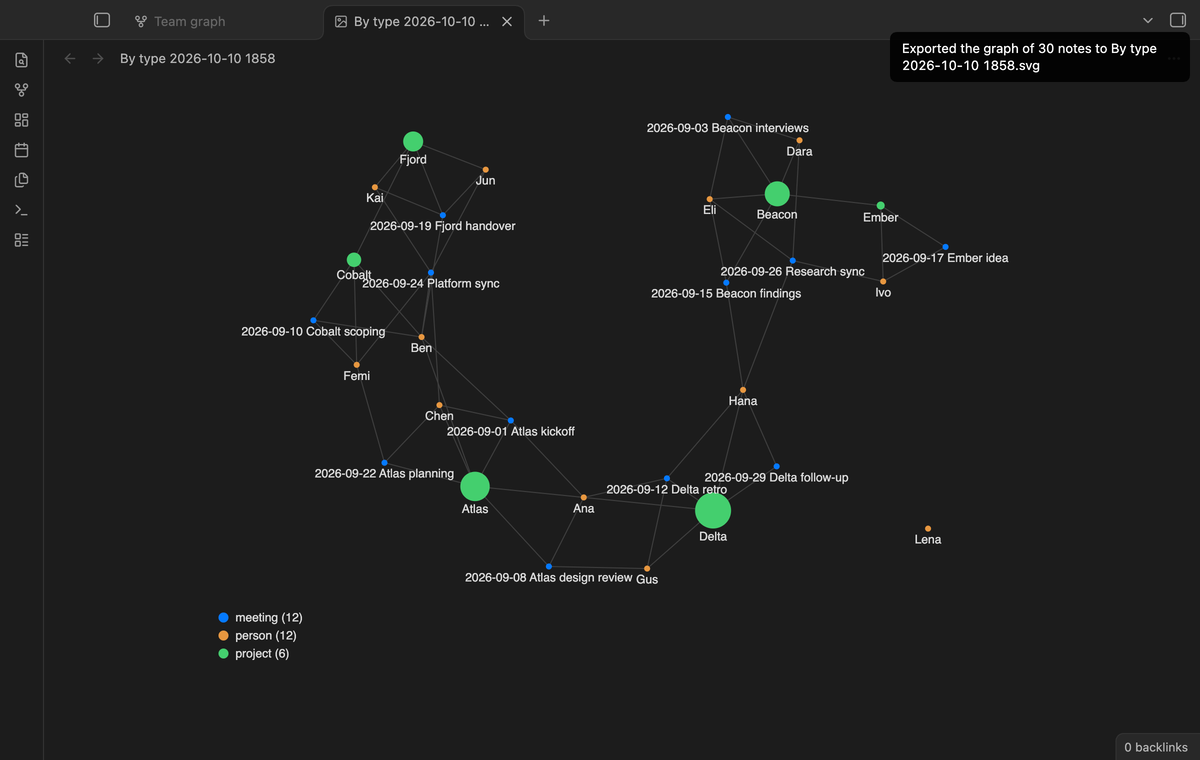
Export the graph to a PNG image or an SVG file with the buttons above the graph, or with the commands "Export the graph as a PNG image" and "Export the graph as an SVG image". The export shows the whole graph with every label. The SVG file also has the legend. Select "Save layout" to keep the place of each node in the base file, with this view. The graph then opens in the same shape each time. "Reset layout" removes the saved places.
Install
- Open "Settings → Community plugins", select "Browse" and search for "Bases Link Graph".
- Select "Install" and "Enable". The core plugin "Bases" must be on.
To install by hand, copy main.js, manifest.json and styles.css from the latest release into <vault>/.obsidian/plugins/bases-link-graph/. Then enable the plugin. You need Obsidian 1.13.4 or later.
Usage
- Create a base, or open one. Set its filters so that it selects the notes that you want to see.
- Select the view menu in the base toolbar and add a view of the type "Link graph".
- Open the view options to choose labels, the link length and, with Pro, size, color, shared values and depth.
The base limit applies: when the base shows the first 100 results, the graph has 100 nodes.
Pro
The free version draws the notes of a base with their link edges, labels, zoom, pan, drag, click to open, hover preview, embeds and live update. It has no note limit.
Pro adds node size and color by a property with a legend, edges from shared property values, the local depth filter, export to PNG or SVG, and saved layouts. To get it:
- Sponsor theluckystrike on GitHub Sponsors with $5 a month, or $15 once. When you have paid $15 in total, Pro stays on.
- In Obsidian, open the settings of Bases Link Graph and select "Sign in with GitHub".
- The plugin copies a code and opens github.com/login/device. Paste the code there and approve.
When Pro is off, the Pro options stay saved in the base file and the graph ignores them.
Settings
The view options are in the base toolbar. They are saved with each view in the base file.
| Option | What it does |
|---|---|
| Labels | When zoomed in, always, or on hover only. |
| Show notes without links | Shows or hides the notes that have no edge. |
| Link length | The distance between linked notes, from 20 to 200. |
| Size by (Pro) | A number property for the node size. Empty uses the number of links. |
| Color by (Pro) | A property for the node color, with a legend. |
| Join notes that share (Pro) | Property names whose shared values add dashed edges. |
| Local depth (Pro) | How many edges away from the chosen note to show, 0 to 5. |
The plugin settings tab has the Pro section and two settings: "Animate the layout" (on by default) and "Live update delay" (100 to 2000 ms, default 400).
FAQ
How is this different from the core graph view?
The core graph view shows the whole vault or the local graph of one note. Bases Link Graph shows exactly the notes of a base, with the base filters. The request for this is forum topic 104414.
How is this different from Graph Explorer Base View and Base Graph?
Both are free graph views for Bases. Graph Explorer Base View tracks which notes you explored and their maturity in the front matter. Base Graph can add notes outside the base up to a depth, and it has ring and layered layouts and clusters. Their READMEs (read on 2026-10-10) do not offer edges from shared values or an image export. Bases Link Graph keeps to the notes of the base and adds those two.
How fast is it?
In the end-to-end test with 500 notes and 1,490 links, the graph was built in 2 ms, the layout warm-up took about 55 ms, and one frame drew in less than 2 ms, on an M3 Pro Mac.
Does it change my notes?
No. Saved layouts and view options go in the base file. Export creates a new file.
Payment, account and network
The core features are free and stay free. Pro features need a GitHub Sponsors sponsorship of theluckystrike: $5 a month or more, or $15 once. When you have paid $15 in total, Pro stays on. Your notes stay readable and editable with or without Pro.
GitHub handles the payment. Sponsor at https://github.com/sponsors/theluckystrike. You need no account for the free features. Pro needs the GitHub account that sponsors.
Until you select "Sign in with GitHub" in the settings, Bases Link Graph makes no network requests. Sign in uses the GitHub device flow. Bases Link Graph sends its public client ID and the scope read:user to https://github.com/login/device/code and shows you a code. While you enter the code at https://github.com/login/device, it asks https://github.com/login/oauth/access_token every few seconds whether sign in is done. The scope read:user is read-only access to your profile, which GitHub needs to show the sponsorship tier. It gives no access to repositories and no write access.
After sign in, Bases Link Graph sends one query to https://api.github.com/graphql: does the signed-in account sponsor theluckystrike, at which tier, and how much it has paid theluckystrike in total. It asks again at most once every 7 days, or when you select Refresh. It sends no note content, file names or other vault data, and it has no telemetry.
Pro keeps working for 14 days without a successful check. The GitHub token stays in the secret storage of Obsidian on this device. It is not written to data.json or other vault files, so it does not sync or reach a git repository. The local storage of this device keeps your GitHub login, the tier and the time of the last check. Sign out deletes the token. You can also revoke the access in your GitHub settings, under Applications.
Support
Report bugs and ask for features in the GitHub issues of this repository. Add your Obsidian version and, if you can, a small sample base.