Stock Blocks
 sandypockets796 downloads
Display stock and crypto prices, changes, and sparkline charts in your notes with multi-stock lists and single stock charts.
- Overview
- Scorecard
- Updates24
Display stock prices, changes, and sparkline charts in your Obsidian notes with multiple display and sorting options.
Data can be displayed 2 ways:
As a compact table of multiple stocks with sparklines using the stock-block-list code block
Or as a larger detailed chart for a single stock using the stock-block code block
To learn how to set up each of those components, see the Usage Examples section below.
Security & Code Integrity
We prioritize security and transparency in this plugin:
- Zero Dependencies - No third-party libraries means a smaller attack surface and easier security auditing
- Immutable Releases - Every release is automatically built by GitHub Actions and published as an immutable GitHub release
- Verifiable Downloads - Each release lists SHA256 checksums in the release notes for integrity verification
- Transparent Build Process - All releases are built via automated GitHub Actions - no manual compilation or uploads
- Open Source - Full source code available for security review and auditing
Why Verify Downloads?
To help verify that files within a release have not been tampered with or modified, every release includes a "fingerprint" (called a SHA256 checksum) for each file.
Think of it like a tamper-evident seal - if anyone modifies even a single character in the plugin files, the fingerprint will completely change. This lets you verify that the files you downloaded are exactly the same ones that were automatically built and released, ensuring that the code you see in the repo is the same code you receive when you download the plugin.
You can compare these SHA256 checksums against your downloaded files to ensure they haven't been modified. The checksums are also displayed directly in each release's notes for easy verification.
How to Verify Downloads
After downloading the plugin files from a release, you can verify their integrity using the following command in your terminal:
sha256sum main.js manifest.json styles.css
Those commands will output a SHA256 checksum for each file. You can then compare those checksums against the values listed directly in the release notes.
Features
Multi-Currency Support
- Automatic currency detection based on stock exchange suffixes
- Supports USD, CAD, EUR, GBP, JPY, AUD, HKD
- Prices displayed with proper currency symbols ($ € £ ¥ etc.)
- Examples: AAPL (USD), SHOP.TO (CAD), SAP.DE (EUR), ASML.AS (EUR)
Cryptocurrency Support
- Display USD crypto charts using Yahoo Finance data
- Supports simple crypto inputs like BTC, ETH, SOL, DOGE, and ADA
- Resolves Yahoo's suffixed crypto symbols for assets such as PEPE, SUI, UNI, and TAO
- Uses calendar days for crypto chart periods because crypto trades seven days a week
- Preserves stock behavior, so
stock: BTCis still treated as a stock/ETF symbol whilecrypto: BTCresolves to Bitcoin USD
Stock List (stock-block-list code block)
Displays a table of multiple stock and crypto symbols with:
- Symbol (optionally as wikilinks)
- Latest price with currency symbol
- % change (green/red color coding)
- Sparkline showing recent price trend
- Sorting by symbol, price, or % change
- SVG sparklines with hover tooltip
- Optional title and description above the table
Single Stock Chart (stock-block code block)
Displays a larger chart for one stock or crypto symbol with:
- Header: symbol, price with currency, % change
- Subtitle: range (min–max) over selected period with currency
- SVG line chart or candlestick chart with hover tooltip
- Optional axes showing price values and dates
Chart Types
The plugin supports two chart types for single stock displays:
- Line Chart (default): Shows price movement as a connected line
- Candlestick Chart: Shows OHLC (Open, High, Low, Close) data as traditional candlestick bars
To enable candlestick charts, add useCandles: true to your stock block configuration.
Smart Business Day Handling
When enabled in settings (enabled by default), the days parameter represents trading days rather than calendar days. The plugin ensures sufficient data points for meaningful charts, even for very short periods (1-2 days)
Usage Examples
Learn how to display a list of stocks and cryptos, or a chart for a single symbol.
Stock List
The minimum configuration now only requires a list of stocks, which defaults to the last 30 days.
```stock-block-list
stocks: AAPL, MSFT, NVDA, SHOP, SPY
```
If you need more customization, you can use additional properties:
stocks,symbols, ortickers: Comma-separated list of stock symbols (any of these property names work)cryptoorcryptos: Comma-separated list of crypto symbols to quote in USDquoteCurrency: Crypto quote currency (currently onlyUSD, default: USD)days: Number of days of historical data (default: 30, interpreted as business days if enabled in settings)width: Width of sparklines in pixels (default: 500, capped at 120 for table display)height: Height of sparklines in pixels (default: 300, capped at 40 for table display)linkStyle: How to display symbols -none,wikilink, ormarkdown(default: none)sparkline: Whether to show sparkline charts in the table (default: true)showTodayChange: Show today's change as separate column when days >= 2 (default: false)refreshInterval: Auto-refresh interval in minutes (optional)title: Custom title text (optional, defaults to "Stock List")description: Descriptive text shown below the title (optional)
Single Stock Chart
The minimum configuration now only requires a stock property. The date range defaults to the last 30 days.
```stock-block
stocks: AAPL
```
Single Crypto Chart
Use the crypto property for cryptocurrencies. Crypto charts currently use USD quotes from Yahoo Finance.
```stock-block
crypto: BTC
quoteCurrency: USD
```
For crypto symbols that Yahoo stores with a CoinMarketCap suffix, such as PEPE or SUI, the plugin resolves the Yahoo symbol automatically.
You can also use cryptos for a single crypto chart. If multiple crypto symbols are provided in a stock-block, the first symbol is charted.
Mixed Stock and Crypto List
Stock lists can include stocks and cryptos in the same table. Stocks render first by default, followed by cryptos; sorting applies across all rows.
```stock-block-list
stocks: AAPL, MSFT, NVDA
cryptos: BTC, ETH, SOL
quoteCurrency: USD
```
Candlestick Chart
To display OHLC (Open, High, Low, Close) data as a candlestick chart, add useCandles: true:
```stock-block
stock: AAPL
useCandles: true
```
Full Configuration
If you need more customization, you can use additional properties:
symbol,symbols,stock,stocks,ticker, ortickers: Stock symbol to display (any of these property names work)cryptoorcryptos: Crypto symbol to display, quoted in USD. If multiple are provided in a single chart, the first symbol is used.quoteCurrency: Crypto quote currency (currently onlyUSD, default: USD)useCandles: Display as candlestick chart instead of line chart (default: false)days: Number of days of historical data (default: 30, interpreted as business days if enabled in settings)width: Width of chart in pixels (default: 500)height: Height of chart in pixels (default: 300)showAxes: Show price and date axes (default: true)refreshInterval: Auto-refresh interval in minutes (optional)showLastUpdate: Show last update timestamp and refresh controls (default: true)showTodayChange: Show today's change alongside period change when days >= 2 (default: false)title: Custom title text (optional, shows above the stock symbol and price)description: Descriptive text shown below the title (optional)
International Stocks and Currency Examples
The plugin automatically detects currencies based on stock exchange suffixes:
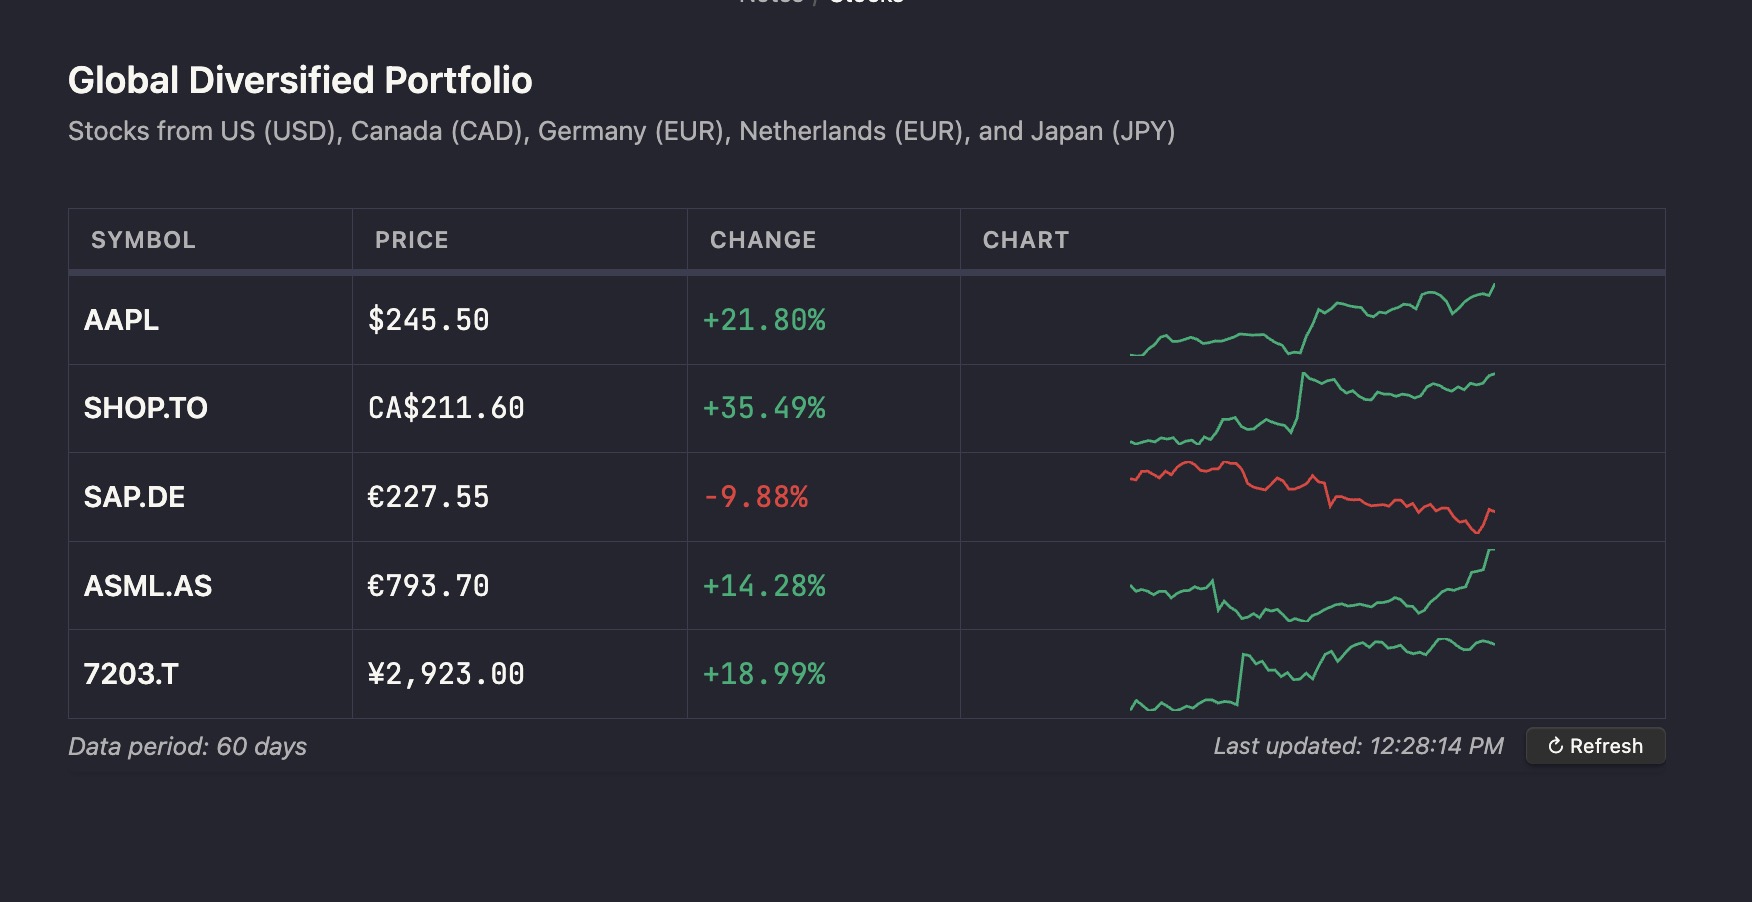
```stock-block-list
tickers: AAPL, SHOP.TO, SAP.DE, ASML.AS, 7203.T
days: 60
title: Global Diversified Portfolio
description: Stocks from US (USD), Canada (CAD), Germany (EUR), Netherlands (EUR), and Japan (JPY)
```
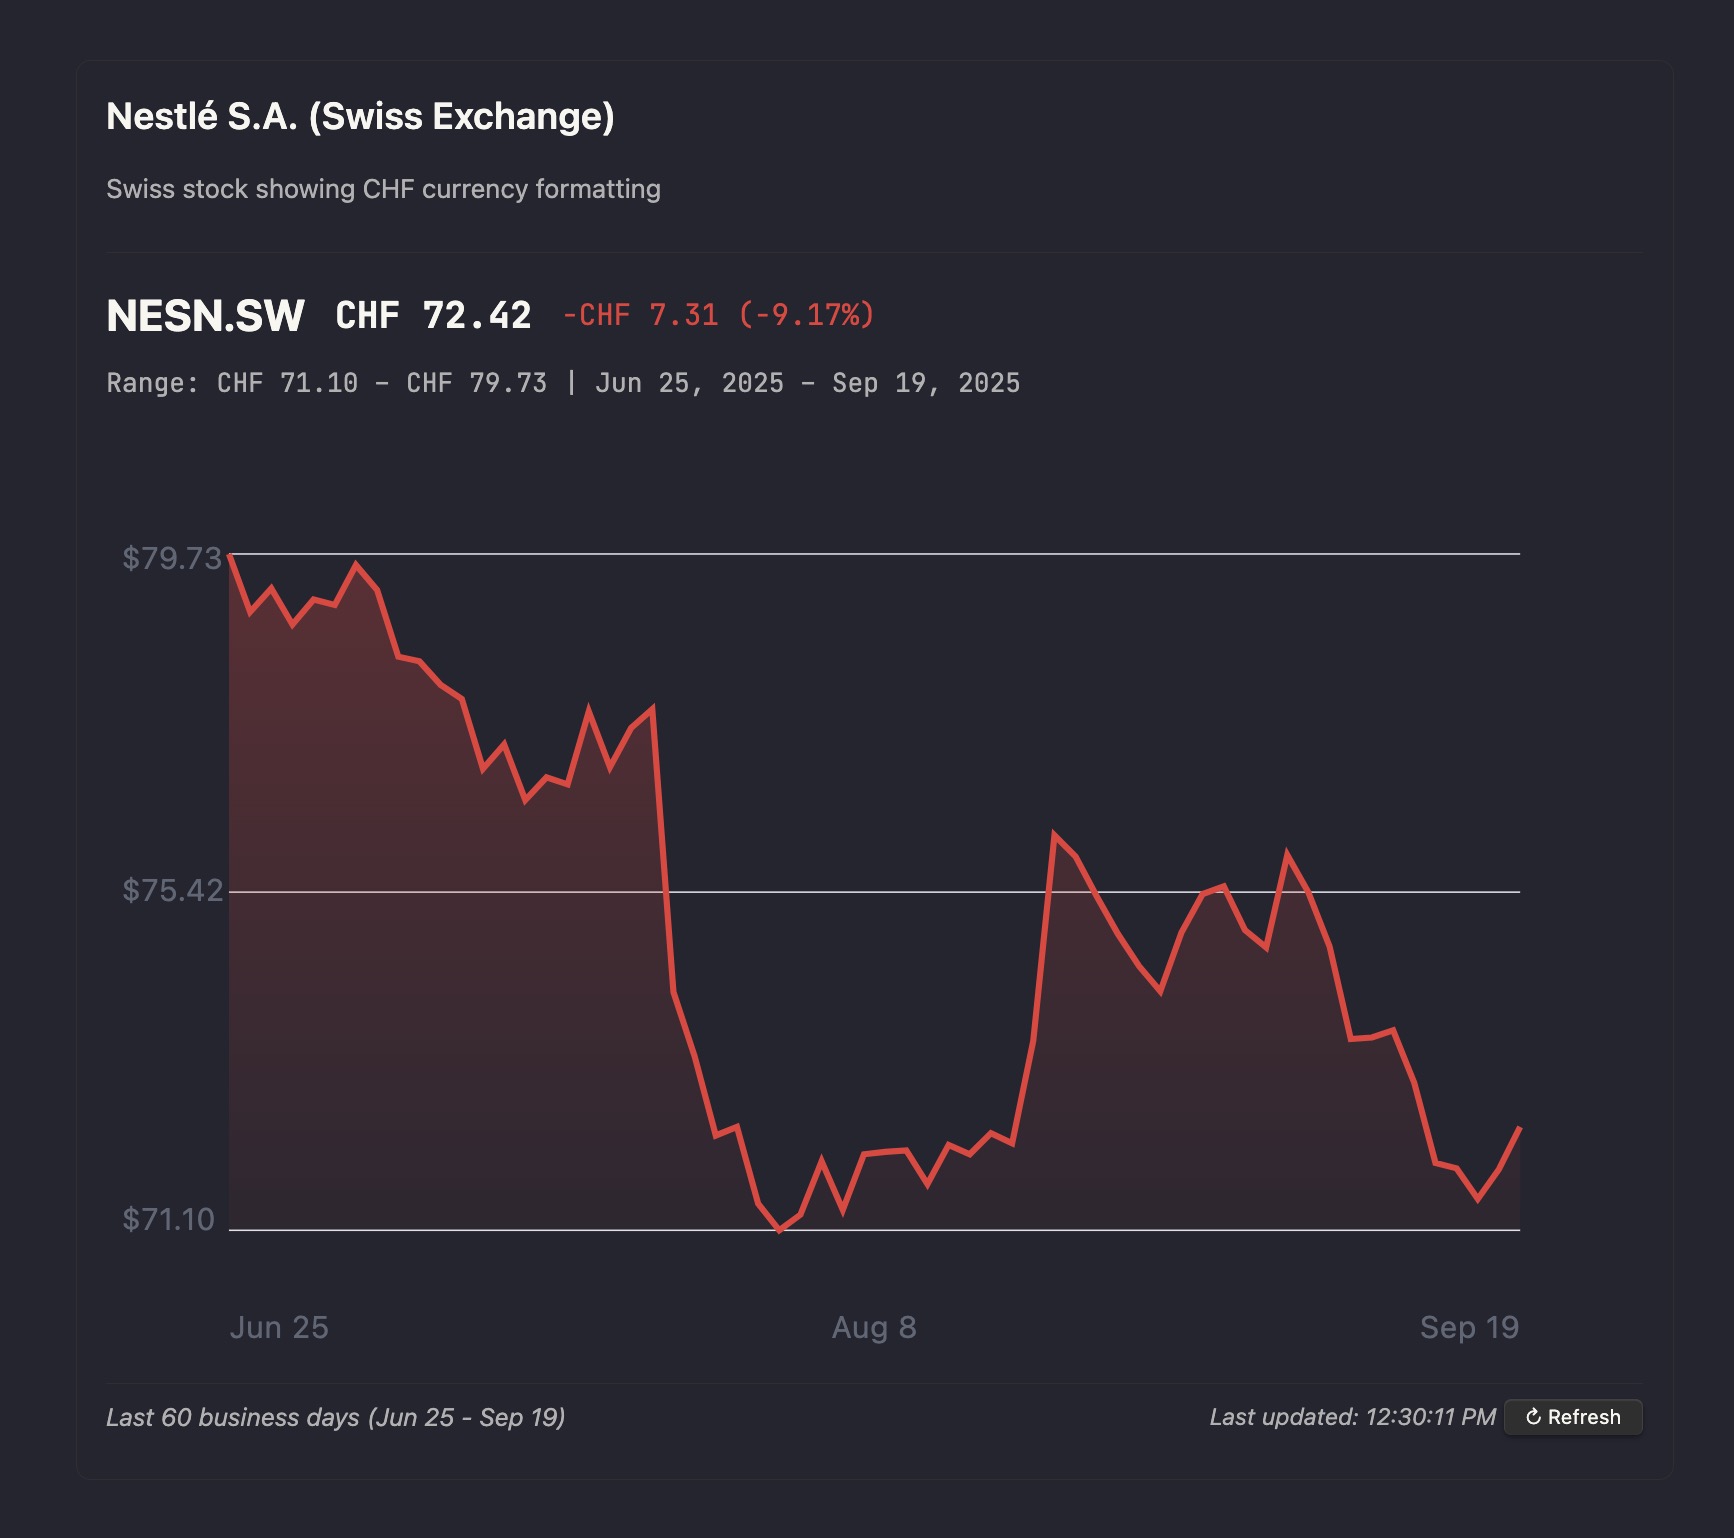
```stock-block
symbol: NESN.SW
days: 60
title: Nestlé S.A. (Swiss Exchange)
description: Swiss stock showing CHF currency formatting
```
Currency Detection Examples:
AAPL→ USD ($)SHOP.TO→ CAD (CA$)SAP.DE→ EUR (€)BP.L→ GBP (£)7203.T→ JPY (¥)CBA.AX→ AUD (A$)0700.HK→ HKD (HK$)
Data Source
The plugin fetches real stock and crypto data from Yahoo Finance API, which provides free access to:
- Current stock prices
- Current crypto prices in USD
- Historical price data
- Daily trading information
- Support for stocks, ETFs, major indices, and cryptocurrencies
Features:
- No API key required
- Automatic caching to reduce API calls
- Scoped refreshes that update only the symbols in the current block
- Partial stock list results when one symbol fails, with successful rows kept visible
- Failed refreshes keep the last successful data visible while showing the refresh error
- Clear error messages when Yahoo Finance is unavailable
- Real-time data updates when notes are opened
Supported Symbols:
- US Stocks: AAPL, MSFT, GOOGL, TSLA, etc.
- ETFs: SPY, QQQ, VTI, VOO, etc.
- Indices: ^GSPC (S&P 500), ^IXIC (NASDAQ), ^DJI (Dow Jones)
- Cryptos: BTC, ETH, SOL, DOGE, ADA, LINK, PEPE, SUI, UNI, TAO, etc. using
crypto:orcryptos:for either one symbol or many symbols.
Crypto Notes:
- Crypto support is USD-only in this version.
- Yahoo Finance uses symbols like
BTC-USDfor many assets, but some assets use suffixed symbols likePEPE24478-USD; the plugin resolves those automatically. - Use
crypto: BTCfor Bitcoin. Barestock: BTCkeeps the existing stock/ETF behavior.
The plugin automatically handles API errors and will display clear error messages if the Yahoo Finance service is temporarily unavailable.
Beta testing
To test the newest versions of the plugin before official releases, you can install the beta builds using the BRAT plugin.
- Install the BRAT plugin from the Obsidian Community Plugins.
- In Obsidian, open the BRAT plugin settings.
- Click Add Beta plugin.
- Enter the repository URL:
https://github.com/sandypockets/stock-blocks
This will cause the plugin to automatically update whenever there are changes made to the main branch of this repository. If you want to pin to a specific version, then you can also do that in BRAT. To do so, look for Add Beta plugin with frozen version in the BRAT settings.
You can learn more about BRAT and how to use it in the BRAT documentation.
Development
Setup
git clone https://github.com/sandypockets/stock-blocks.git
cd stock-blocks
npm install
Building
# Development build with watch mode (recommended during development)
npm run dev
npm run build
Contributing
Contributions are welcome! Please follow these steps:
- Fork the repository
- Create a feature branch:
git checkout -b feature/name-of-your-feature - Make your changes in TypeScript (
main.tsandsrc/files) - Test your changes:
- Run
npm run devfor development builds with watch mode - Copy the built files to a test vault and verify functionality
- Run
- Run
npm run buildto ensure production build works - Submit a pull request
License
See LICENSE file for details.
Disclaimer
This plugin is for educational and informational purposes only. Stock and crypto data is provided by Yahoo Finance and should not be used as the sole basis for investment decisions. Always consult with financial professionals and verify data with official sources before making investment decisions. If the Yahoo Finance API is unavailable, the plugin will display error messages.