
- Overview
- Scorecard
- Updates3
This plugin integrates FunctionPlot to use LaTeX to plot multiple graphs or vectors in Obsidian for better visualisation in Math and Physics concepts
Generating Graph
- Select a LaTeX equation (with or without the $ is fine)
- Use the command "Generate Graph" to generate the graph
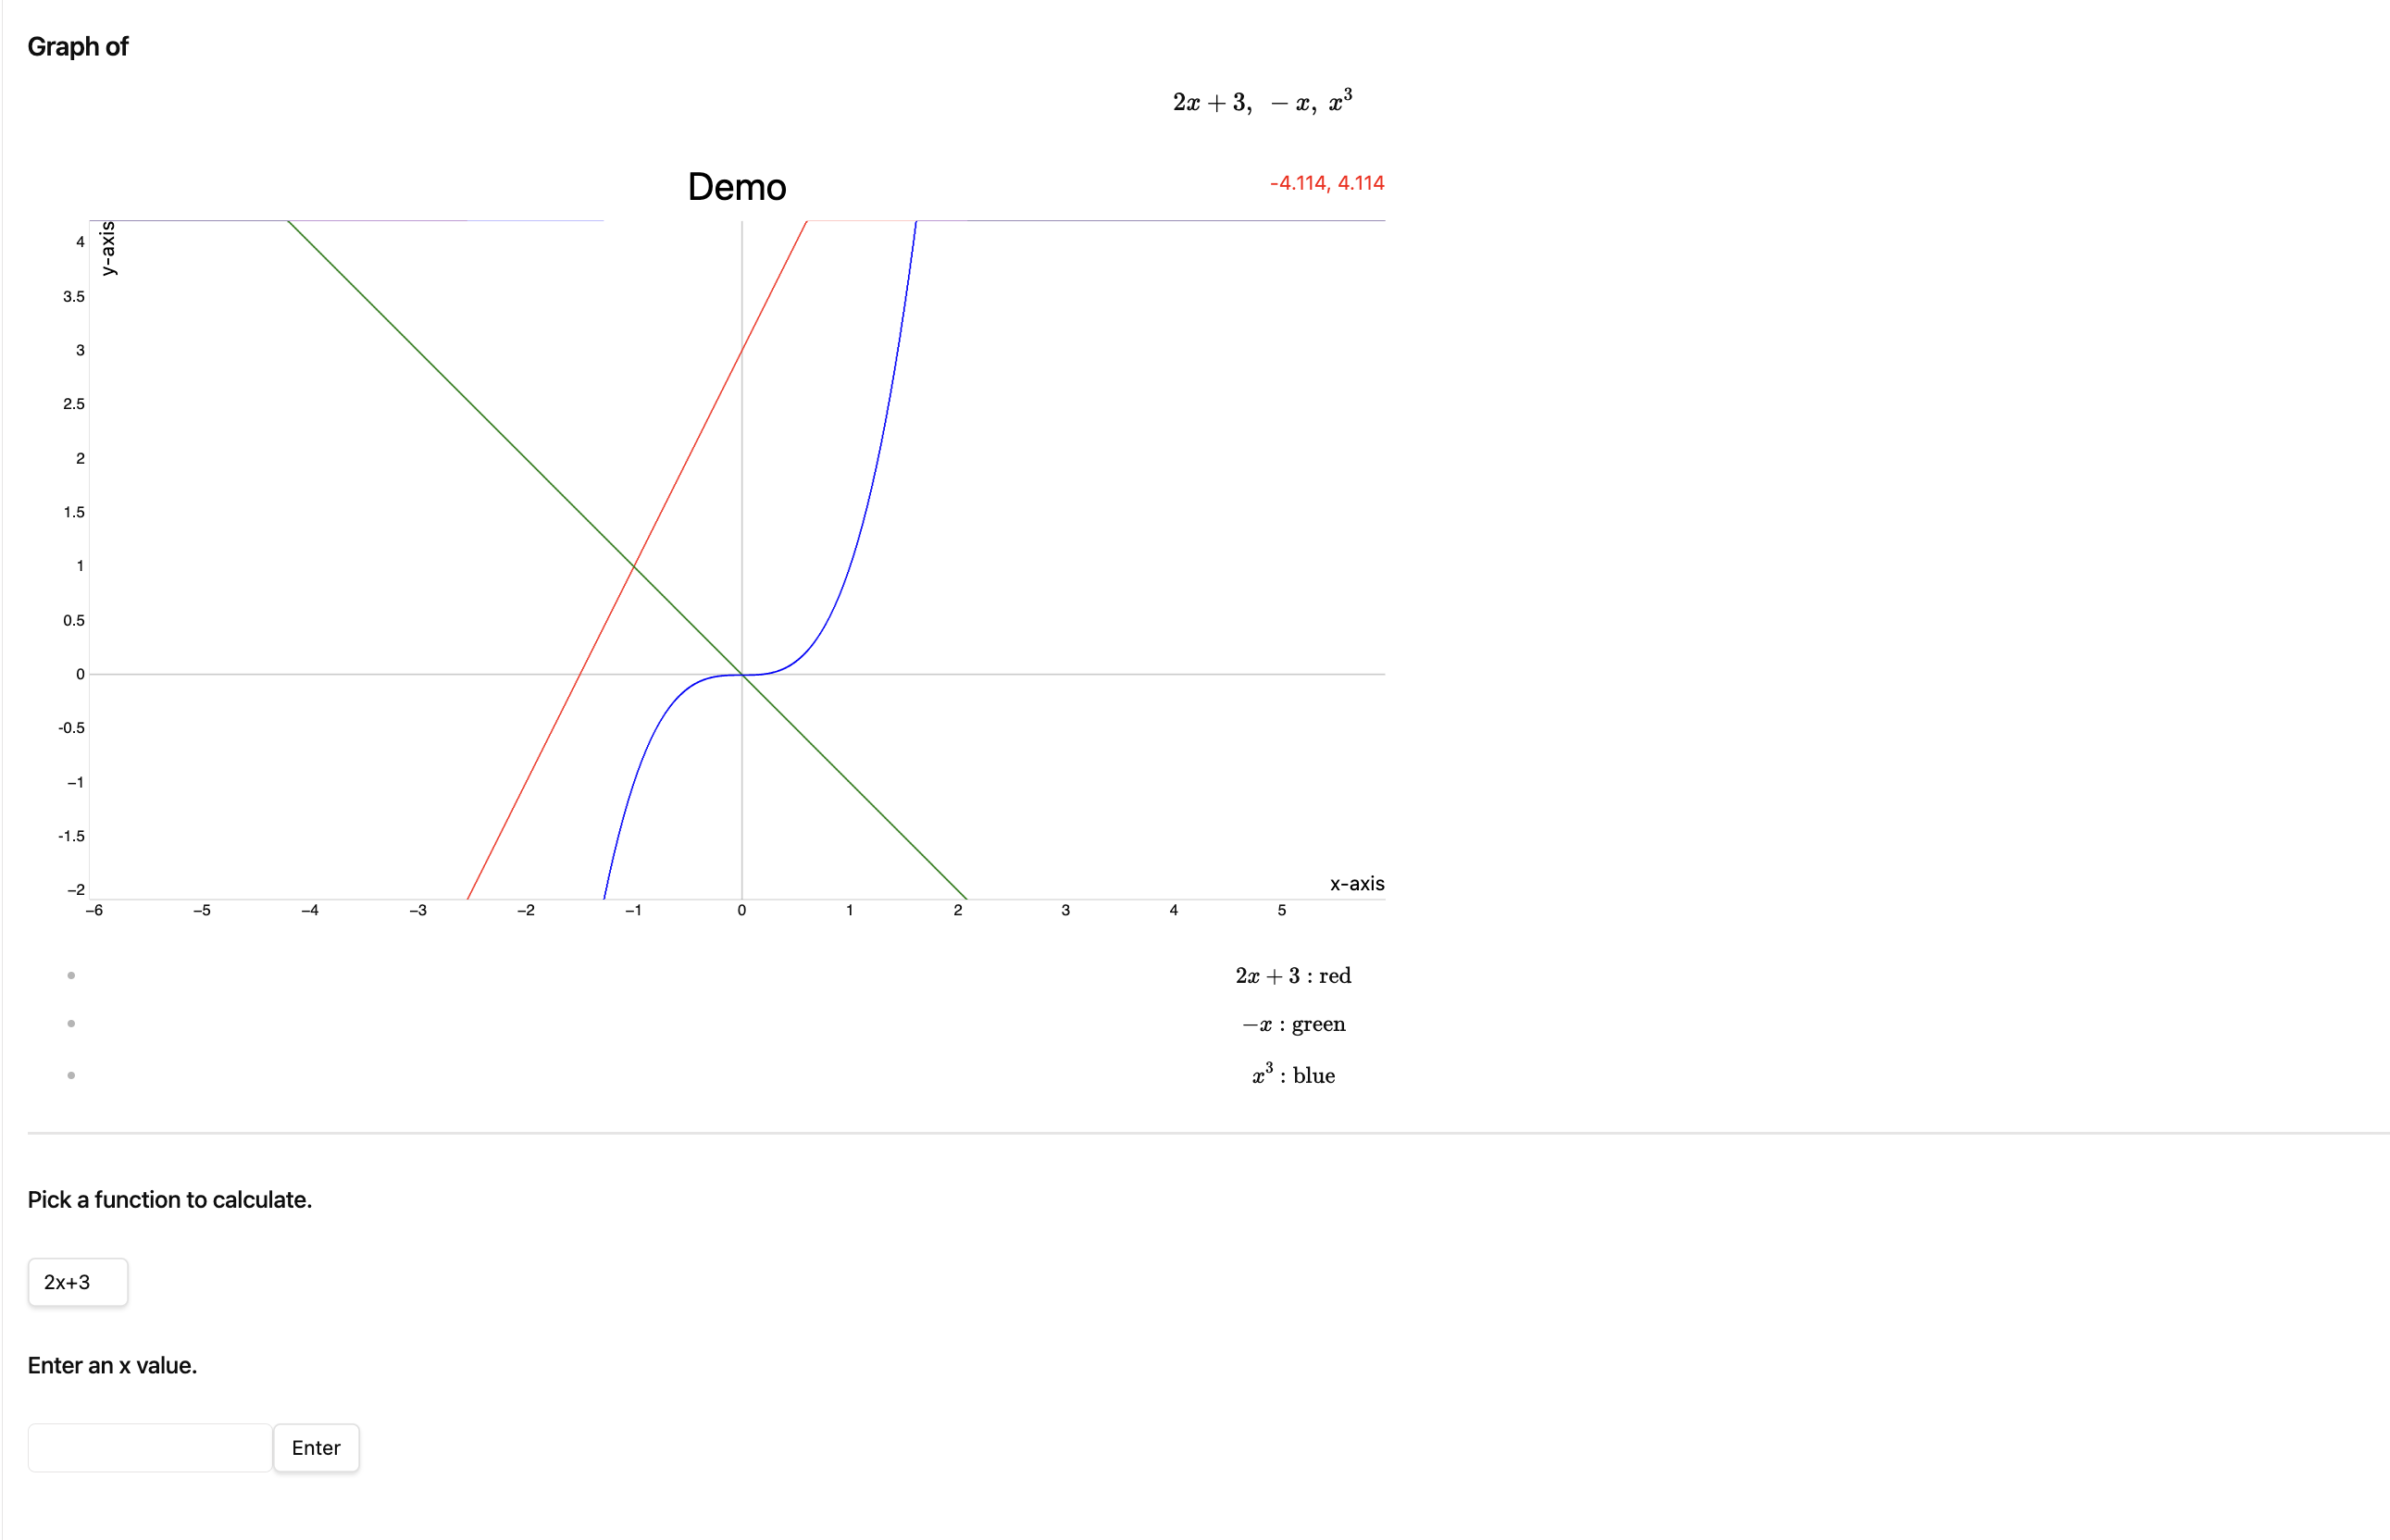
- A new page will be opened with the function to plot, the graph, a function to calculate the value of y of the function given its x value, and colour coding of the graphs
- Demo:
Drawing Vectors
- Select a LaTeX equation of a vector (with or without the $ is fine)
- If you are unsure on how to write vectors in LaTeX, this link may be helpful
- E.g. \vec{AB} = \begin{pmatrix} 1 \ 2 \end{pmatrix}
- Note: There has to be a \vec, \overrightarrow would not work here
- Use the command "Draw Vector" to generate the vector graph
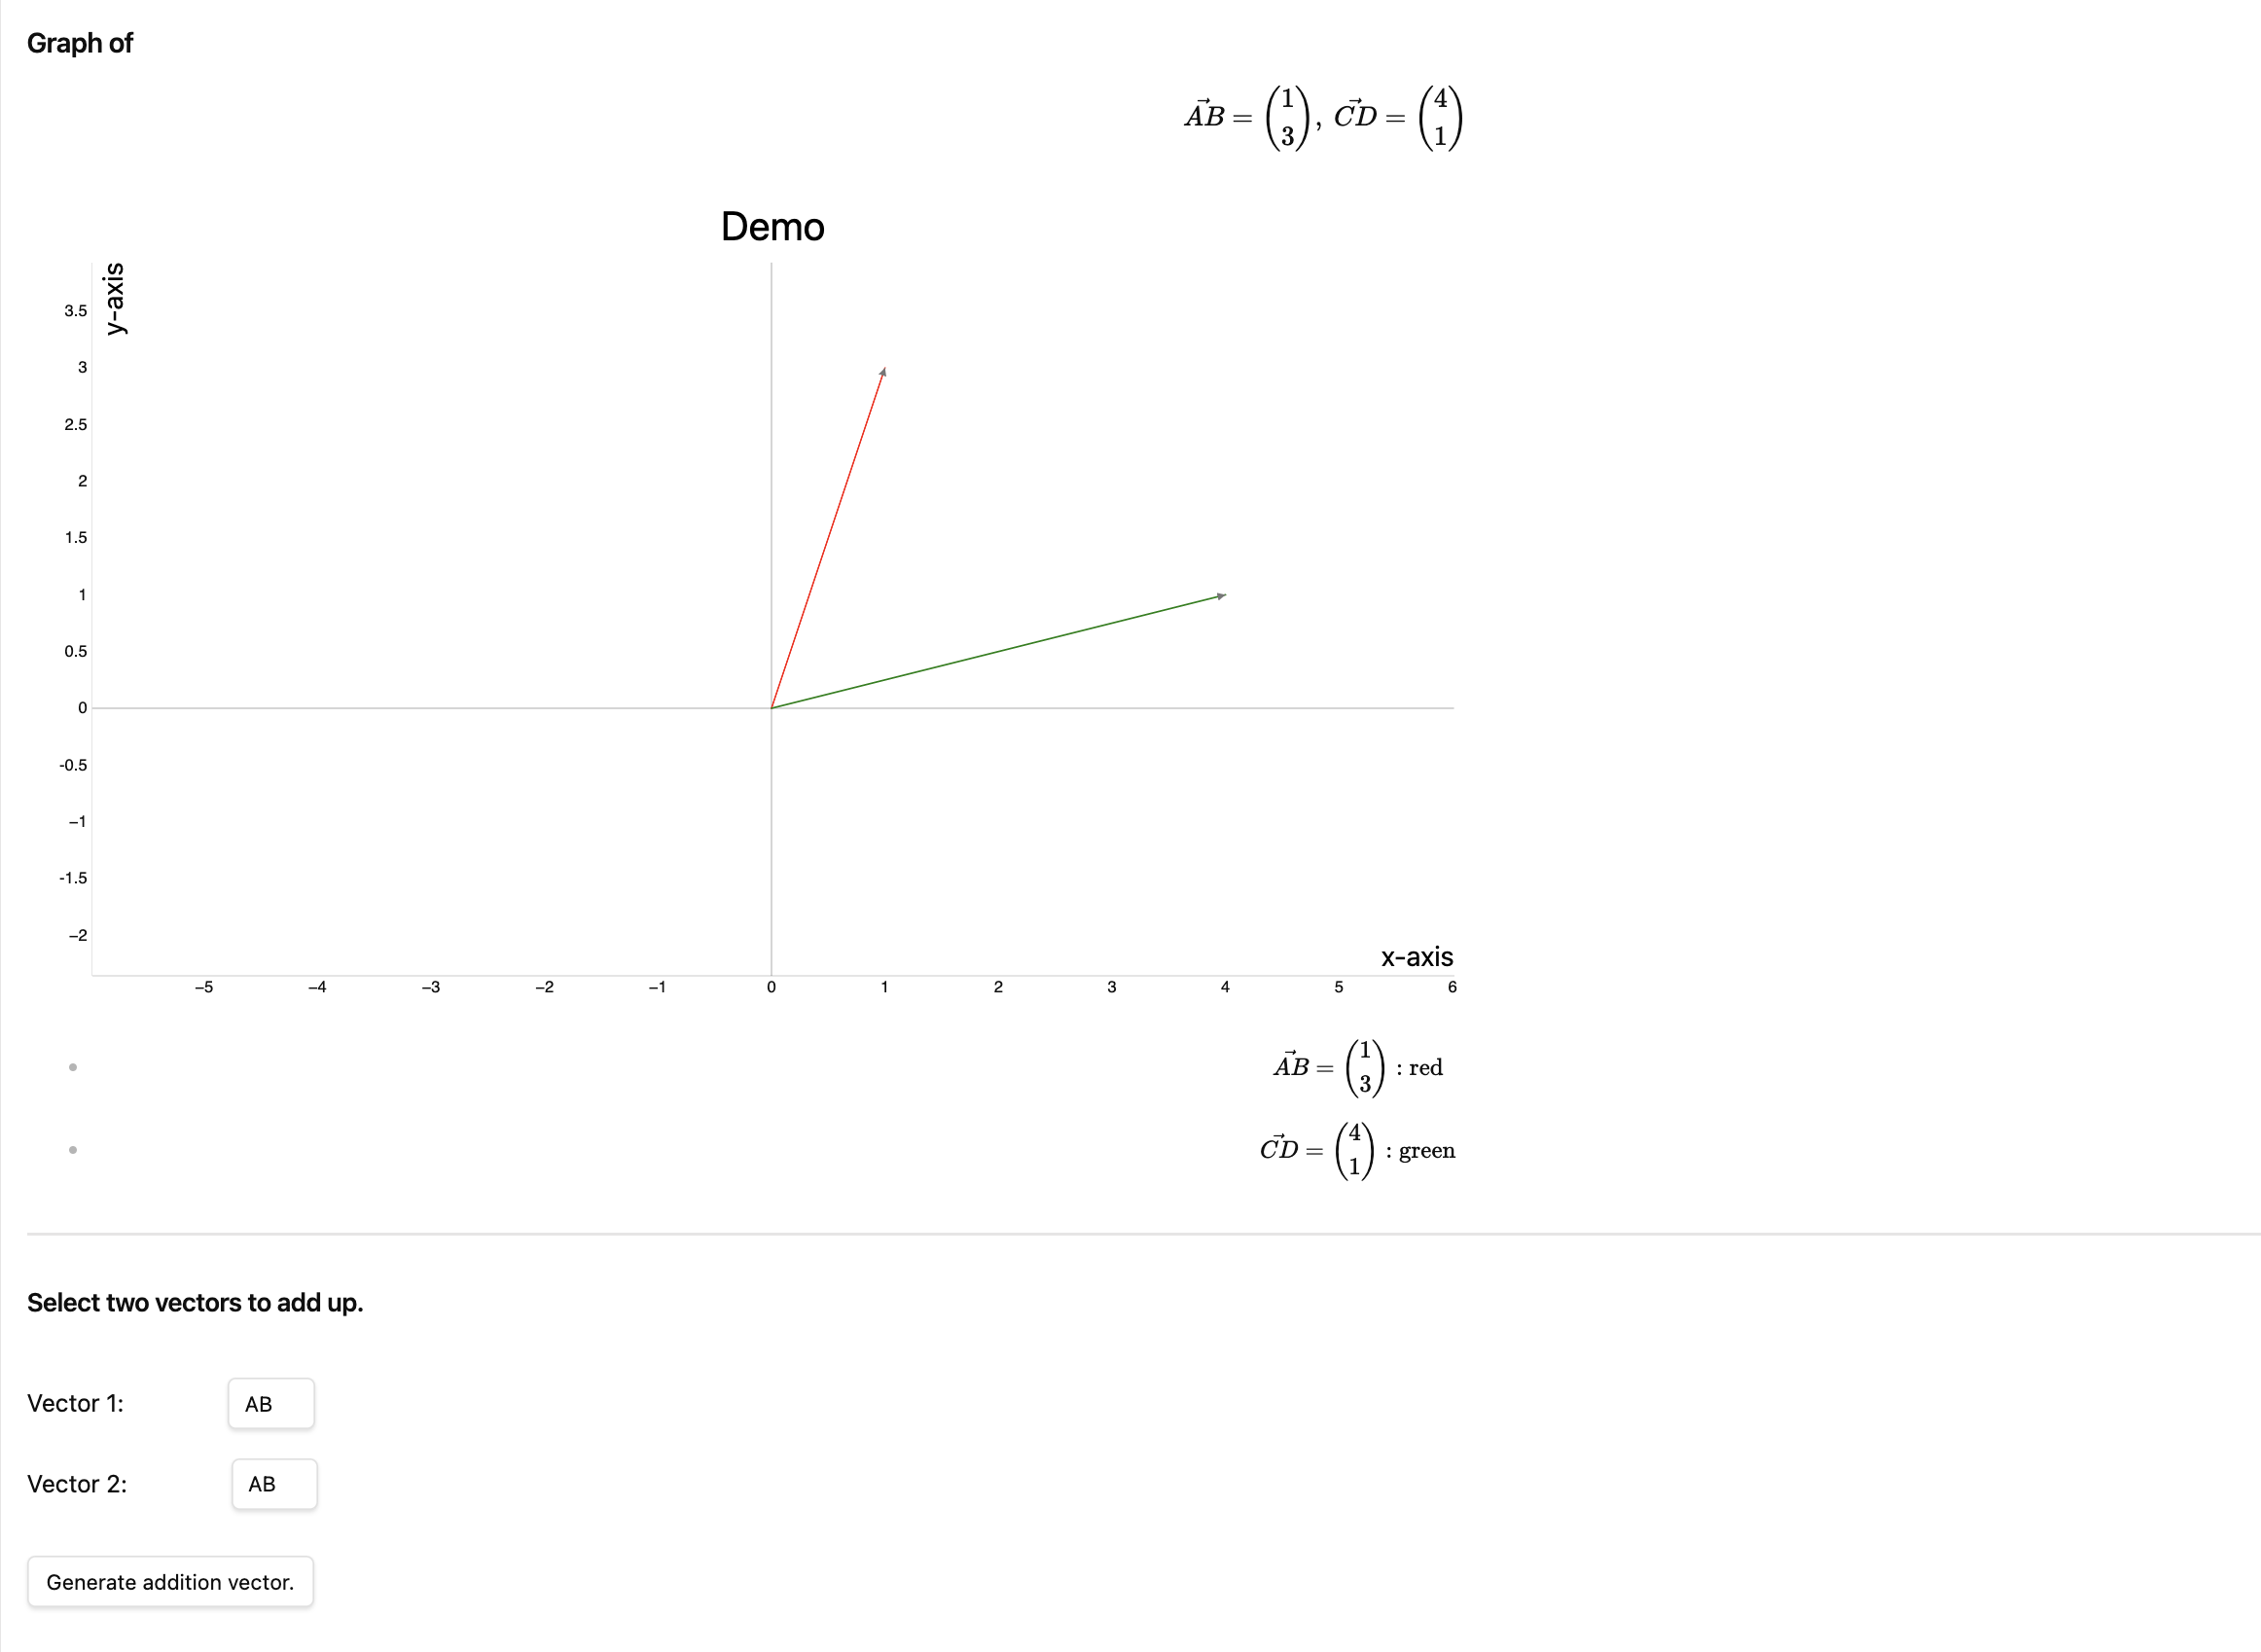
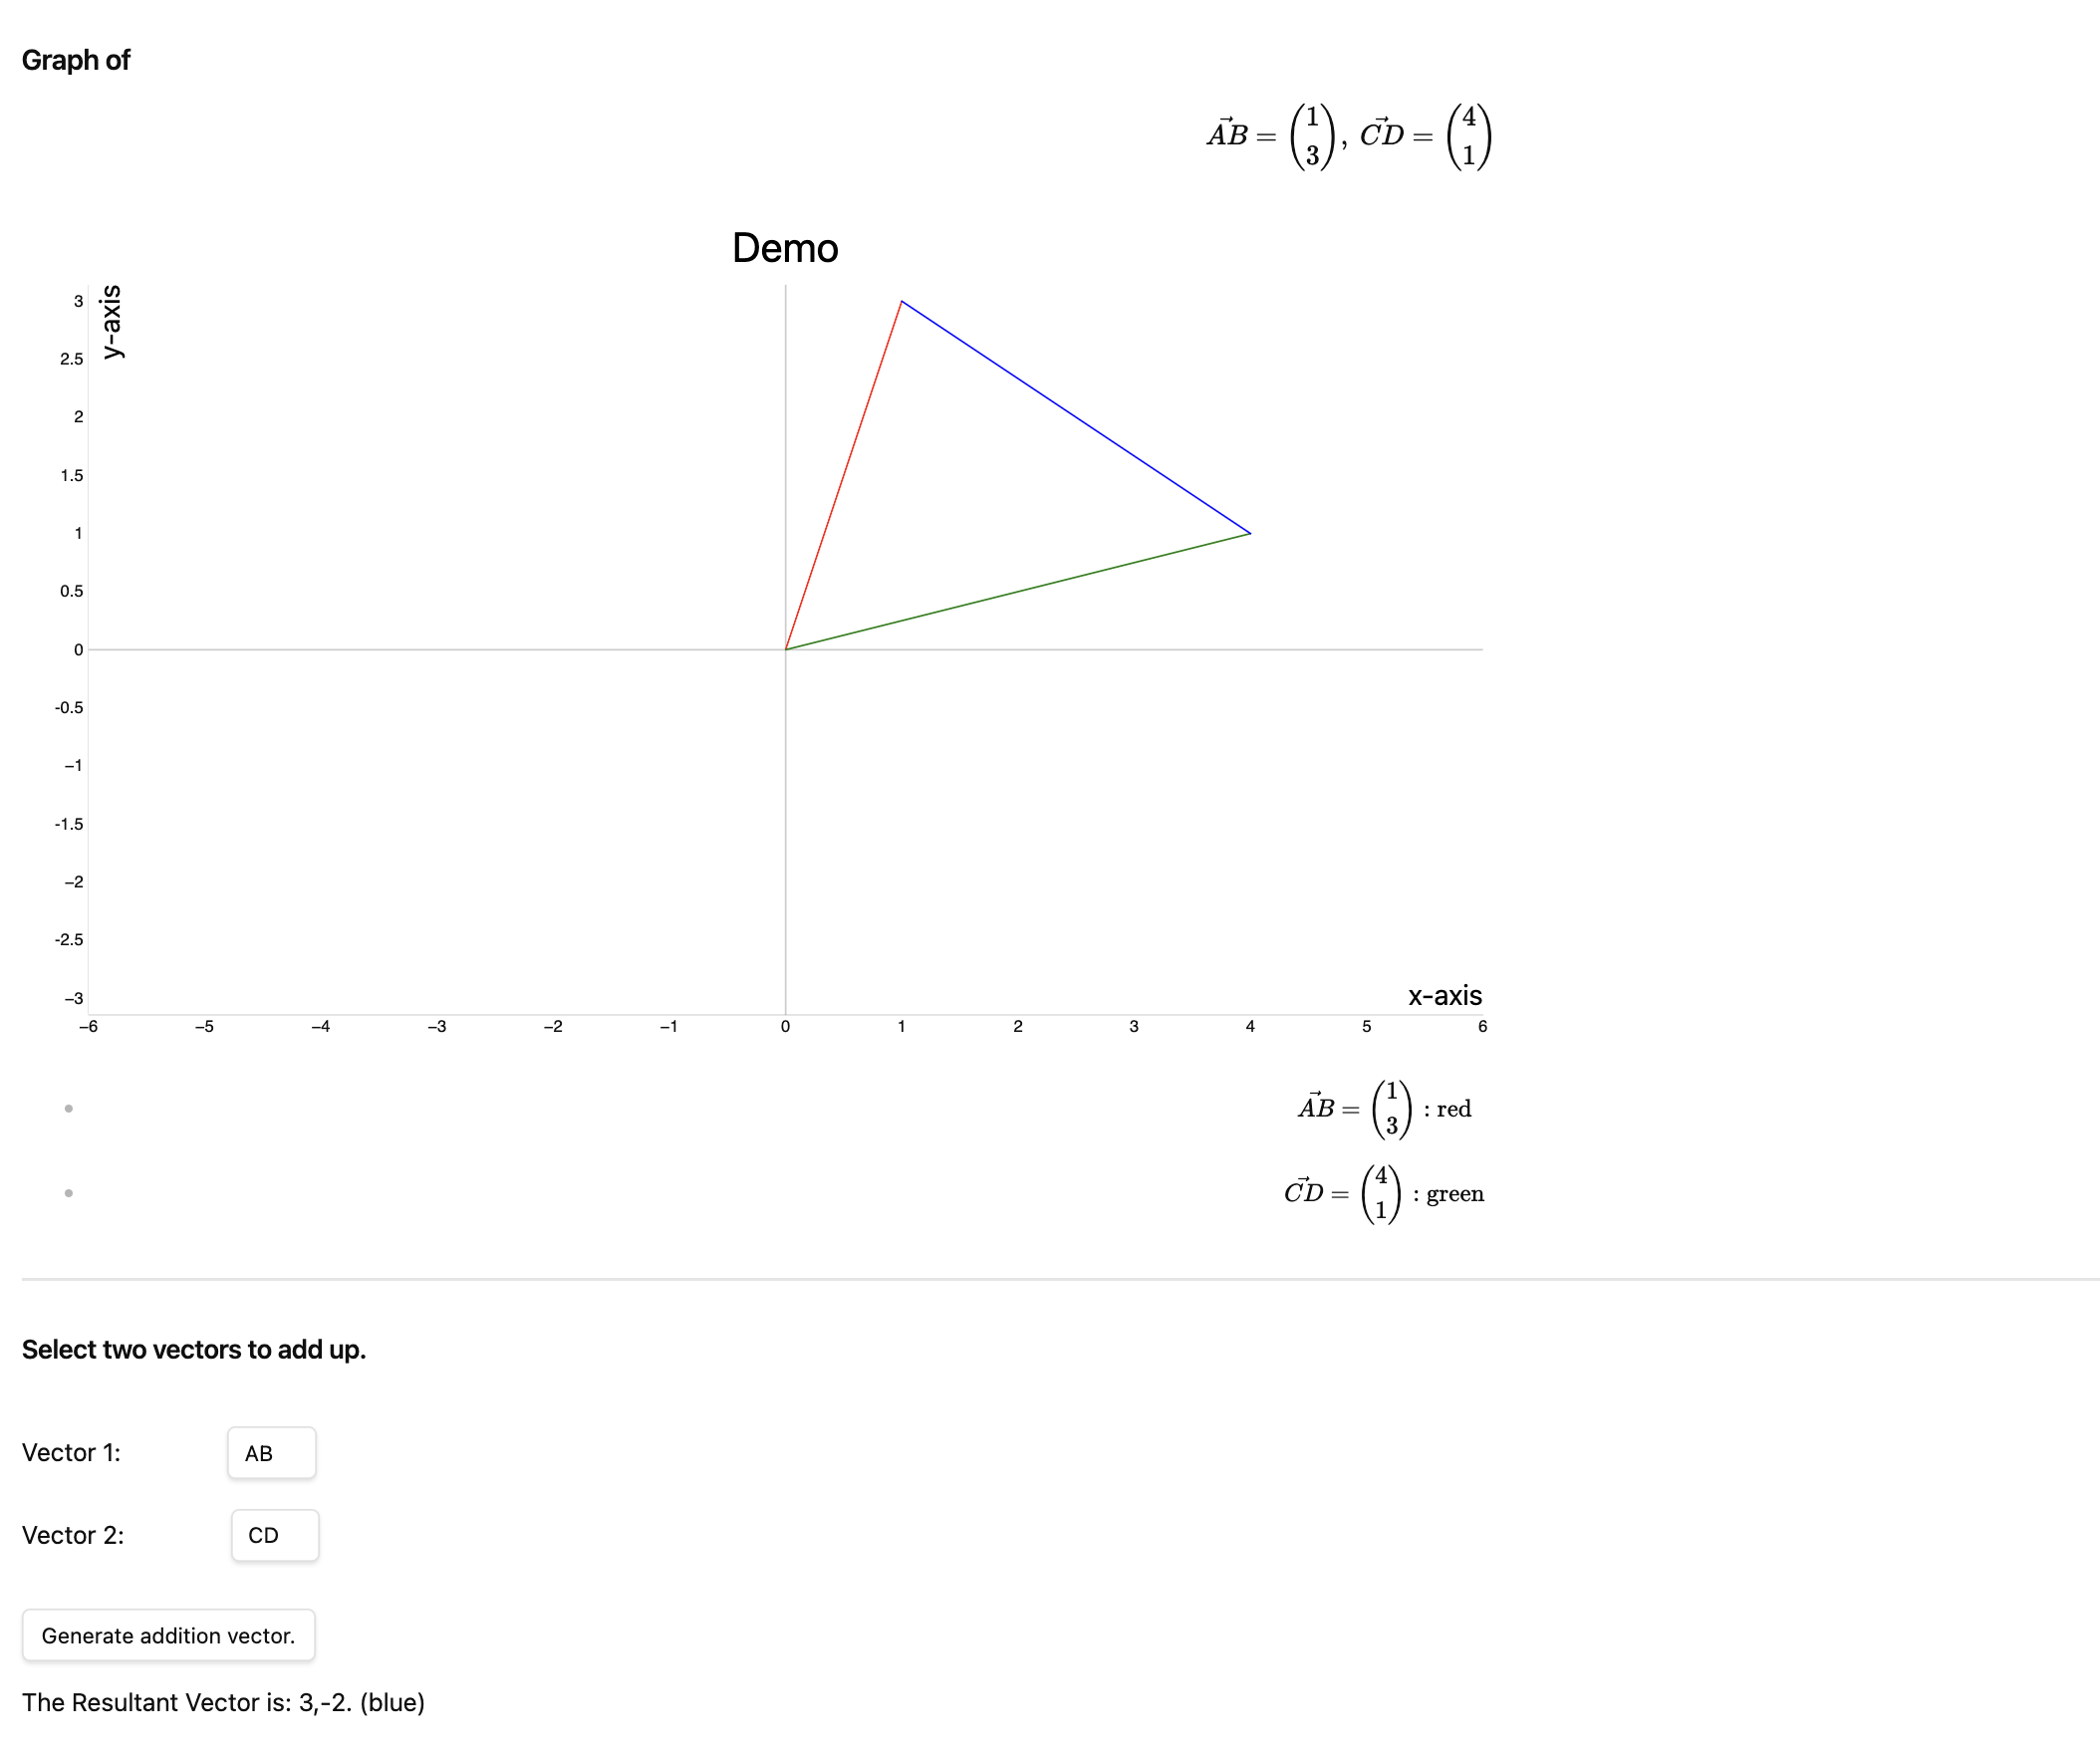
- A new page will be opened with the equation, the graph, a function to add two vectors and generate the resultant vector, and colour coding of the vectors
Demo:
Demo of addition vector:
Multiple Graphs/Vectors
- To generate multiple graphs or vectors, add "\newline" in between the functions in the LaTeX equation.
Options
In the settings, you may change the
- x & y axis labels
- title
- width & height
- grid visibility
- ability to zoom
68%
HealthFair
ReviewCaution
About
Plot LaTeX equations and vectors directly in Obsidian using FunctionPlot. Generate a new page with rendered graphs or vector diagrams, built-in y(x) evaluators, color-coded traces, vector addition/resultant support, and multiple-expression handling via \newlineDetails
Current version
1.0.1
Last updated
2 years ago
Created
2 years ago
Updates
3 releases
Downloads
1k
Compatible with
Obsidian 1.5.12+
Platforms
Desktop only
License
MIT
Author