Markdown Mindmap
 Kiko Castro1k downloads
Render configurable mind maps / leveled trees from your notes' frontmatter links. Define each map in a ```mindmap code block.
- Overview
- Scorecard
- Updates12

Draw your notes, live. Markdown Mindmap reads the links you already keep in your notes' frontmatter and renders them — as a leveled mind map, a gantt chart, a kanban board, or a causal-loop diagram. There is no second copy of the data to maintain: every map is rebuilt from your notes each time you open it, so the picture can't drift from the source.
A map is one fenced code block, so you can drop as many as you like anywhere in your vault. There are two kinds:
```mindmap— a leveled left-to-right tree, switchable between map, gantt, and kanban views of the same notes.```causalmap— a causal-loop diagram for systems thinking, with feedback loops detected automatically.
Point a block at some folders, name the frontmatter field that links each note to its parent, and it draws the graph.
Screenshots
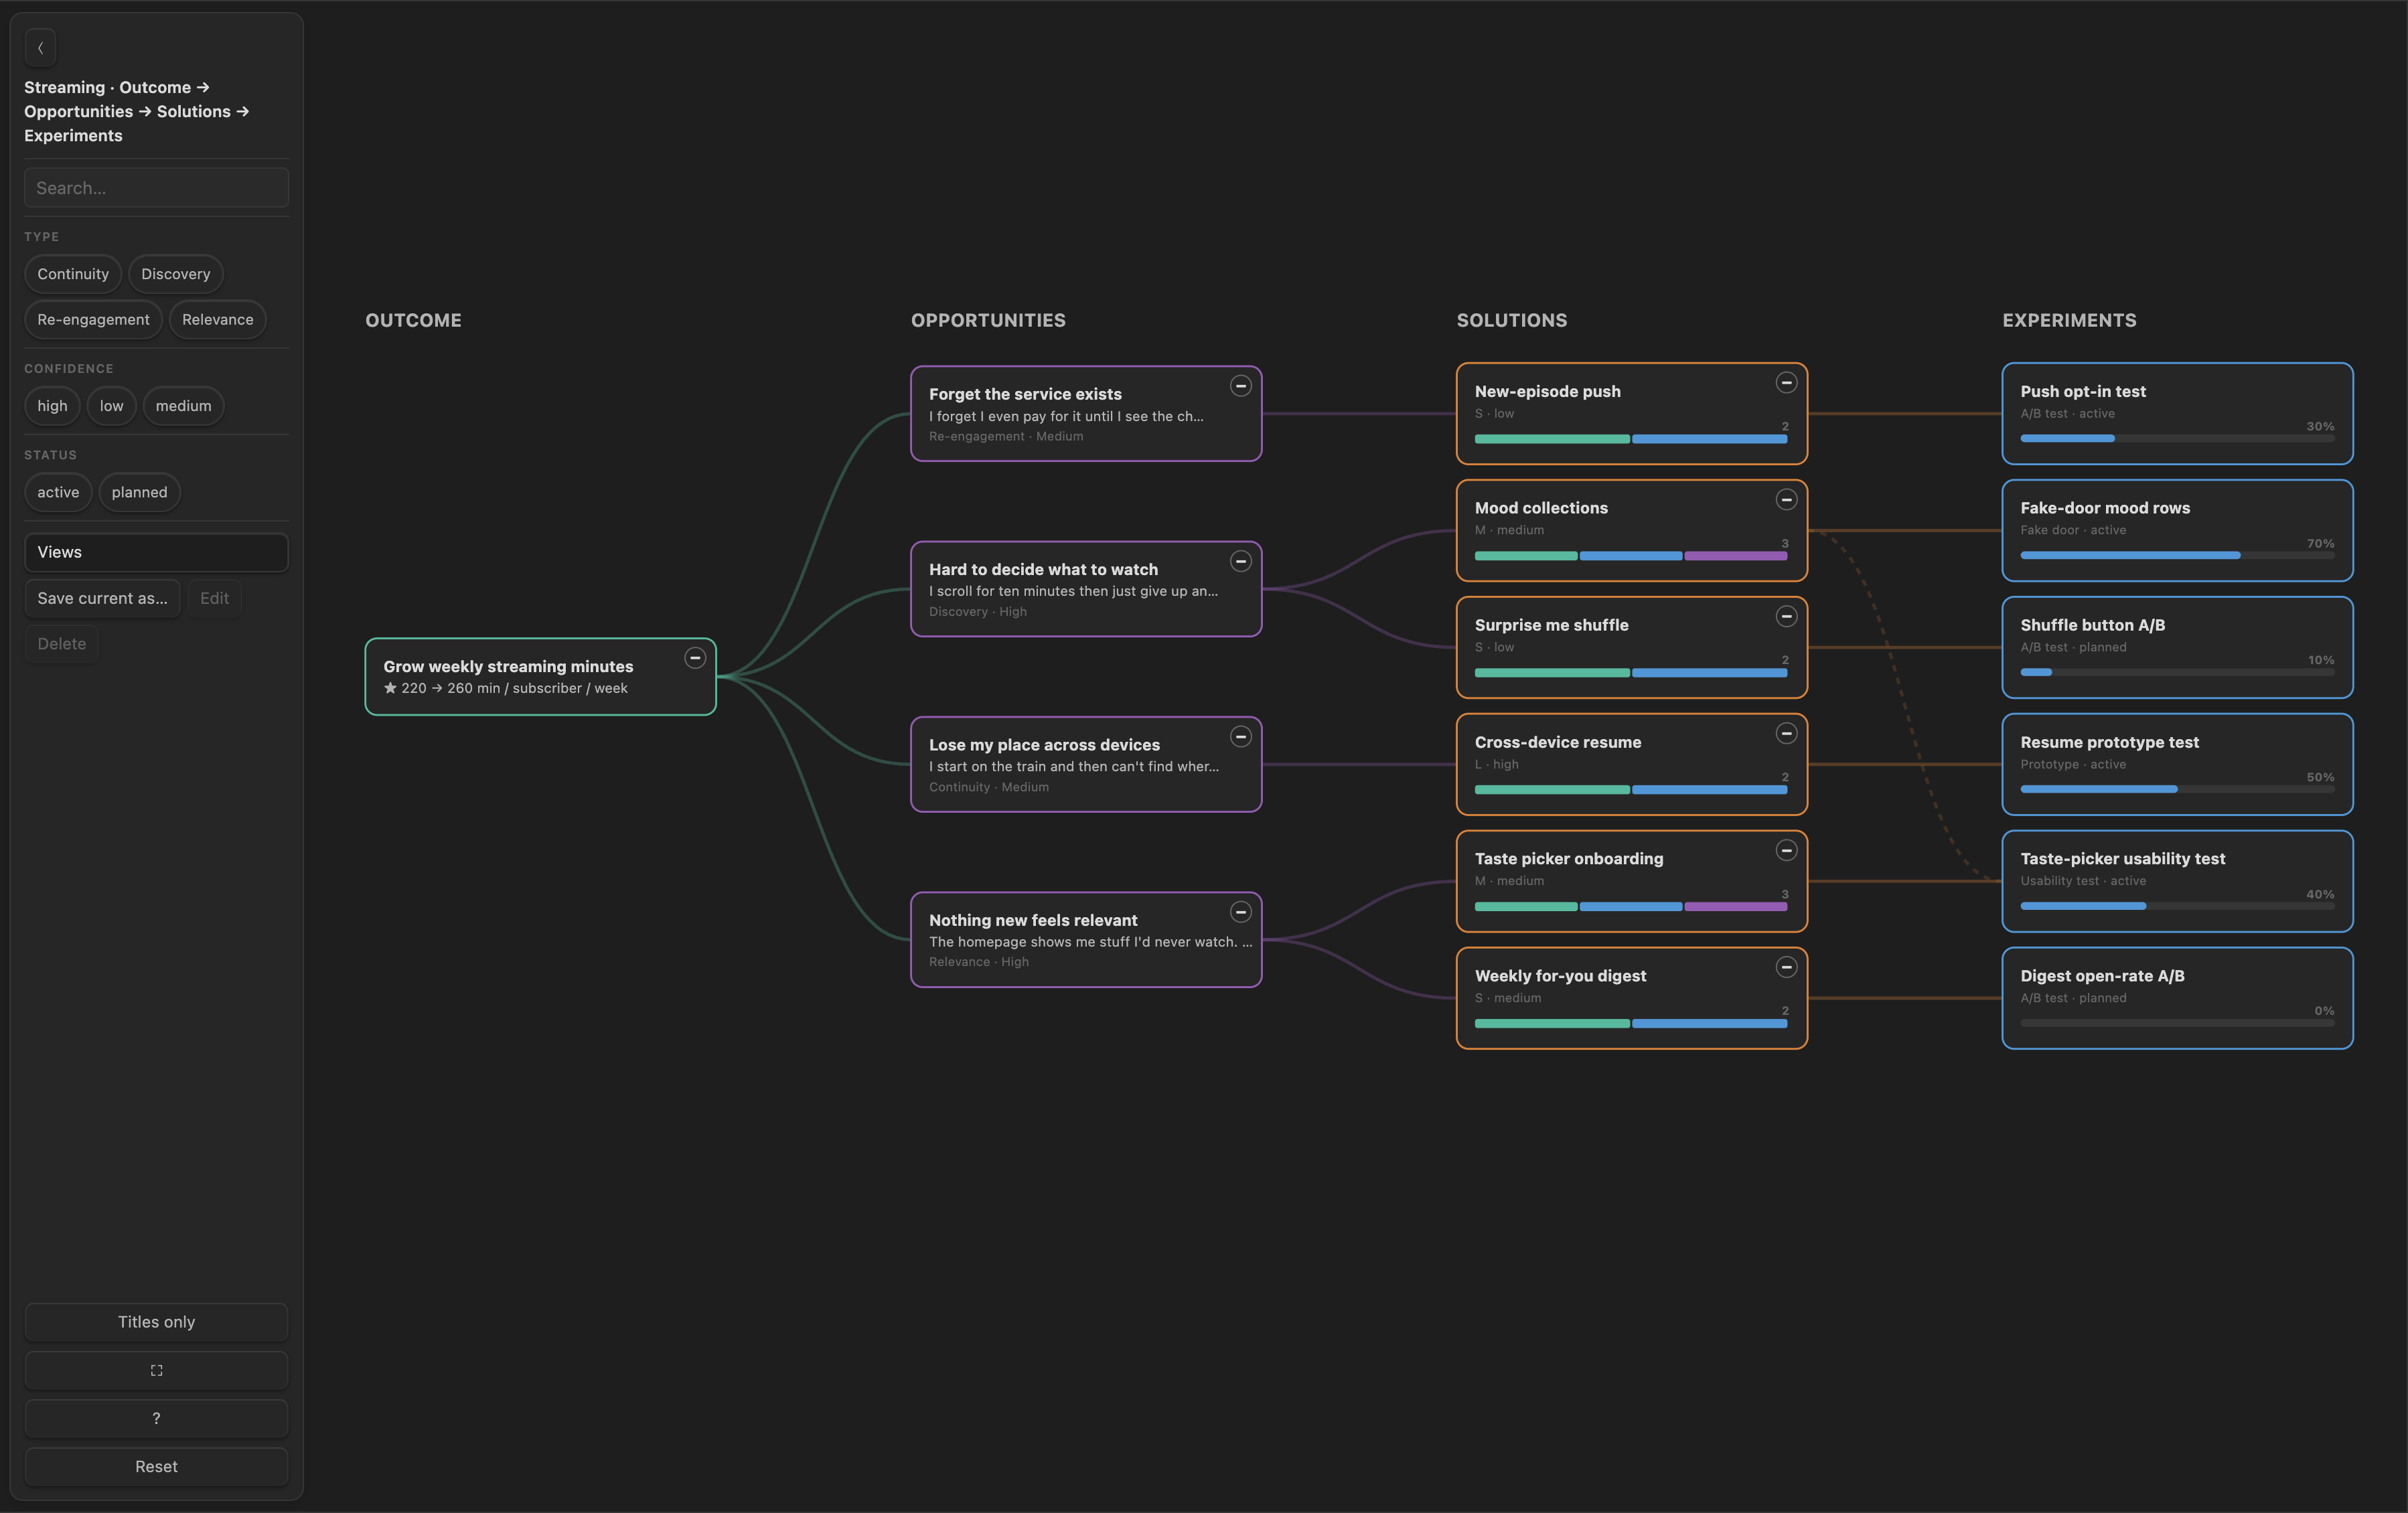
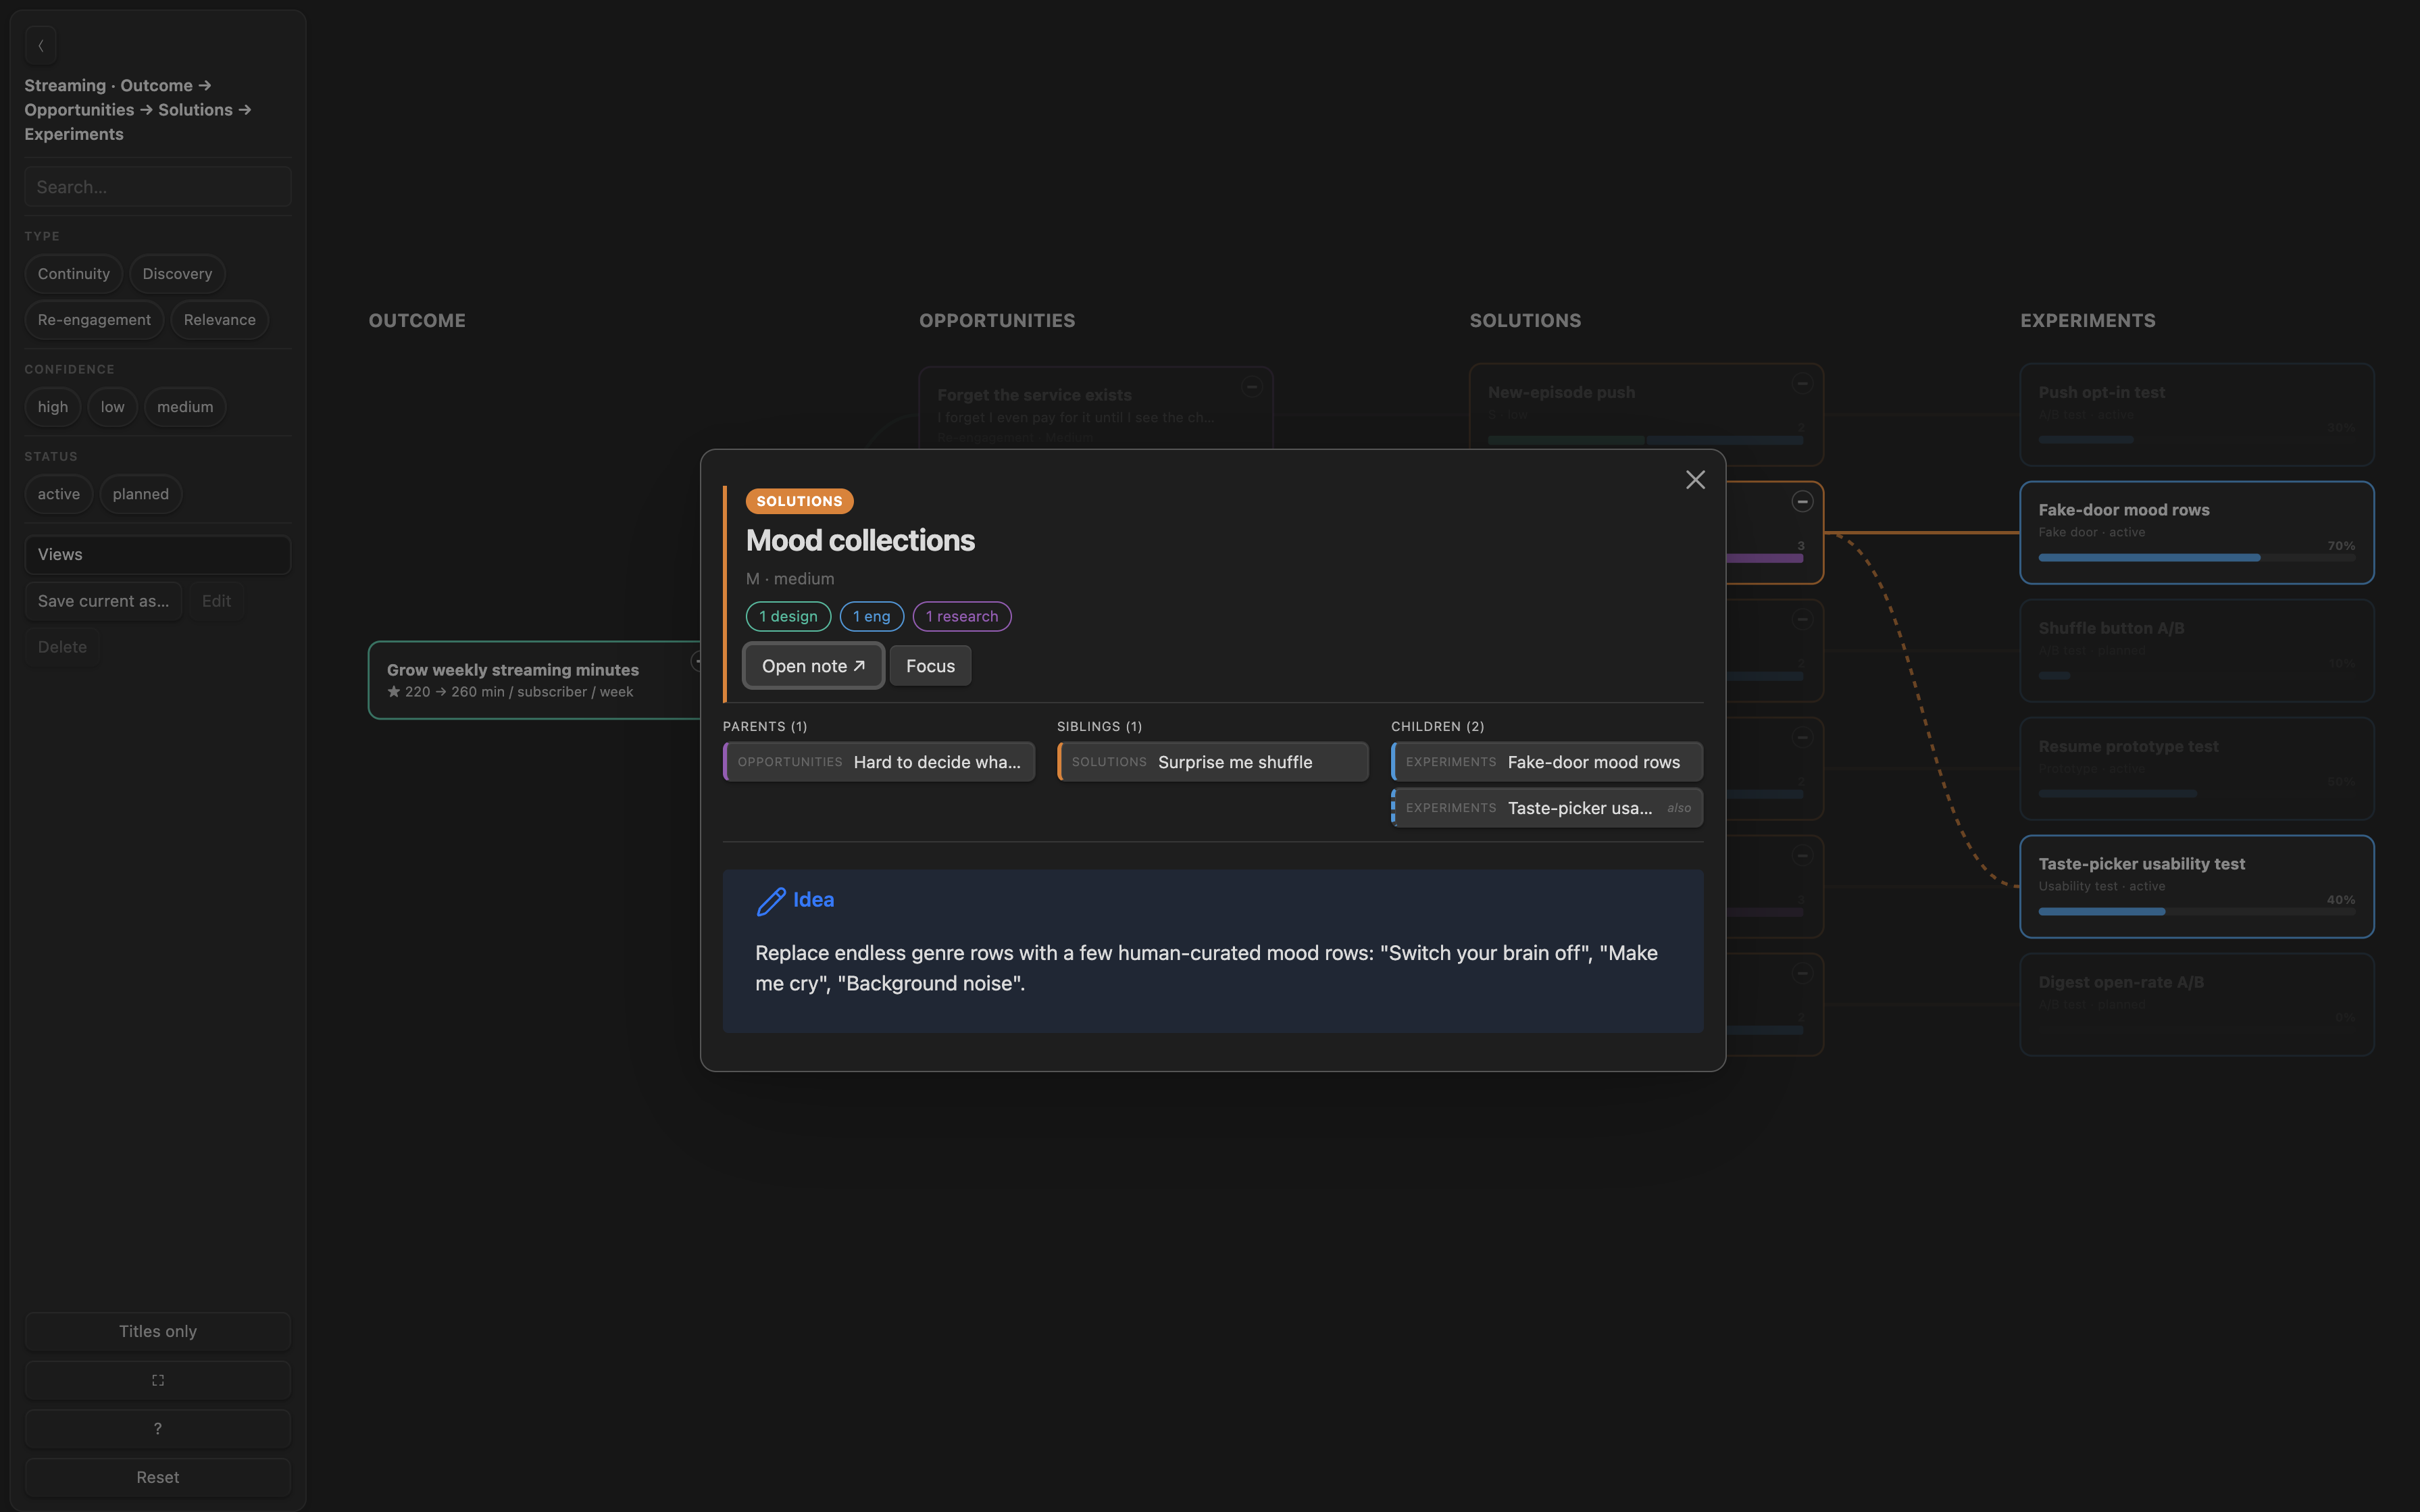
| Card dialog | Hover lineage |
|---|---|
 |
 |
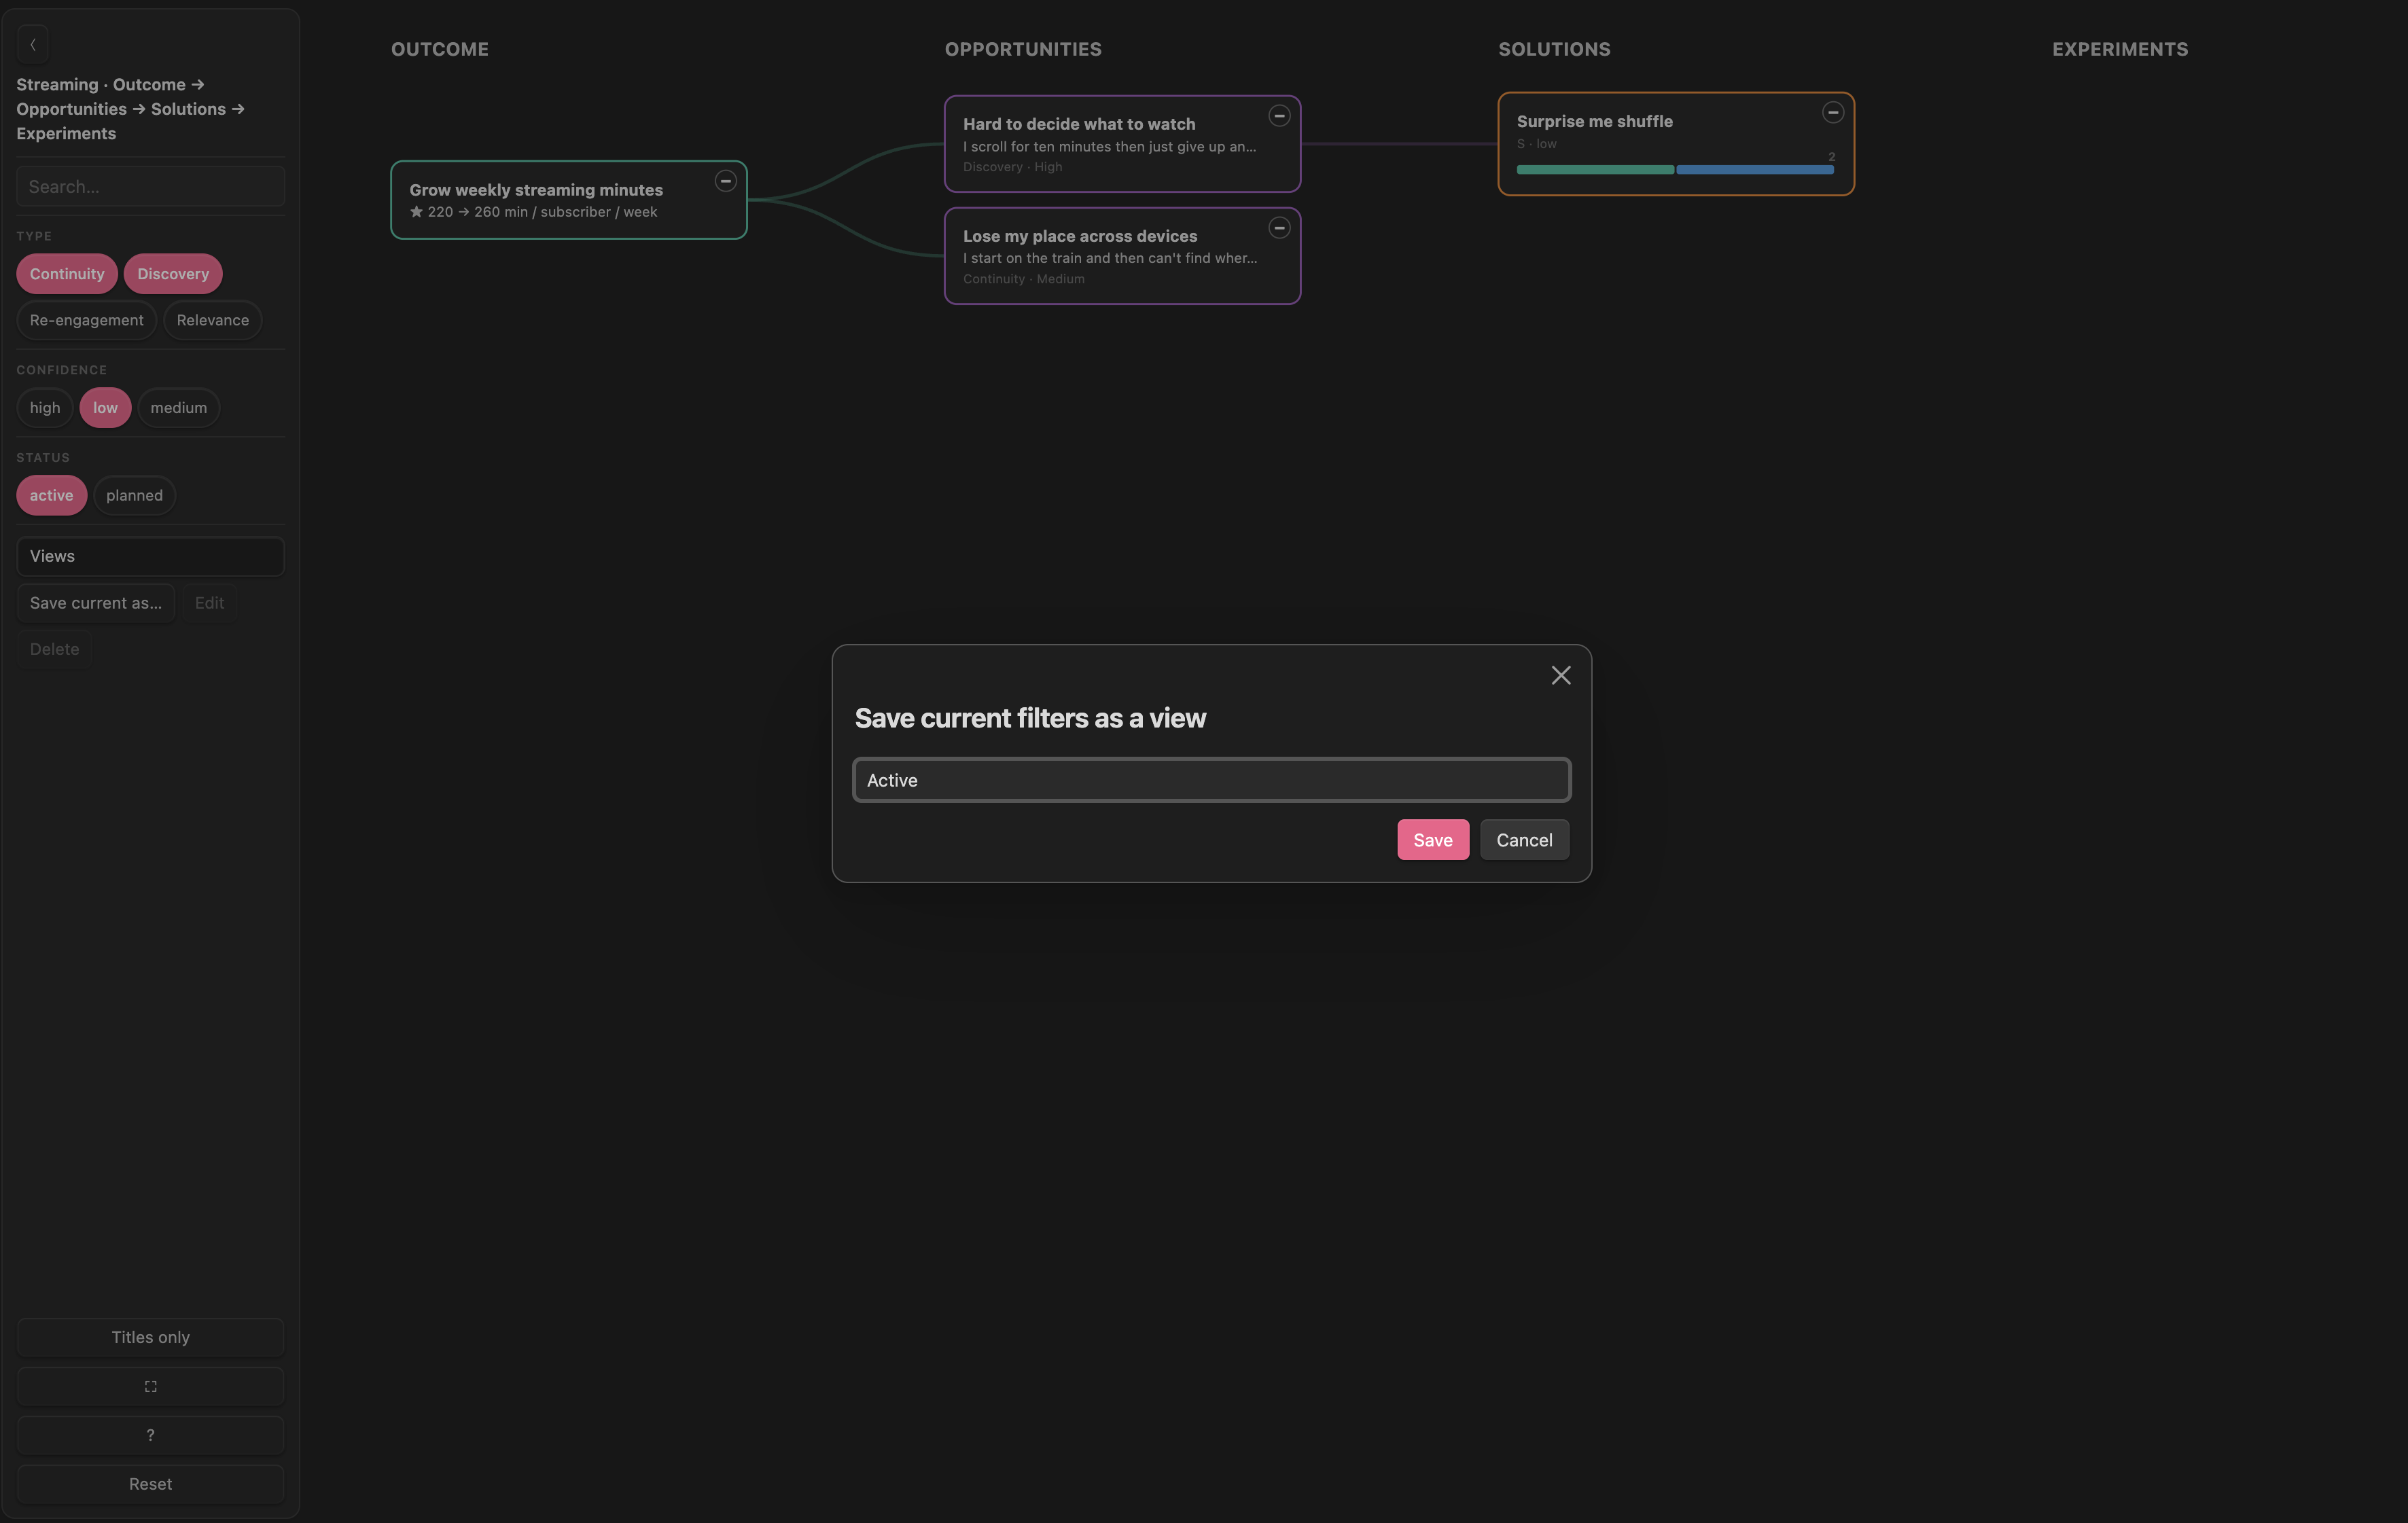
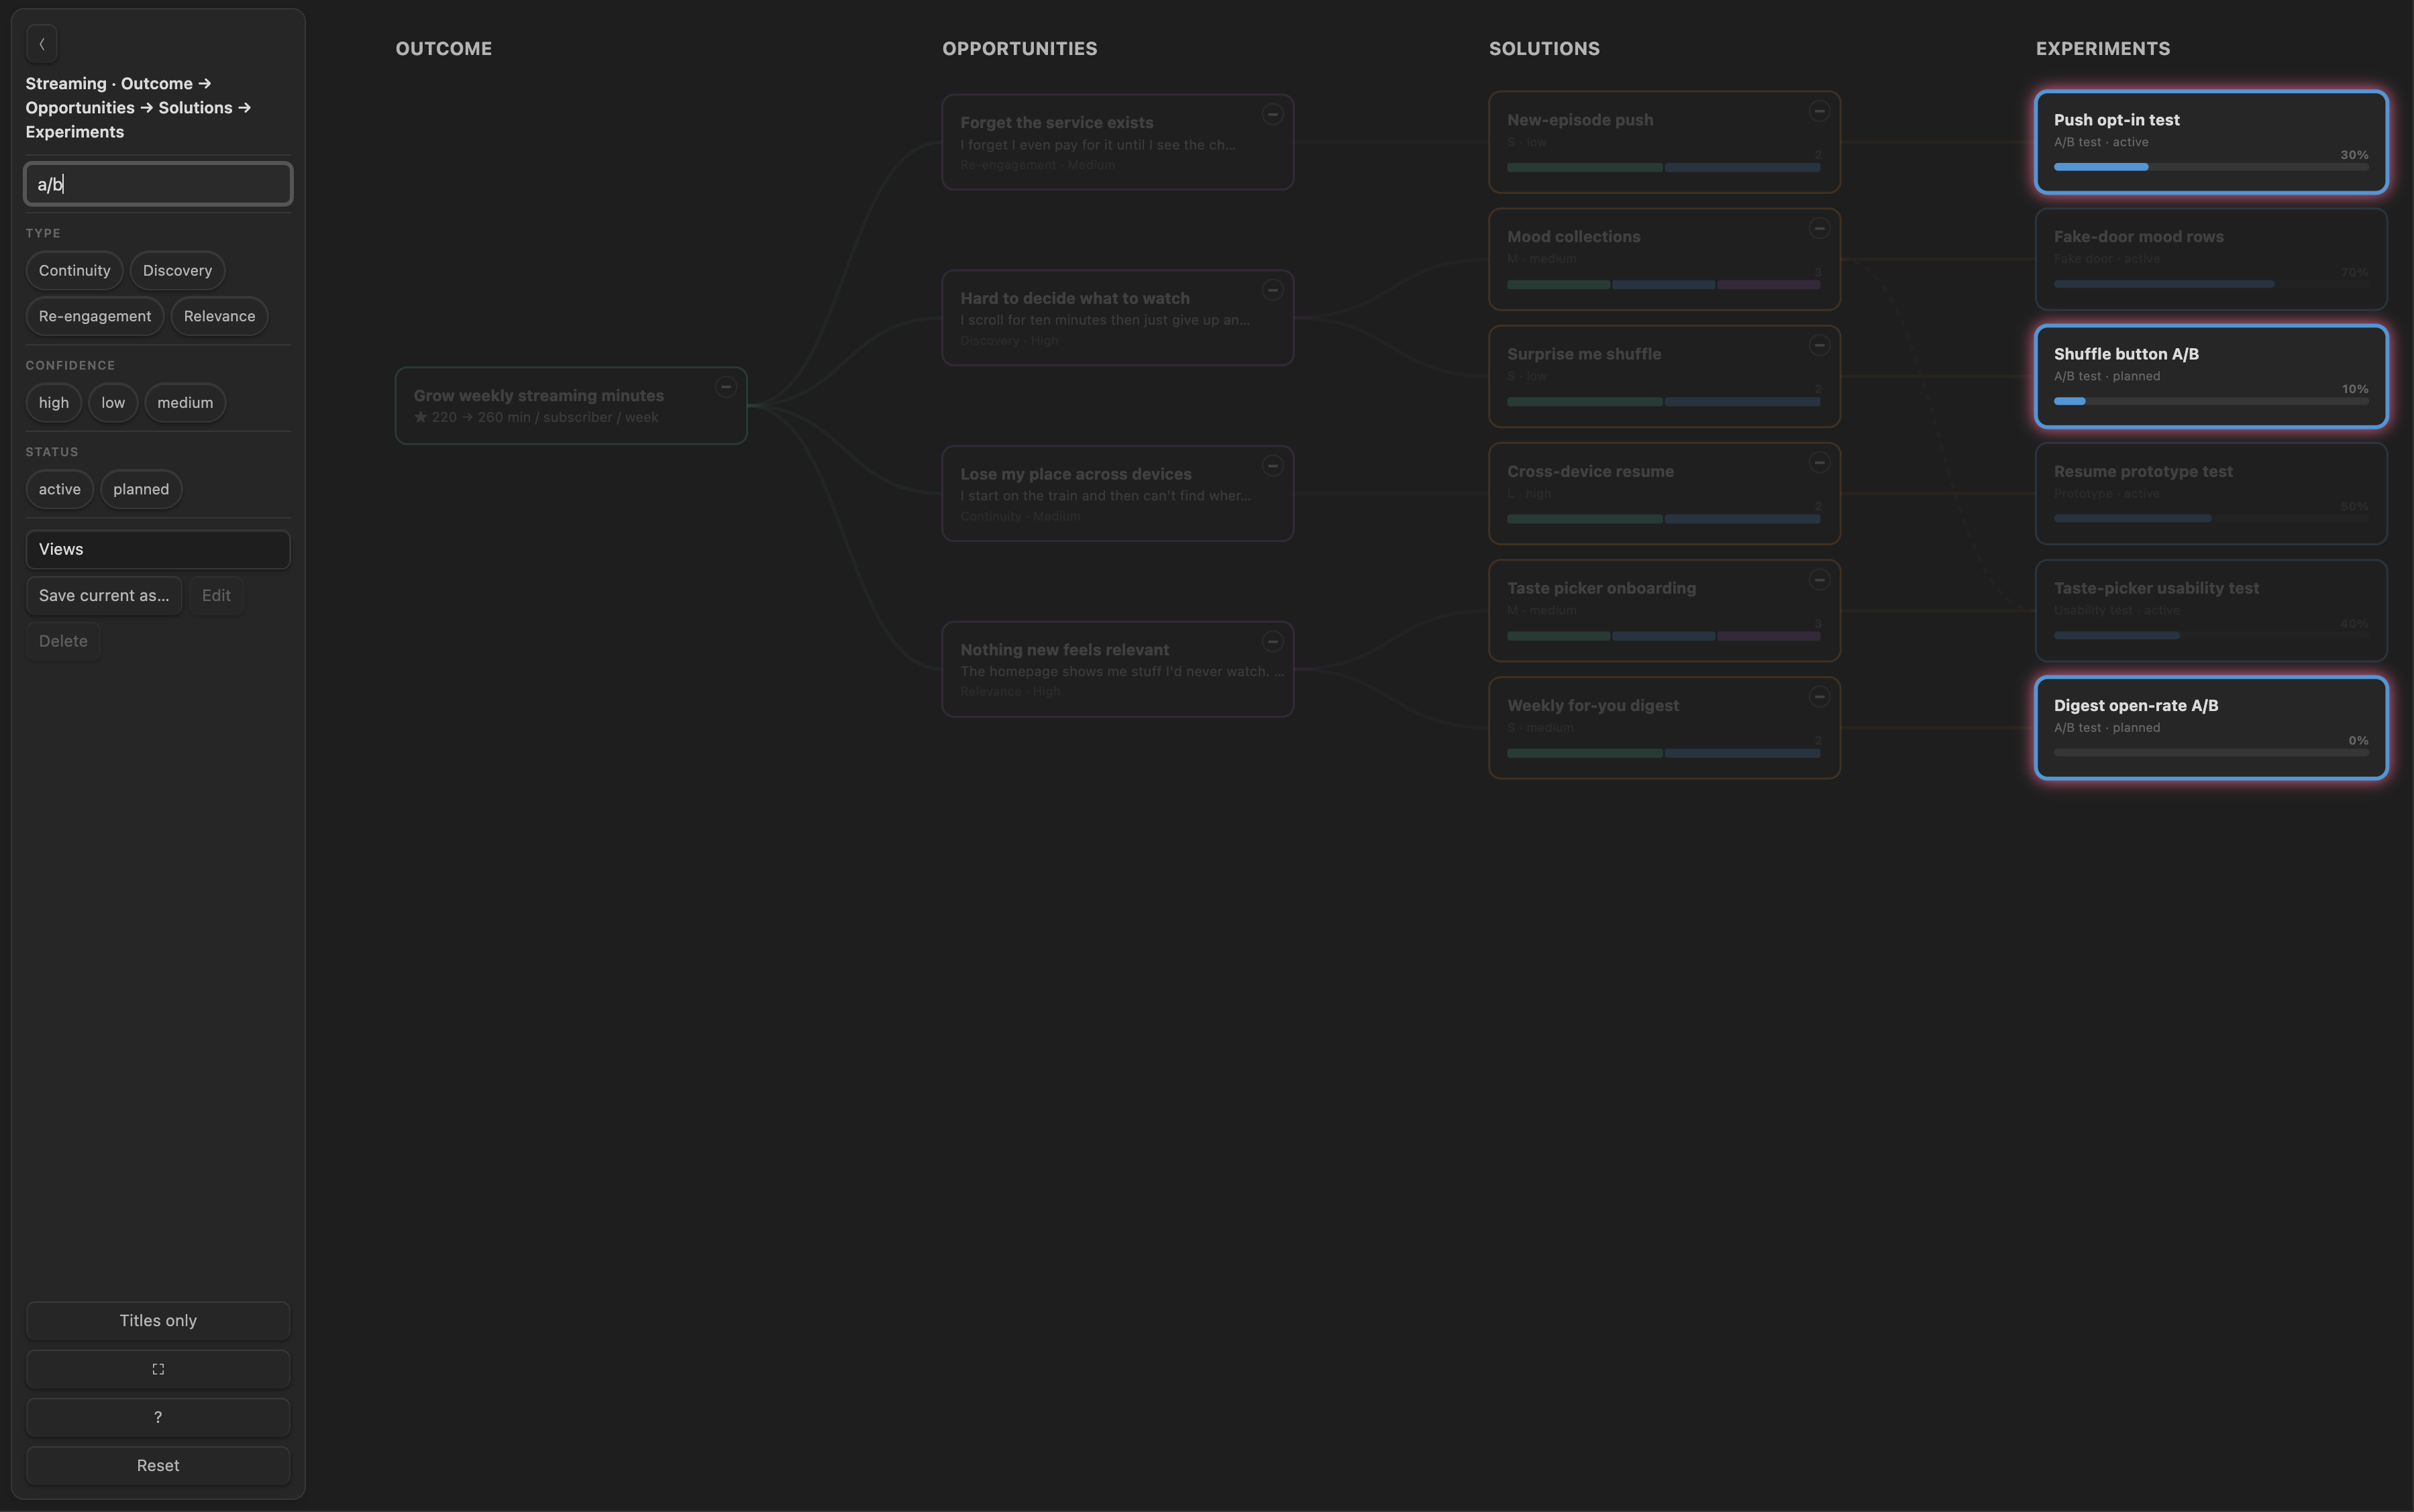
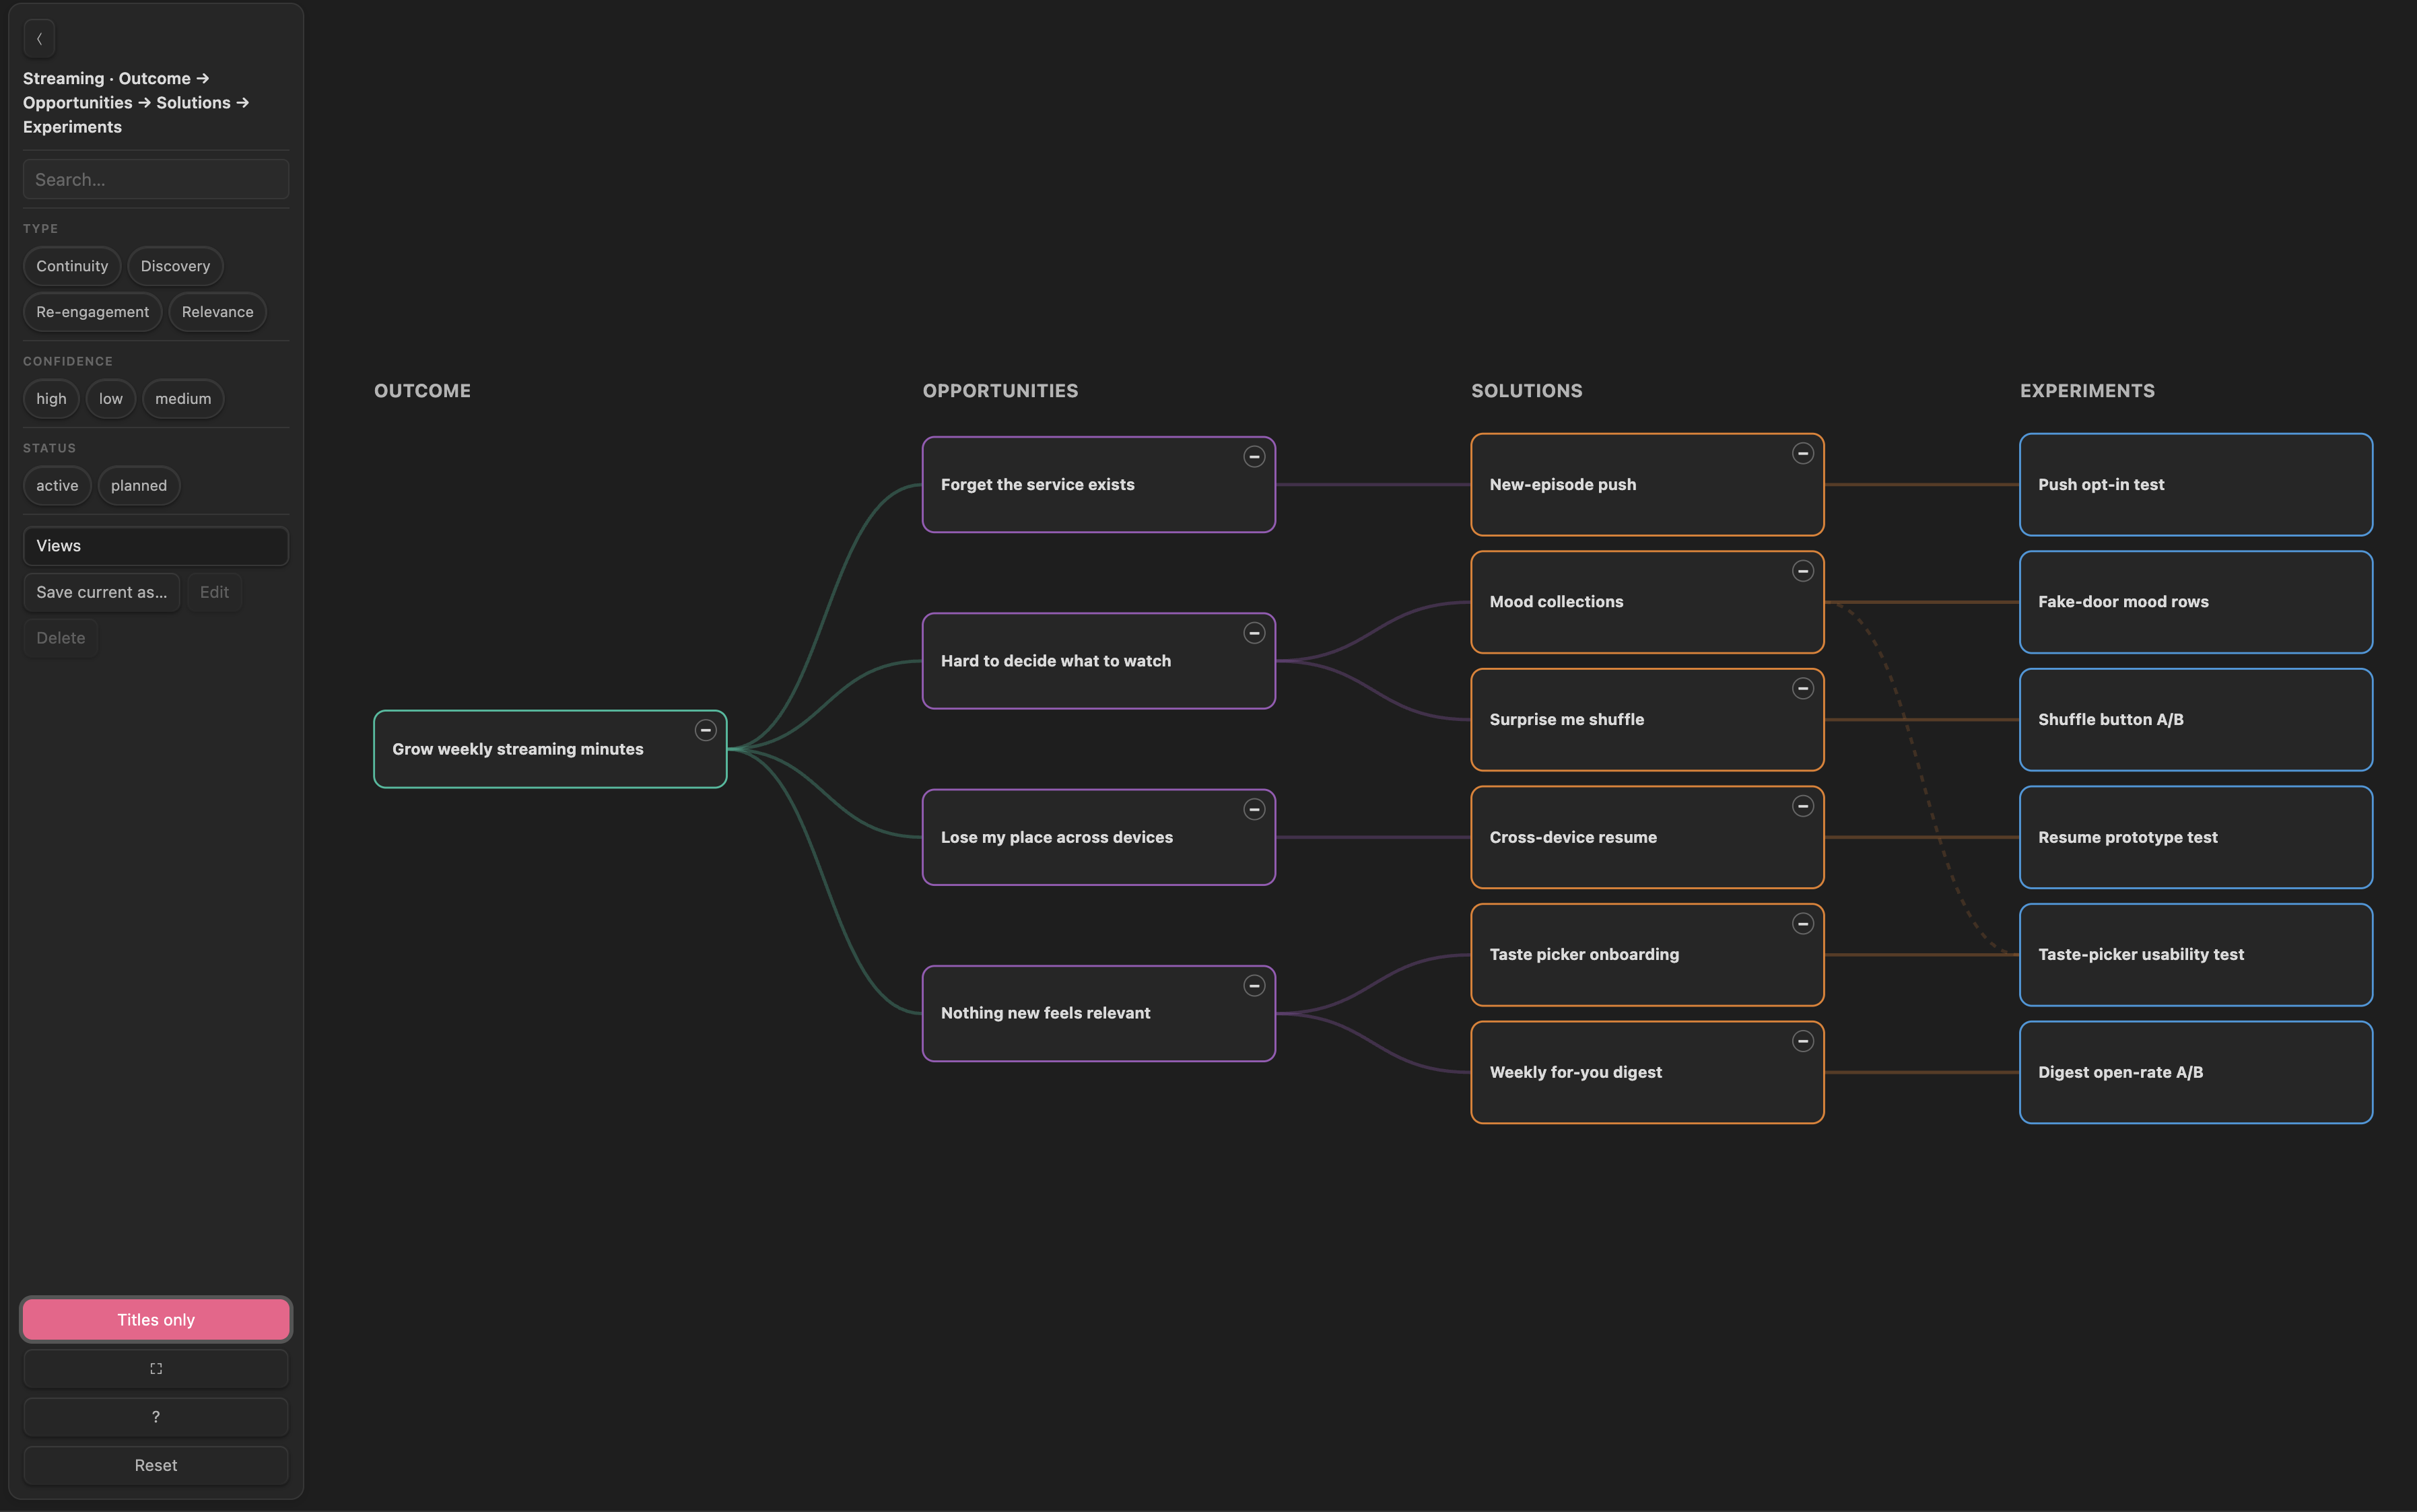
| Saved views | Search highlight | Titles only |
|---|---|---|
 |
 |
 |
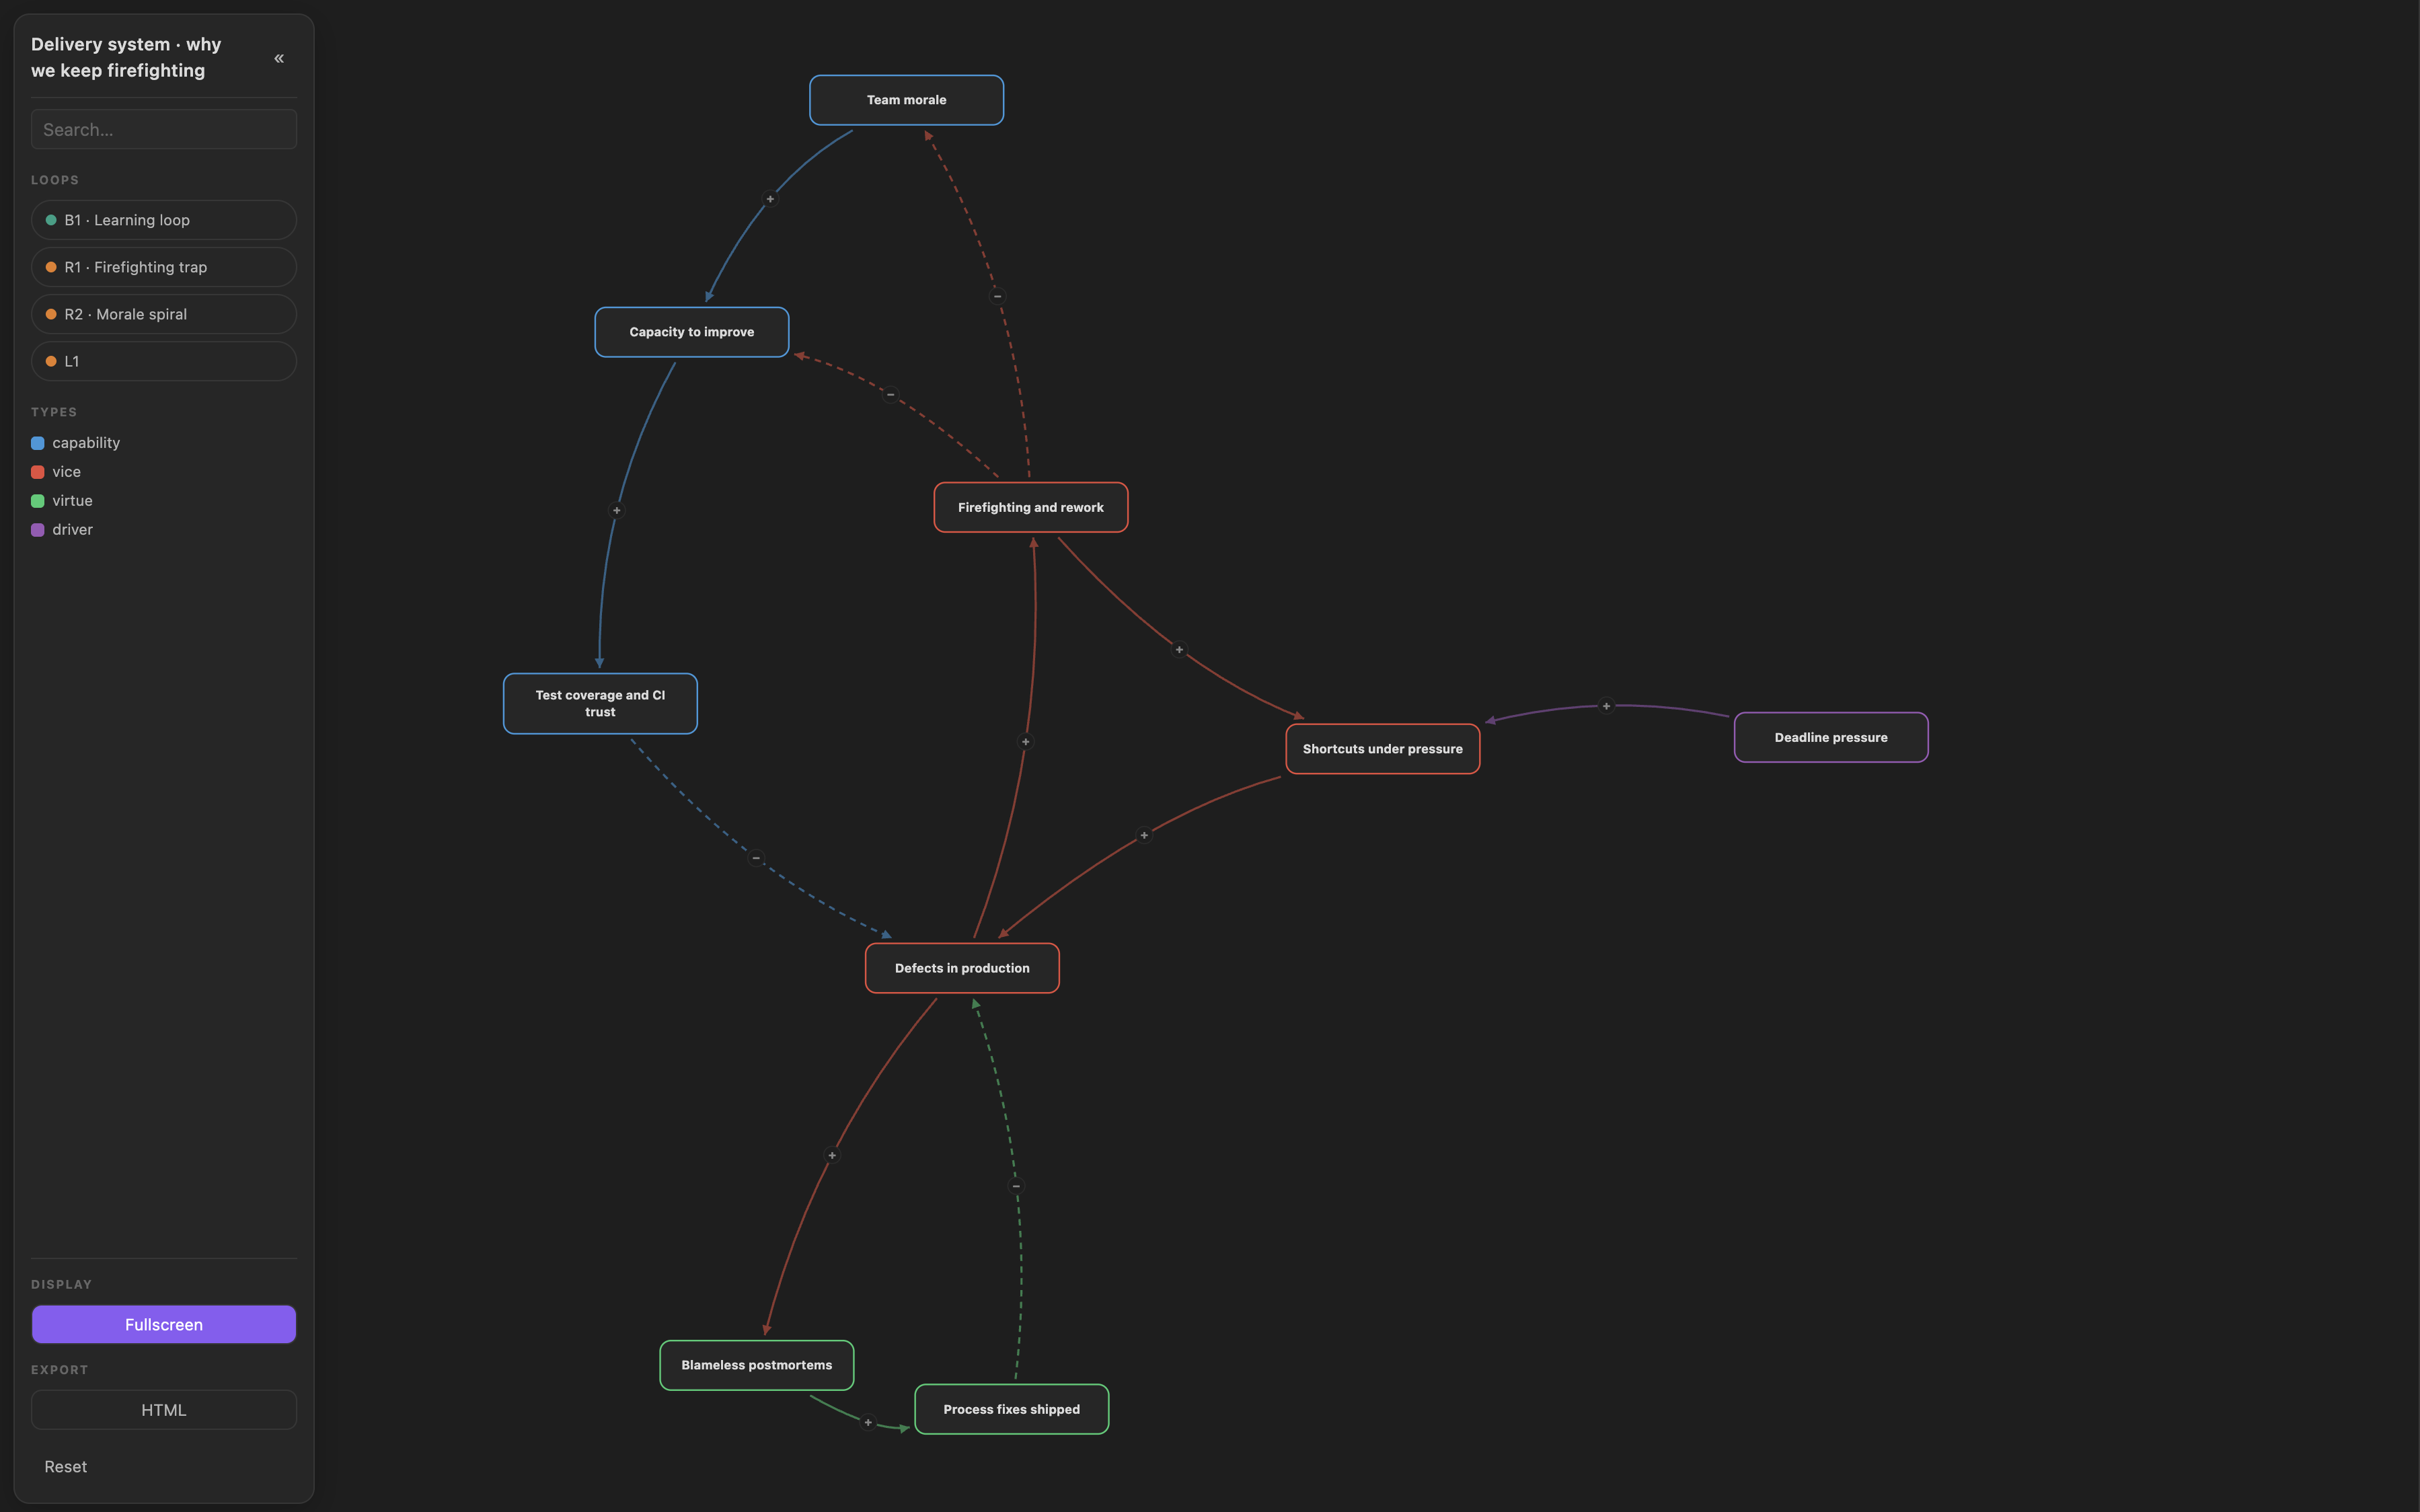
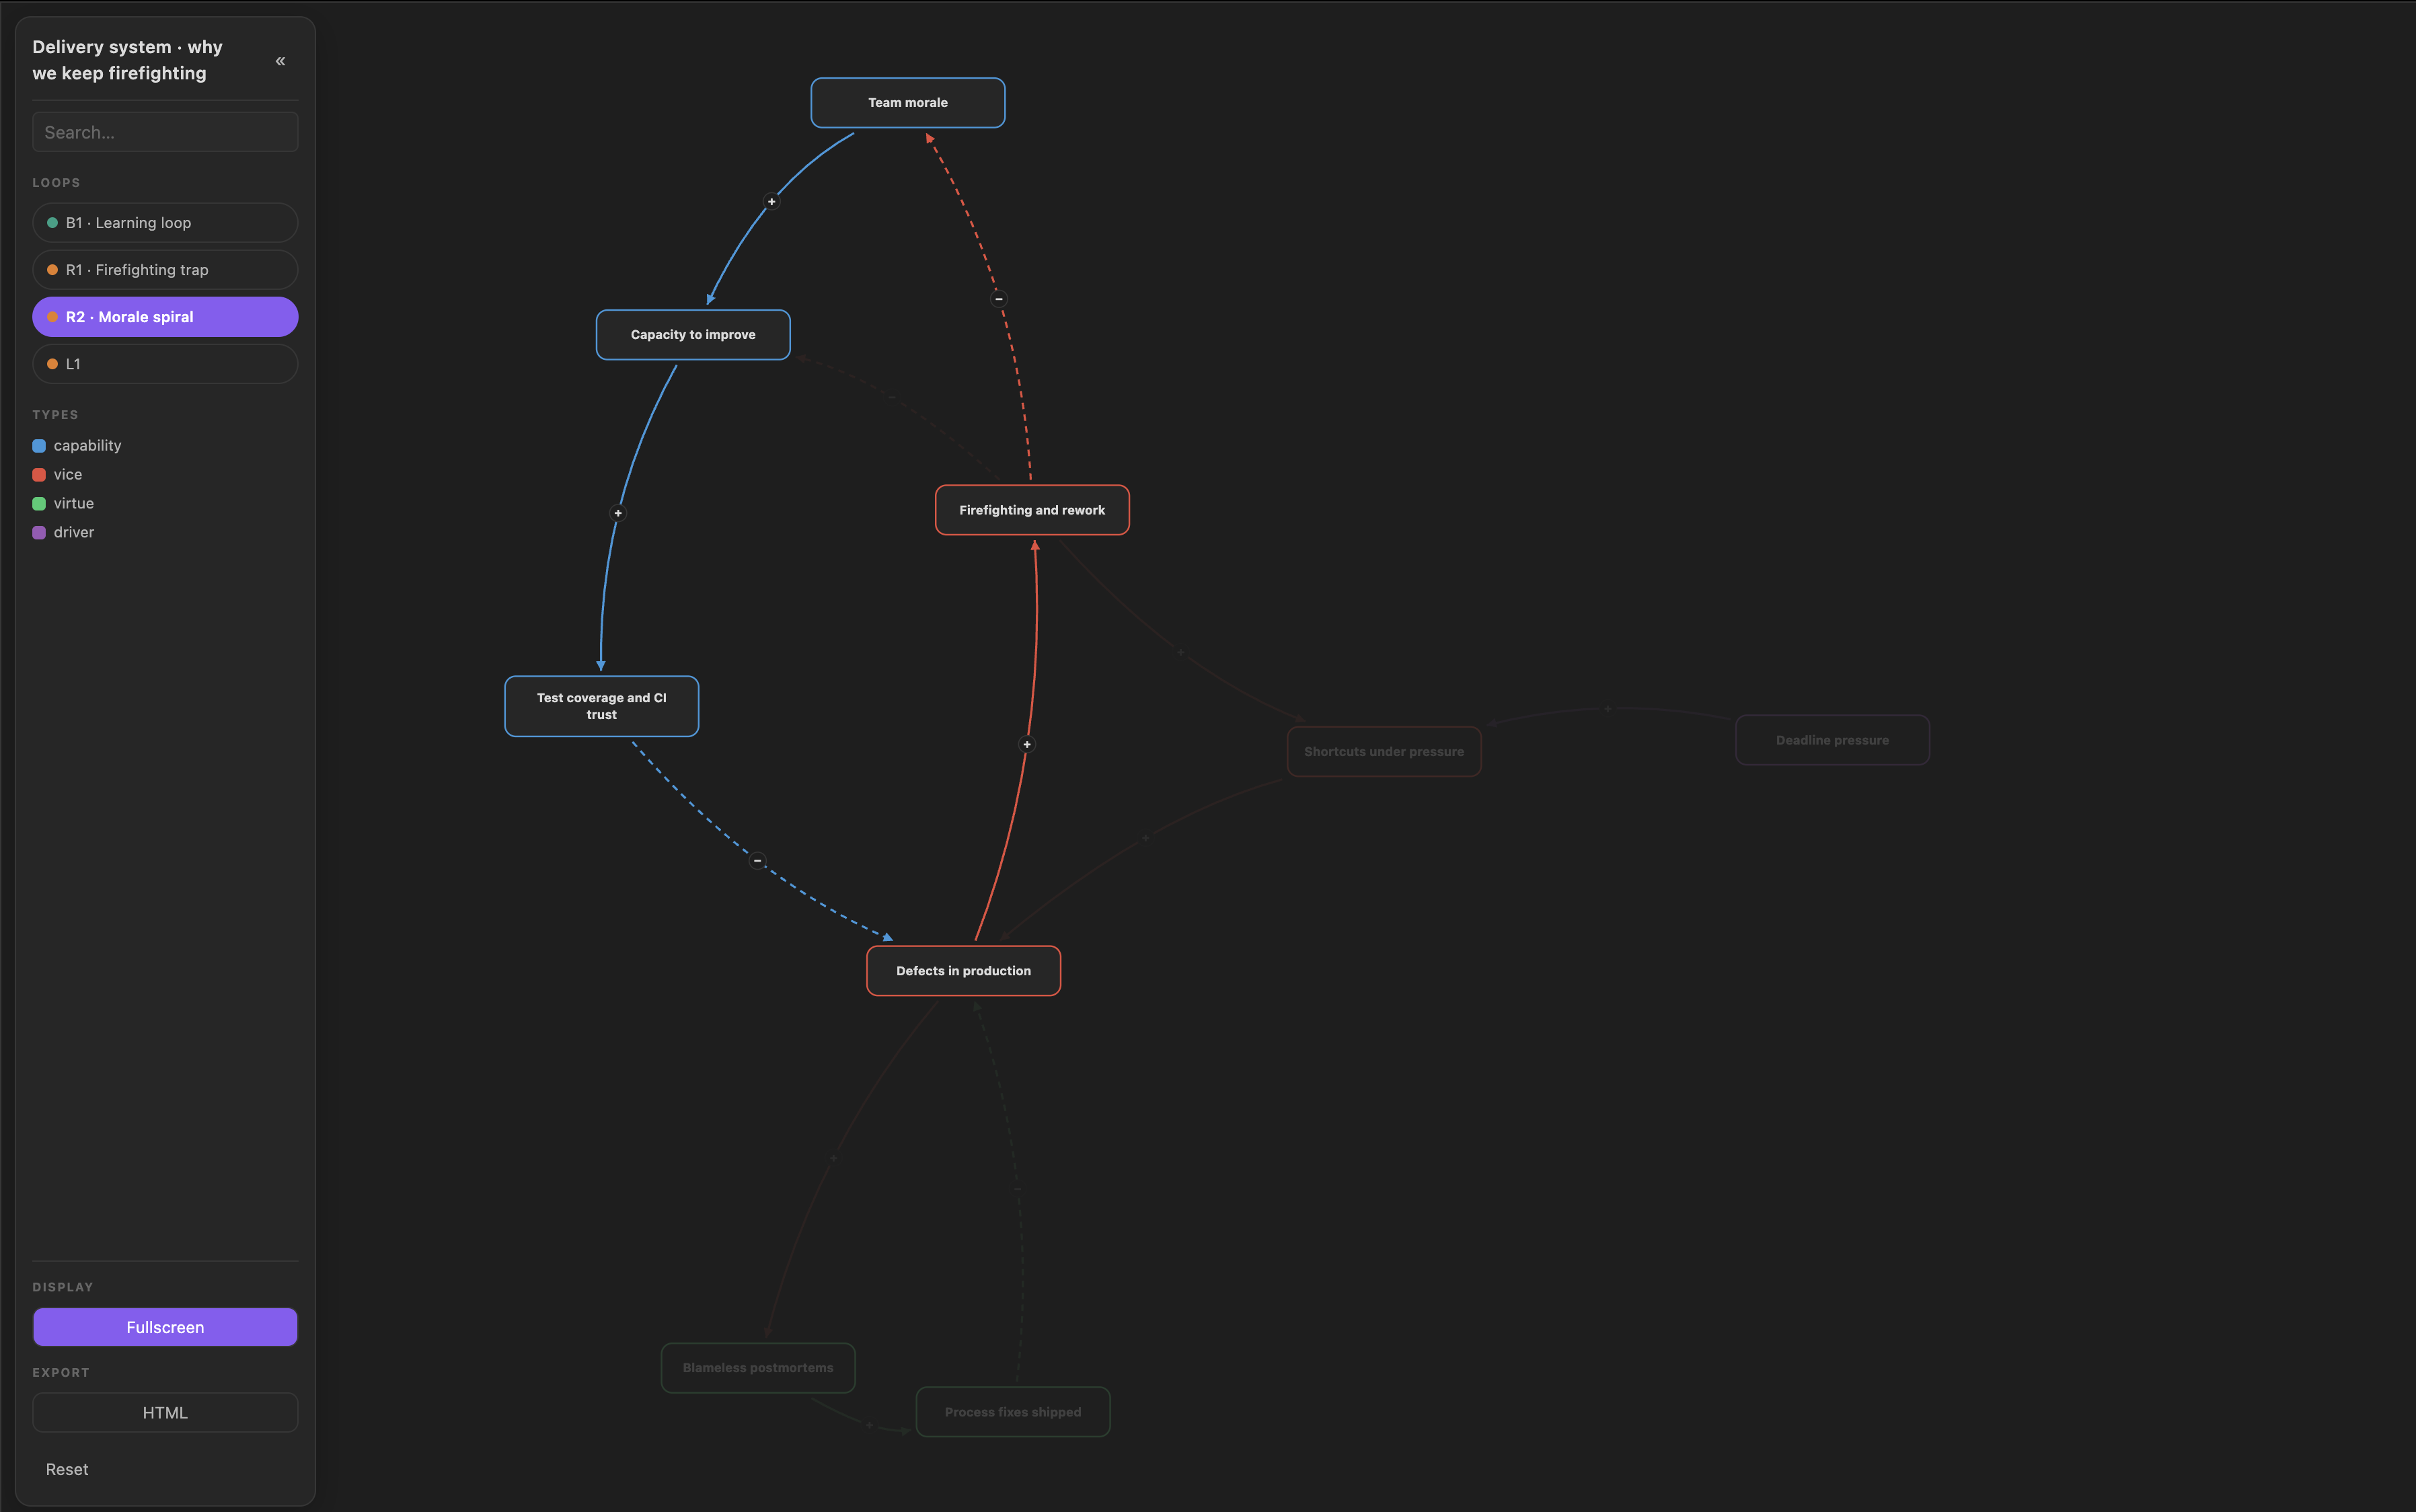
| Causal map overview | Causal loop spotlight |
|---|---|
 |
 |
What you get
- Four pictures from one set of notes — mind map, gantt, kanban, and causal-loop diagram, all driven by frontmatter you already write.
- Cards you design per level — choose which fields become the title, subtitle, meta line, progress bar, category bar, or coloured pills. Cards size themselves to fit.
- Filters, search, and saved views — multi-select chips per property, a search box that spotlights matches, and named filter combinations saved back into the block.
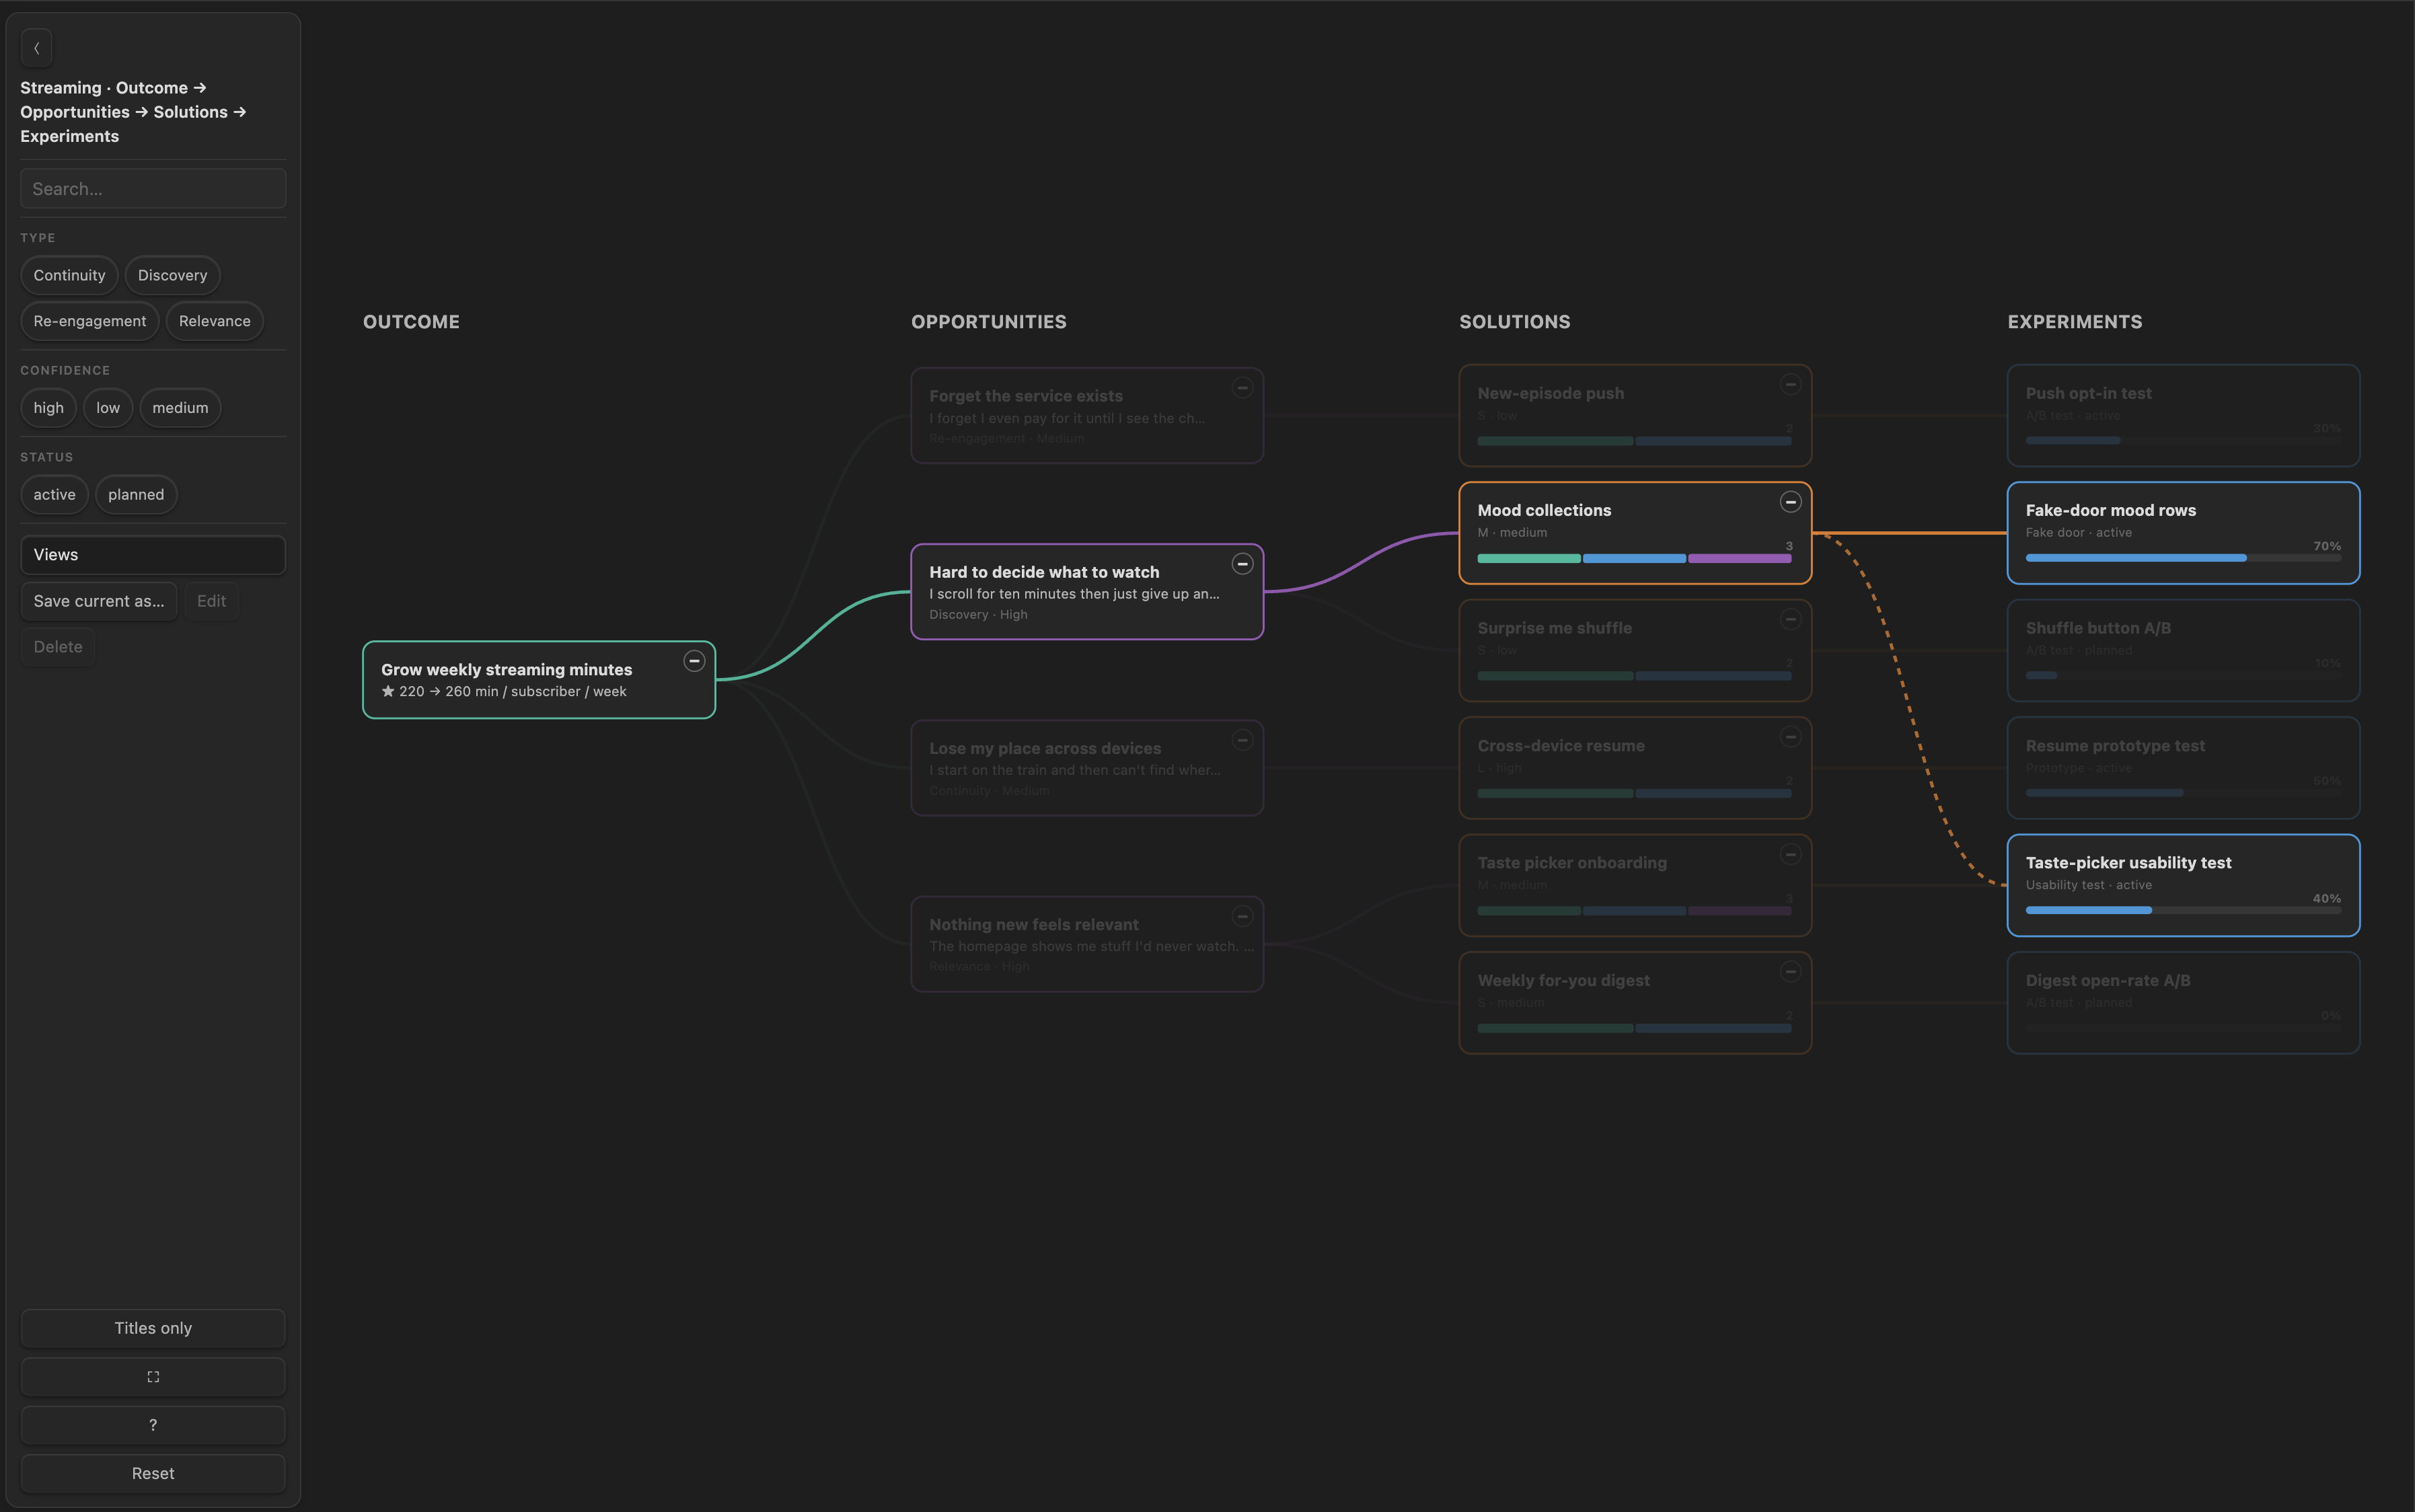
- Navigation that respects the tree — hover to light up a node's whole lineage, collapse any subtree, focus a branch, or open a card for its linked parents, siblings, and children.
- Export — save the current view as a standalone HTML file or an editable Excalidraw drawing.
- Native-feeling — themed with Obsidian's own CSS variables, so it follows your light/dark theme.
- Two hosts — everything above is the Obsidian plugin; a VS Code extension renders
```mindmapblocks from the same core, in a panel.
Install
Community plugins (recommended)
Markdown Mindmap is in the Obsidian community plugin store: Settings → Community plugins → Browse, search "Markdown Mindmap", Install, then Enable. Updates arrive through Obsidian's normal plugin-update flow.
BRAT
For pre-release builds, use BRAT: Add beta plugin → kikocastro/markdown-mindmap. BRAT-managed plugins also survive Obsidian Sync, unlike a hand-copied folder.
Manual
Get the three build files (main.js, manifest.json, styles.css) from a Release or by building from source (npm install && npm run build), copy them into <your-vault>/.obsidian/plugins/markdown-mindmap/, reload Obsidian, and enable the plugin under Settings → Community plugins.
Quick start
Put this in any note and open it in Reading view or Live Preview:
```mindmap
title: Goals → Projects → Tasks
levels:
  - id: goals
    label: GOALS
    from: planning/goals
    card: { title: title, sub: kpi }
  - id: projects
    label: PROJECTS
    from: planning/projects
    card: { title: title, meta: [status] }
  - id: tasks
    label: TASKS
    from: planning/tasks
    card: { title: title, meta: [status], progress: progress }
edges:
  - { from: goals,    to: projects, via: goal }     # each project note: goal: "[[Goal A]]"
  - { from: projects, to: tasks,    via: project }  # each task note: project: "[[Project 1]]"
filter: [status]
```
Three folders become three columns; the goal: and project: frontmatter fields become the arrows between them; status becomes a row of filter chips.
Two runnable demos ship with the repo — copy either folder into your vault root and open its note:
examples/mindmap-demo/— vision → areas → features → tasks, exercising per-level colours, a reverse edge, category bars, and a dashed secondary link.examples/ost-demo/— an Opportunity Solution Tree with interview-quote subtitles and a saved view.
See examples/README.md for what each one demonstrates.
How it works
A map is a list of levels. Each level reads notes from a from: folder and becomes a column, left to right in the order you list them. Edges connect levels: an edge says "notes in the child level point up to a note in the parent level via frontmatter field X".
 LEVEL 0          LEVEL 1              LEVEL 2
 ┌──────────┐     ┌──────────────┐     ┌────────────┐
 │  Goal A  │────▶│  Project 1   │────▶│   Task …    │
 │          │──┐  └──────────────┘     └────────────┘
 └──────────┘  │  ┌──────────────┐     ┌────────────┐
               └─▶│  Project 2   │────▶│   Task …    │
                  └──────────────┘     └────────────┘
        edge: project.goal=[[Goal A]]    edge: task.project=[[Project 1]]
By default the linking field lives on the child notes and points up. Set reverse: true when it lives on the parent and points down (a serves: list, say). Mark an edge secondary: true and it draws dashed and stays out of the layout spine — the way to show "also relates to" without distorting the tree.
How links resolve
A via value is matched, in order, against Obsidian's own link resolution ([[wikilink]]), then the target's basename, then its title frontmatter, then its id frontmatter — so pm-style parentId: p-broker-operator hierarchies link up. A value may be a single link or a list.
A note's first non-secondary parent is its layout parent, keeping the drawing a single-parent tree; any extra parents still draw their edges.
How filters treat the hierarchy
A filter only constrains notes that have the property — a note missing it is never hidden by that chip. What differs is what happens to the notes around a match:
- Strict (default). A note that fails the filter hides itself and its whole primary subtree. Right for "show me only the devops tasks", where a parent that isn't devops shouldn't drag its children along.
filterKeepsHierarchy: true. A match keeps its context: its subtree rides along (a matching epic still shows its subtasks, whatever their own status) and its ancestors stay visible as scaffolding. Right for a roadmap where the tree shape matters.
Collapse applies last either way, so a contracted subtree stays hidden.
A fuller example
A product strategy tree using per-level colours, secondary dashed links, category bars, and progress bars:
```mindmap
title: North Star → Drivers → Opportunities → Roadmap
height: 860
properties: true
levels:
  - { id: northstar, label: NORTH STAR,   from: strategy/north-star,   color: "#1abc9c", card: { title: title, sub: metric } }
  - { id: drivers,   label: DRIVERS,       from: strategy/drivers,      color: "#9b59b6", card: { title: title, sub: metric } }
  - { id: opps,      label: OPPORTUNITIES, from: strategy/opportunities, color: "#e67e22", card: { title: title, labels: [kind, horizon], bars: demand } }
  - { id: roadmap,   label: ROADMAP,       from: strategy/roadmap,      color: "#e74c3c", where: { parentId: null }, card: { title: title, meta: [status], progress: progress } }
edges:
  - { from: drivers, to: opps,    via: ladders-to }
  - { from: opps,    to: roadmap, via: serves }
  - { from: opps,    to: roadmap, via: alsoServes, secondary: true }   # dashed
filter: [horizon, kind, status]
```
The three views
One ```mindmap block can draw its notes three ways. Add a gantt: or kanban: config and a **View** switcher appears in the toolbar; set view: to choose which one opens by default. Filters, search, and collapse are applied before layout, so they behave identically in all three — and a saved view pins the filters and the view type, letting you keep a "devops · gantt" one click away.
```mindmap
title: 2026 Roadmap
view: gantt
levels:
  - id: tasks
    from: strategy/2026 Roadmap_tasks
    where: { parentId: null }
    card: { title: title, labels: [status], meta: [start, due], progress: progress }
  - id: subtasks
    from: strategy/2026 Roadmap_tasks
    card: { title: title, progress: progress }
edges:
  - { from: tasks, to: subtasks, via: parentId }
gantt: { start: start, end: due }
kanban: { groupBy: status }
filter: [status, tags]
```
Map is the default: a column per level, curved edges, cards centred on their children.
Gantt lays the same tree out against a time axis. Rows run from start to end with a progress fill; a task whose dates are equal — or that has only one of them — becomes a milestone diamond, and a task with neither gets a plain row. Bars take their colour from the note's status, matched case-insensitively, with the spaced and hyphenated spellings of each both recognised:
- green —
done,complete,completed,closed,shipped - blue —
in progress,in-progress,doing,active,wip,started,ongoing - grey —
todo,to do,to-do,planned,backlog,open,not started,new,pending
Anything else — or a missing status — falls back to the level's colour. A vertical today marker appears when the current date is in range, and hovering a row shows its title, dates, status, progress, and tags.
By default rows sort by start date within the hierarchy — siblings and roots are ordered by date, but children stay grouped under their parent, never flattened. Nested rows share the map's collapse state, so a saved view's collapsed list applies here too.
Kanban stacks the same cards into columns by any frontmatter field. All the card configuration carries over; notes with no value gather under a trailing (none) column.
Keys for all three live in the configuration reference.
Causal maps
A ```causalmap block renders a causal-loop diagram — the multi-connected graph systems thinkers use to diagnose retrospectives and post-mortems and to find leverage points. (Obsidian only for now.)
Each causal variable is a note carrying its outgoing signed edges in frontmatter, so the topology is stored once, on the source note, with no separate edge file:
---
id: untested-code-live # optional, defaults to the file name
label: Untested code live
type: vice # driver | vice | capability | virtue — colours the border
status: active
affects:
  - to: incident # id, note name, or [[wikilink]]
    sign: "+" # "+" moves the same direction (default), "-" opposite
    loops: [R1] # optional: name the loop(s) this edge belongs to
---
The block itself just points at the folders:
```causalmap
title: Engineering system
folders: [systems/nodes]
loopFolders: [systems/loops]   # optional loop cards (id + label) naming detected loops
where: { status: active }
height: 700
```
What the diagram gives you:
- Loops found for you. A bounded simple-cycle search detects every feedback loop and classifies it by sign parity — an even number of
-edges makes a reinforcing loop, odd makes a balancing one. There is no hand-maintained loop list to fall out of date. - A loop rail. Each detected loop becomes a chip (● amber = reinforcing, ● teal = balancing); click it to spotlight exactly that cycle's nodes and edges — the retro-projector view — and click again to release. Hovering shows the whole cycle as an
A → B → C → Atooltip. Loops whose edges share aloops:tag take that name and lead the rail alphabetically, with a matching card inloopFolderssupplying the display label; untagged cycles get auto names (L1,L2, …) in discovery order. - A type legend listing the node types actually present, with their colours.
- Signed edges as curved arrows with a
+/−badge; negative links draw dashed. - A deterministic layout. The force-directed placement has no randomness, so the same notes always produce the same picture.
Hovering a node lights up everything it affects and is affected by; clicking one opens the note dialog, with each linked row carrying its edge sign. Search, fullscreen, HTML export, and pan/zoom work as they do in mindmaps.
A runnable copy, with sample cards and loop notes, lives in
examples/causalmap-demo/. Copy that folder into your vault root and openCausal map demo.md.
Using a map
The toolbar is a rail down the left: title and search at the top, then chip groups (View, Scale, Density, Rows, one per filter property, and Saved views), then a footer holding Display, Export, and the Reset / Refresh / Help row.
- Search — spotlight cards matching title / sub / meta and dim the rest.
- View chips — flip between map / gantt / kanban (shown once
gantt:orkanban:is configured). - Scale, Density, Rows chips — gantt only: the axis unit (week / month / quarter / year), compact vs comfortable row size for presenting, and show subtasks to expand or contract every parent row at once.
- Filter chips — multi-select per property, OR within a property and AND across them, options sorted alphabetically.
- Saved views — save the current filters and view type under a name, then apply, edit, or delete it from the dropdown. Each view also remembers which subtrees were collapsed. Views are written back into the block's
views:key and the selected one intoactiveView:, so your choice survives a restart. - Export — write the current view next to the note as a standalone
.htmlfile or an editable.excalidrawdrawing. Both capture what's on screen: active filters, collapse state, and view type. - Hover a card — highlight its full up/down lineage, in gantt and kanban as well as the map.
- Click a card — open a dialog with the title and file name, level badge, progress/category breakdown, its linked parents, siblings, and children (click one to jump there), optional frontmatter properties, the rendered note, and Open note / Focus buttons.
- Focus — narrow the map to a node, its ancestors, and its primary descendants. It persists while you pan and click; a Focus: … chip at the top of the rail clears it with ✕.
- Titles only — strip cards back to their titles, hiding subtitle, meta, bars, and labels. (Not shown in the gantt, which draws rows rather than cards.)
- + / − on a card, or a gantt row's toggle — collapse or expand that subtree.
- « / ☰ — collapse the whole rail to a single button when it's in the way, and bring it back.
- Refresh — re-read every note's frontmatter and redraw. A map reads the vault once, when the block renders, so edits to the notes it maps (a changed
gantt.end, a newstatus:) don't show until the block re-runs. Your filters, view type, and collapse state carry over; pan/zoom and search do not, and it exits fullscreen. - Help opens a quick reference · Fullscreen toggles fullscreen · Reset clears filters, search, collapse, focus, and titles-only, returns to the block's default view, and refits.
- Drag to pan, scroll to zoom. Clicking empty space clears the sticky hover highlight.
Configuration reference
mindmap — top level
| Key | Type | Meaning |
|---|---|---|
levels |
list | Columns, left to right. Required. |
edges |
list | Parent → child links between levels. |
title |
string | Heading in the toolbar. |
height |
number | Component height in px (default 900). |
view |
string | Initial view: map (default), gantt, or kanban. |
gantt |
map | Gantt config (below). Configuring it adds the view to the switcher. |
kanban |
map | Kanban config (below). Configuring it adds the view to the switcher. |
filter |
list of strings | Frontmatter properties exposed as multi-select chip filters. |
filterLabels |
map | Rename a filter group's heading, e.g. { customFields.quarters: Quarter }. Unlisted properties keep their raw name. |
filterKeepsHierarchy |
boolean | Default false (strict): a filtered-out note hides itself and its subtree. true keeps matches in context — see above. |
layout |
map | Override card/column sizing (below). All keys optional. |
properties |
boolean | When true, the note dialog shows all frontmatter as a table above the rendered note. |
views |
list | Saved views (filters + collapse + view type), managed by the toolbar. |
activeView |
string | Name of the saved view to re-select on render. Written by the toolbar when you pick one; cleared by Reset. |
levels[]
| Key | Type | Meaning |
|---|---|---|
id |
string | Unique id, referenced by edges. Required. |
from |
string | Folder to read notes from (recursive). Required. |
label |
string | Column header. |
color |
hex string | Column / card-border colour. Defaults cycle the flatuicolors defo palette. |
where |
map | Keep only notes whose frontmatter matches a value, e.g. { horizon: now } to use only drivers with horizon: now, or { parentId: null } to keep top-level notes (a null target matches null, empty, or missing). Multiple keys are AND-ed. |
card |
map | Which fields render on the card (below). |
levels[].card
All card field values are frontmatter property names. Dotted paths work everywhere (customFields.serves, nested.key).
| Key | Type | Renders |
|---|---|---|
title |
field | Bold title (falls back to the file name). |
sub |
field | Subtitle line. |
meta |
list of fields | A muted ·-joined line. |
progress |
field (0–100) | A progress bar. |
bars |
field or map | A stacked count-by-category bar (below). |
labels |
list of fields | Small coloured value pills along the card's bottom strip, one per field (e.g. [kind, horizon, stage]). Empty/missing fields drop out; pills that don't fit on one row are skipped. |
bars takes either a field name or a map. bars: demand is shorthand for bars: { field: demand, category: parens }.
| Key | Type | Meaning |
|---|---|---|
field |
field | The list field to count. Required. |
category |
parens | value |
How to derive each category. parens (default): text in trailing parens, else the value ("Acme (client)" → client). value: the whole value. |
colors |
map | category → hex. Categories not listed cycle the auto palette. Omit to use the built-in client/prospect/trial/customer defaults. |
edges[]
| Key | Type | Meaning |
|---|---|---|
from |
level id | Parent level. |
to |
level id | Child level. |
via |
field | The frontmatter field holding the link. By default it lives on the to notes and points up to a from note. Dotted paths work (customFields.serves). |
reverse |
bool | Set true when the field lives on the from notes and points down (e.g. a serves: list). |
secondary |
bool | Draw the edge dashed and keep it out of the layout spine (for "also relates to" cross-links). |
gantt
| Key | Type | Meaning |
|---|---|---|
start |
field | Start date (ISO, e.g. 2026-06-09). Required. |
end |
field | End/due date. Required. |
progress |
field (0–100) | Bar fill. Defaults to the card's progress field. |
status |
field | Field driving the bar/milestone colour (default status). |
scale |
week | month | quarter | year |
Axis tick unit (default month). Also switchable from the toolbar's Scale chips. |
density |
compact | comfortable |
Default compact. comfortable scales up rows and fonts for reading from a distance. Also switchable from the toolbar's Density chips. |
sortByStart |
bool | Default true: rows sort by crescent start date (dateless last). false restores the raw tree/path order. |
groupRows |
bool | Default true: rows follow the tree order with subtasks indented under parents. false: flat path order. |
showLabels |
bool | Default true: the card's labels, ·-joined, on a discreet second line under the row title. false drops them for a barer chart. |
kanban
| Key | Type | Meaning |
|---|---|---|
groupBy |
field | Column key (e.g. status). Required. |
columns |
list of strings | Explicit column order. Unlisted values found in the data are appended; valueless notes land in (none). |
colors |
map | value → hex for column headers. Unlisted columns cycle the auto palette. |
layout
| Key | Default | Meaning |
|---|---|---|
cardWidth |
270 |
Card width in px. |
cardHeight |
44 |
Minimum card height in px. Cards auto-size to their content (title lines, sub, meta, bar, labels); this only sets the floor. |
columnGap |
150 |
Horizontal gap between columns. |
rowGap |
12 |
Vertical gap between stacked cards. |
top |
64 |
Top margin before the first card. |
titleLines |
2 |
Title lines shown before truncating. Set 3 to allow longer titles; cards grow to fit automatically. |
subLines |
1 |
Subtitle (sub) lines shown before truncating. Set 2+ to wrap a long subtitle onto multiple lines; cards grow to fit. |
causalmap
| Key | Type | Meaning |
|---|---|---|
folders |
list of strings | Folders holding the variable notes. Required. |
loopFolders |
list of strings | Folders with loop cards (frontmatter id + label) supplying display labels for declared loops. |
where |
map | Keep only notes whose frontmatter matches, e.g. { status: active }. |
edgesField |
string | Frontmatter field holding the outgoing edges (default affects). |
labelField |
string | Field holding the display label (default label, falling back to the file name). |
typeField |
string | Field holding the node type (default type). |
typeColors |
map | type → hex, overriding the defaults: driver #9b59b6, vice #e74c3c, capability #3498db, virtue #2ecc71. |
title |
string | Heading in the toolbar. |
height |
number | Component height in px. |
properties |
boolean | When true, the note dialog shows all frontmatter. |
layout |
map | nodeWidth (default 180), spacing (270), iterations (300) — tunes the force-directed drawing. |
Using Project Manager task notes
Task notes written by the Project Manager plugin (pm-task: true frontmatter with status, start, due, progress, priority, assignees, tags, parentId/subtaskIds, customFields.*) render as-is: point a level's from: at your *_tasks folder, add the gantt: and kanban: blocks, and you're done.
Markdown Mindmap never writes task files — edit the note and the view re-renders. Editing, drag-rescheduling, notifications, recurring tasks, and the table view are deliberate non-goals.
VS Code
The same core drives a VS Code extension (src/vscode/). Unlike Obsidian it does not render inline in the editor — you run a command and the map opens in a panel.
To run it from source:
- Open this repo's folder in VS Code.
- Press
F5(Run and Debug → Run Extension). It builds, then opens an Extension Development Host window already pointed atexamples/. - In that window, open a markdown note containing a
```mindmapblock (e.g.mindmap-demo/Mindmap demo.md). - Command Palette (
Cmd/Ctrl+Shift+P) → Markdown Mindmap: Open Map. The graph opens beside the note: drag to pan, scroll to zoom, click a card to open that note.
Some differences from the Obsidian plugin:
- Config comes from the active note's first
```mindmapblock (same YAML). from:paths are relative to the workspace root, and links resolve by note basename ortitlefrontmatter — there's no vault link index outside Obsidian.- Visuals follow your VS Code theme (via
--vscode-*variables), so the map looks different by design. - Scope is render + pan/zoom + click-to-open, for whichever view the block's
view:key selects. The toolbar, collapse toggles, and the note dialog are Obsidian-only for now.
Limits
from:is folder-only — no tag or Dataview queries yet.- Link resolution matches a wikilink, basename,
title, orid, not an arbitrary shared field value: a keyword likestage: claimswon't auto-link unless a note of that basename/title/id exists. - Layout centring assumes primary edges connect adjacent levels.
- Gantt has no dependency arrows and no date-range filtering (filters are discrete values). Dates are read, never written — there's no drag-to-reschedule.
- Excalidraw export is lossy by design: rounded boxes, centred labels, straight arrows — no curves, progress bars, label pills, or column headers.
- Causal-map cycle detection is bounded (at most 64 loops, up to 12 nodes long), so a very dense graph reports the first loops found rather than all of them.
Development
npm install
npm run dev     # esbuild watch → main.js (Obsidian) + dist/ (VS Code)
npm run build   # type-check + production build
npm test        # vitest + coverage
Obsidian loads only main.js, manifest.json, and styles.css. For live iteration, symlink this folder into your vault:
ln -s "$(pwd)" "<your-vault>/.obsidian/plugins/markdown-mindmap"
(If you use Obsidian Sync, prefer a Release + BRAT, or commit the built files — Sync can remove a hand-linked plugin folder it doesn't recognize.)
The pure logic lives in src/core/ behind the src/graph.ts barrel, host-free and fully unit-tested; the Obsidian and VS Code adapters wrap it. See AGENTS.md for the architecture and conventions.
License
MIT © Kiko Castro