insightpage-style
 3-ark24 downloads
This Plugin lets you create Charts, render abcjs, popover comment callout within Obsidian to match the styles in insightnote
- Overview
- Scorecard
- Updates4
InsightPage Style is an Obsidian plugin that enhances your notes with rich visual components, interactive diagrams, inline comments, music notation, zoomable timelines, and embedded maps.

💡 Quick Preview: InsightPage Style turns Markdown code blocks into interactive ABC sheet music players, dynamic Observable Plot & charts, inline popover comments, zoomable timelines, and interactive Leaflet maps directly within Obsidian.
Examples
Here are some examples, you can put them in your vault to test
Features & Usage
1. ABC Sheet Music Rendering (abc / abcjs)
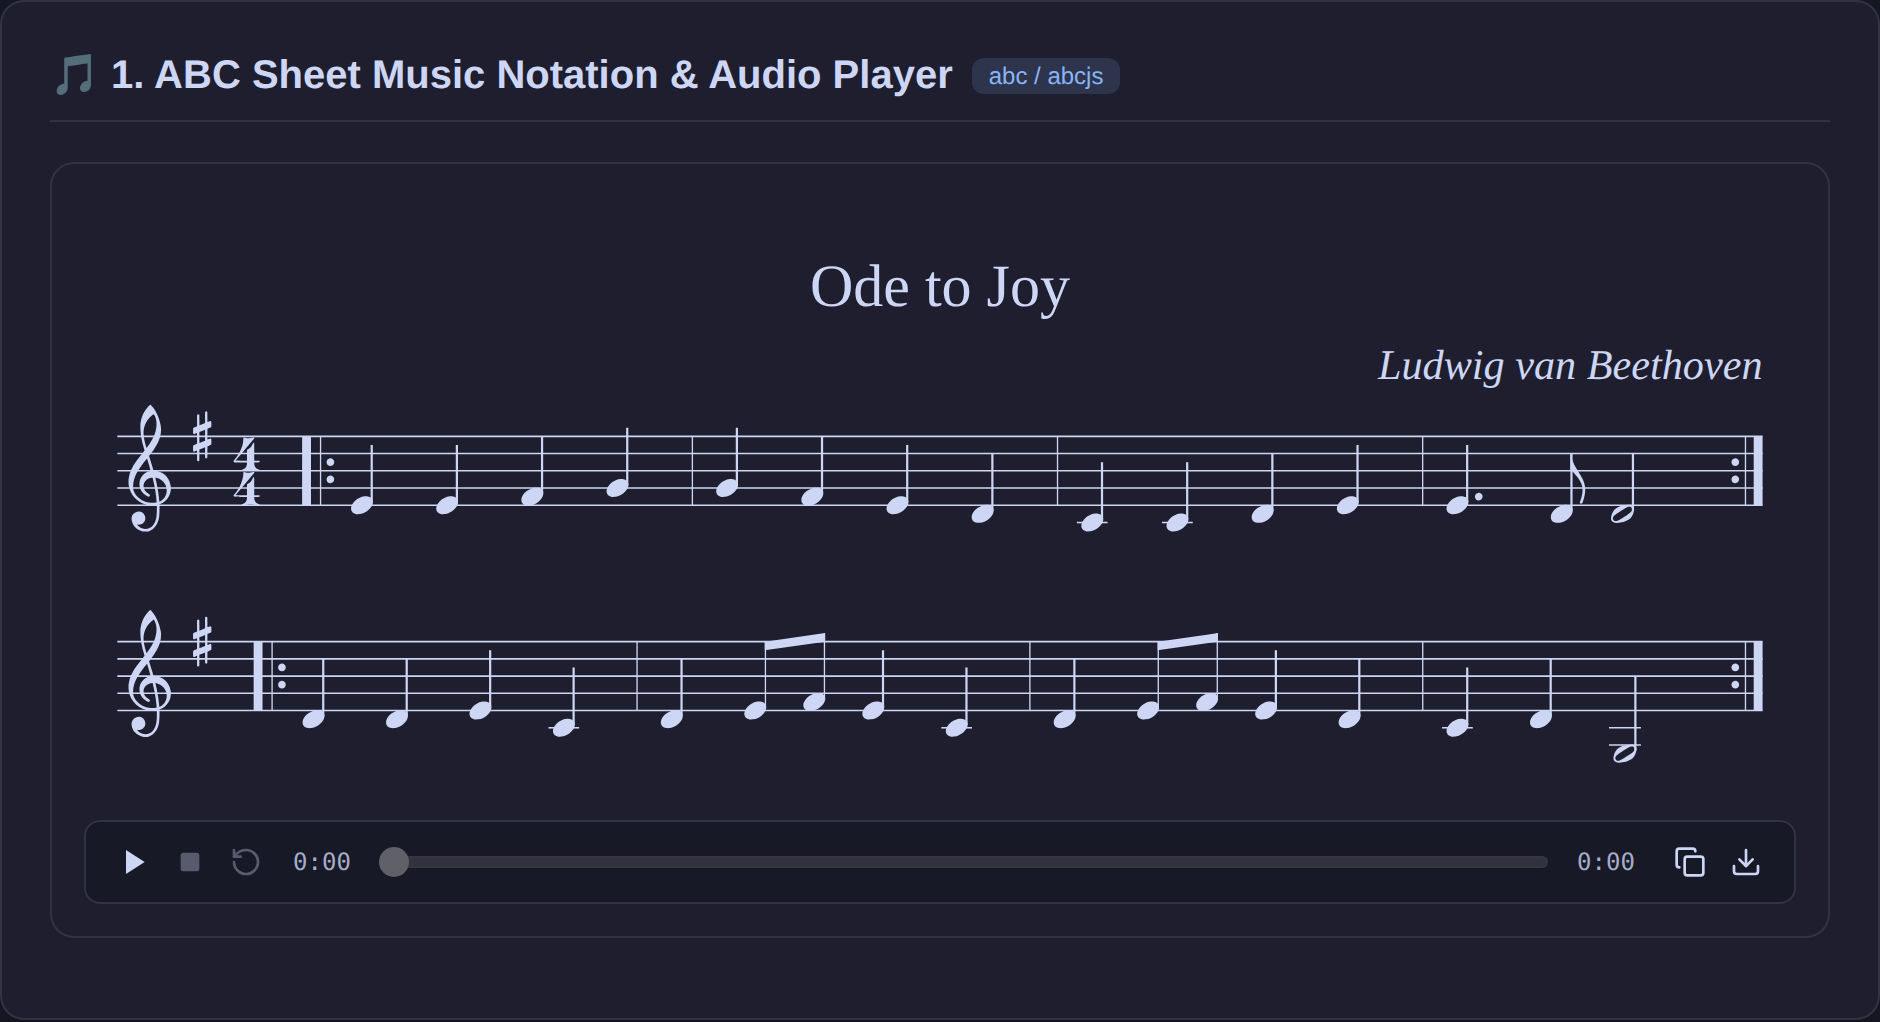
Render musical notation directly in your notes using ABC notation. Includes interactive audio playback, playback progress bar, MIDI export, and copy source controls.
Syntax
Use code blocks tagged with abc or abcjs.
```abc
X: 1
T: Ode to Joy
C: Ludwig van Beethoven
M: 4/4
L: 1/4
K: G
|: E E F G | G F E D | C C D E | E3/2 D/ D2 :|
|: D D E C | D E/F/ E C | D E/F/ E D | C D G,2 :|
```
Key Features:
- Interactive Play/Pause, Stop, and Restart controls.
- Real-time note highlighting during audio playback.
- Progress bar seek control.
- One-click MIDI file download (
.midi) and ABC source copy.
2. Observable Plot & Charts (plot, observable, chart)
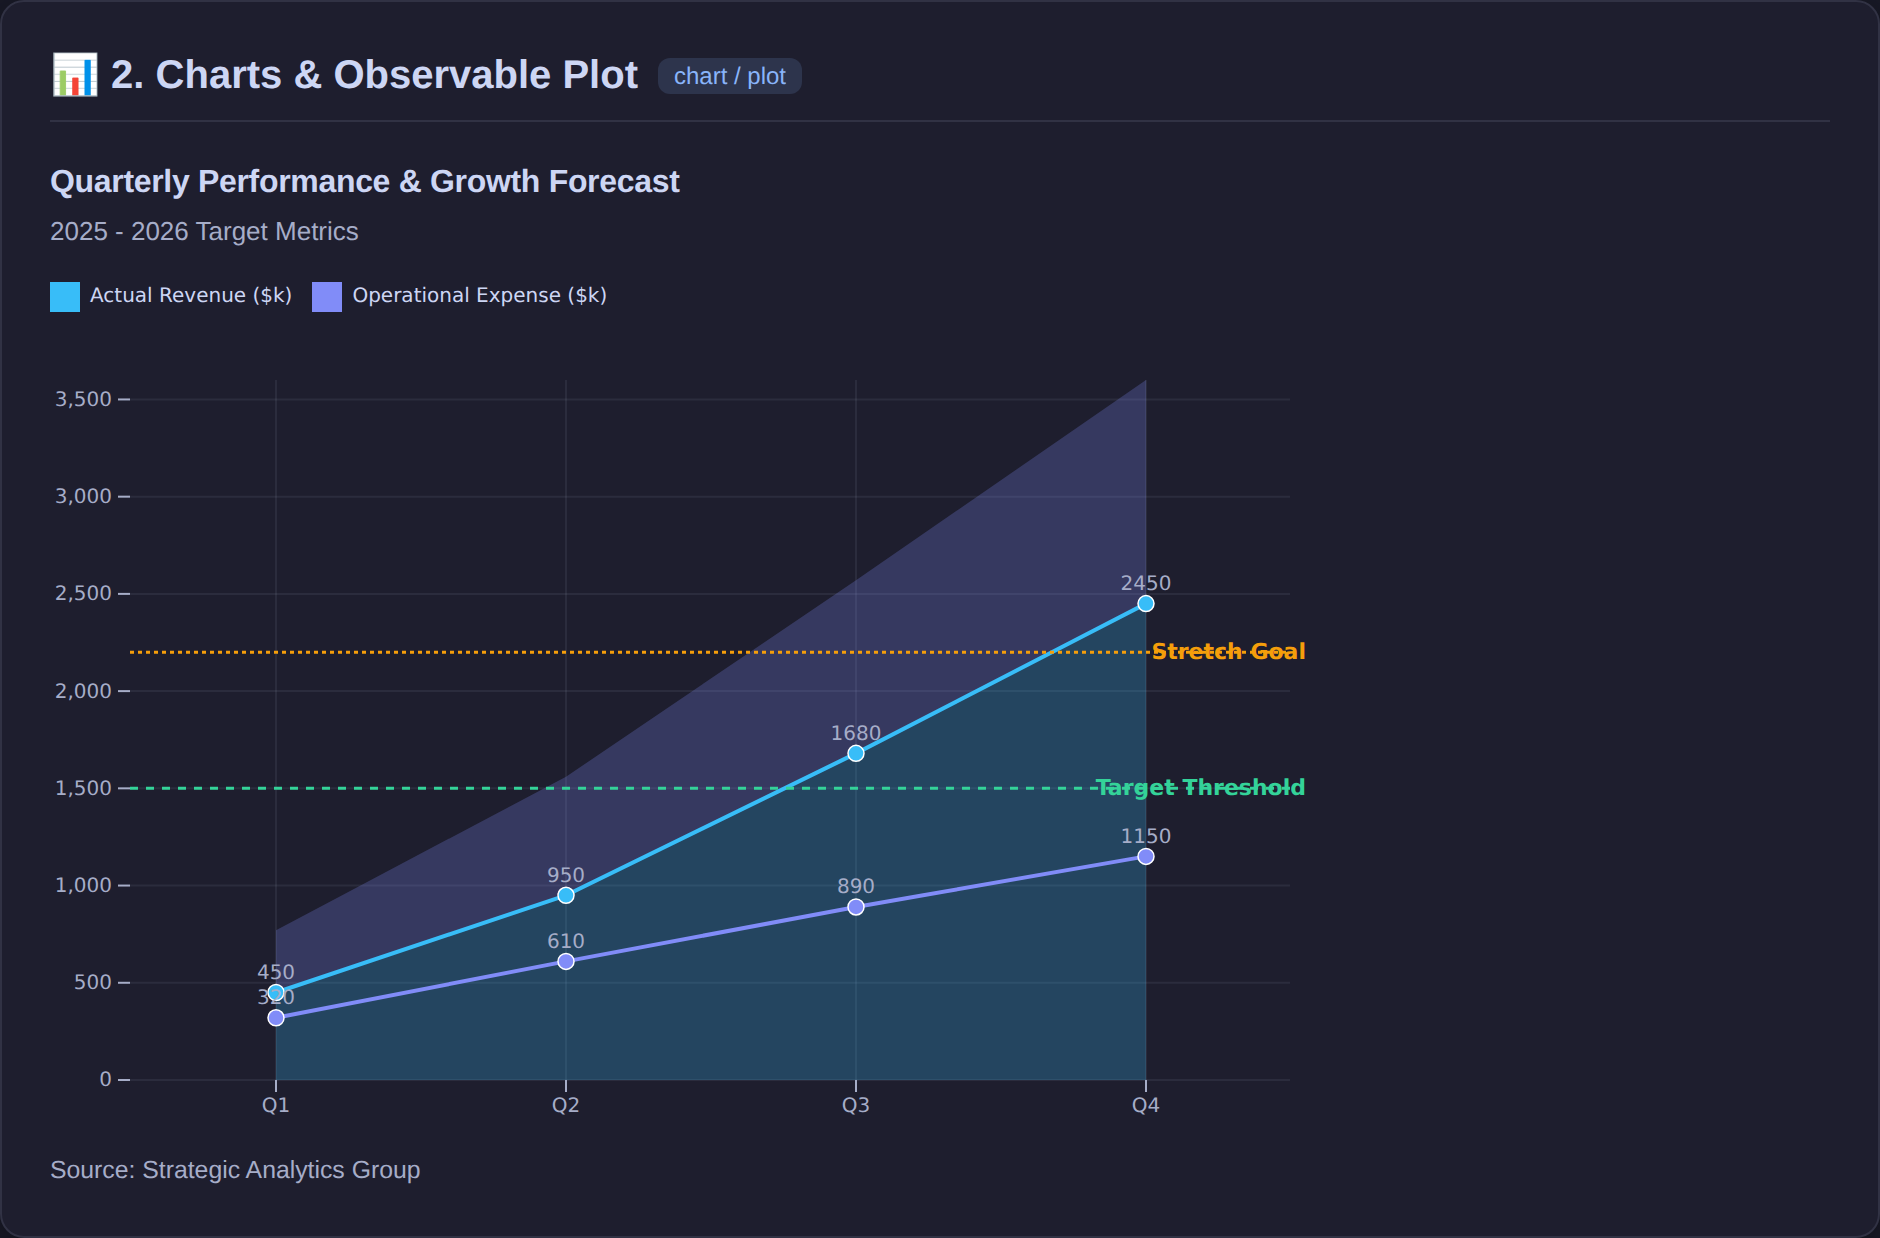
Create interactive, responsive charts using YAML configurations or JavaScript code leveraging Observable Plot and D3.
YAML Chart Examples (chart)
Shared / Universal DSL Configurations
All chart types (bar, line, scatter, pie, doughnut, radar, polararea, sankey) support a set of unified, universal configuration options:
| Option | Type | Supported In | Description |
|---|---|---|---|
title / chartTitle |
string | All charts | Main title displayed above chart. |
subtitle |
string | All charts | Subtitle displayed below title. |
caption |
string | All charts | Caption or footnote displayed below chart. |
legend |
boolean | All charts | Toggle legend display (true or false). |
markLines / markLine |
array / object | bar, line, scatter |
Reference threshold lines with labels and custom styling. |
xLog / yLog / xScale: 'log' / yScale: 'log' |
boolean / string | bar, line, scatter |
Logarithmic scale on X or Y axis. |
fill |
boolean / string | line, scatter, bar |
Toggle area fill (true), or specify custom fill series/color. |
transparency / fillOpacity |
number (0-1) | All charts | Control fill opacity / transparency. |
showLabels / dataLabels / labelFilter |
boolean / array / string | bar, line, scatter |
Show numeric/text data labels above bars/points, or filter specific items. |
xTitle / yTitle (or x.label, y.label) |
string | bar, line, scatter |
Axis label text. |
xMin / xMax, yMin / yMax |
number | bar, line, scatter |
Axis bounds/domains. |
beginAtZero |
boolean | bar, line, radar |
Whether numeric scale begins at zero (default: true for linear). |
Line & Bar Chart with Shared Configurations
```chart
type: line
title: Quarterly Performance
subtitle: 2025 - 2026 Metrics
caption: Source: Finance Department
fill: true
transparency: 0.3
showLabels: true
yLog: true
labels: [Q1, Q2, Q3, Q4]
markLines:
  - y: 1000
    label: Budget Limit
    color: "#ef4444"
    style: dashed
series:
  - title: Revenue
    data: [250, 600, 1200, 2400]
```
Bar Chart with Mark Lines and Data Labels
```chart
type: bar
title: Monthly Sales
showLabels: true
markLine:
  y: 50
  label: Monthly Target
  color: "#10b981"
  style: dotted
labels: [Jan, Feb, Mar, Apr, May]
series:
  - title: Sales
    data: [35, 62, 48, 80, 55]
```
Scatter Chart DSL (scatter, scatterplot, or chart with type: scatter)
```scatter
type: scatter
xTitle: "Height (cm)"
yTitle: "Weight (kg)"
trendline:
  stroke: "#3b82f6"
  strokeWidth: 2
  ci: true
markLines:
  - axis: x
    value: 175
    label: Average Height
    color: "#10b981"
    style: dashed
series:
  - title: Athletes
    data:
      - [160, 55]
      - [170, 68]
      - [180, 75]
      - [185, 82]
```
Sankey Diagram
```chart
type: sankey
labels: [Solar, Wind, Grid, Homes, Industry]
series:
  - data:
      - [Solar, Grid, 40]
      - [Wind, Grid, 60]
      - [Grid, Homes, 50]
      - [Grid, Industry, 50]
```
JavaScript Observable Plot Codeblocks (plot, observable)
Execute custom Observable Plot JavaScript code with full access to Plot, d3, el, app, and vault fetch().
```plot
const data = [
  { year: 2020, value: 10, category: "A" },
  { year: 2021, value: 25, category: "A" },
  { year: 2022, value: 18, category: "B" },
  { year: 2023, value: 30, category: "B" }
];

Plot.plot({
  color: { legend: true },
  marks: [
    Plot.lineY(data, { x: "year", y: "value", stroke: "category", marker: "circle" }),
    Plot.tip(data, Plot.pointerX({ x: "year", y: "value" }))
  ]
})
```
Vault File Fetching in JavaScript Plots:
You can load CSV, JSON, or text files directly from your Obsidian vault using fetch():
```plot
const response = await fetch("data/sales.csv");
const text = await response.text();
const data = d3.csvParse(text, d3.autoType);

return Plot.plot({
  marks: [
    Plot.barY(data, { x: "Month", y: "Revenue", fill: "Category" })
  ]
});
```
Rendering from Markdown Tables in the Same Note
You can use any Markdown table in the same note as the data source for Observable Plot! Simply refer to table directly in your plot block, or specify // table: #my-table-id:
| Location | Density | Population | Land area (km2) |
| --- | --- | --- | --- |
| Monaco | 19428 | 38857 | 2 |
| Singapore | 8290 | 6110200 | 737 |
| Gibraltar (UK) | 5800 | 39329 | 6.8 |
| Vatican City | 2205 | 882 | 0.44 |
| Bahrain | 2034 | 1607049 | 790 |
| Maldives | 1759 | 527799 | 298 |
| Malta | 1686 | 539607 | 320 |
| Bangladesh | 1333 | 173562364 | 130170 |
^tablecountries

```plot

Plot.plot({
  title: "Population vs. Land Area from Note Table",
  width: 700,
  height: 380,
  grid: true,
  x: { type: "log", label: "Land Area (km²) →" },
  y: { type: "log", label: "↑ Population" },
  marks: [
    Plot.dot(tablecountries, {
      x: "Land area (km2)",
      y: "Population",
      fill: "Density",
      r: 6,
      tip: true
    }),
    Plot.text(tablecountries, {
      x: "Land area (km2)",
      y: "Population",
      text: "Location",
      dy: -10,
      fontSize: 10
    })
  ]
})
```
3. Inline Popover Comments (::cmt[] / ::cmt{})
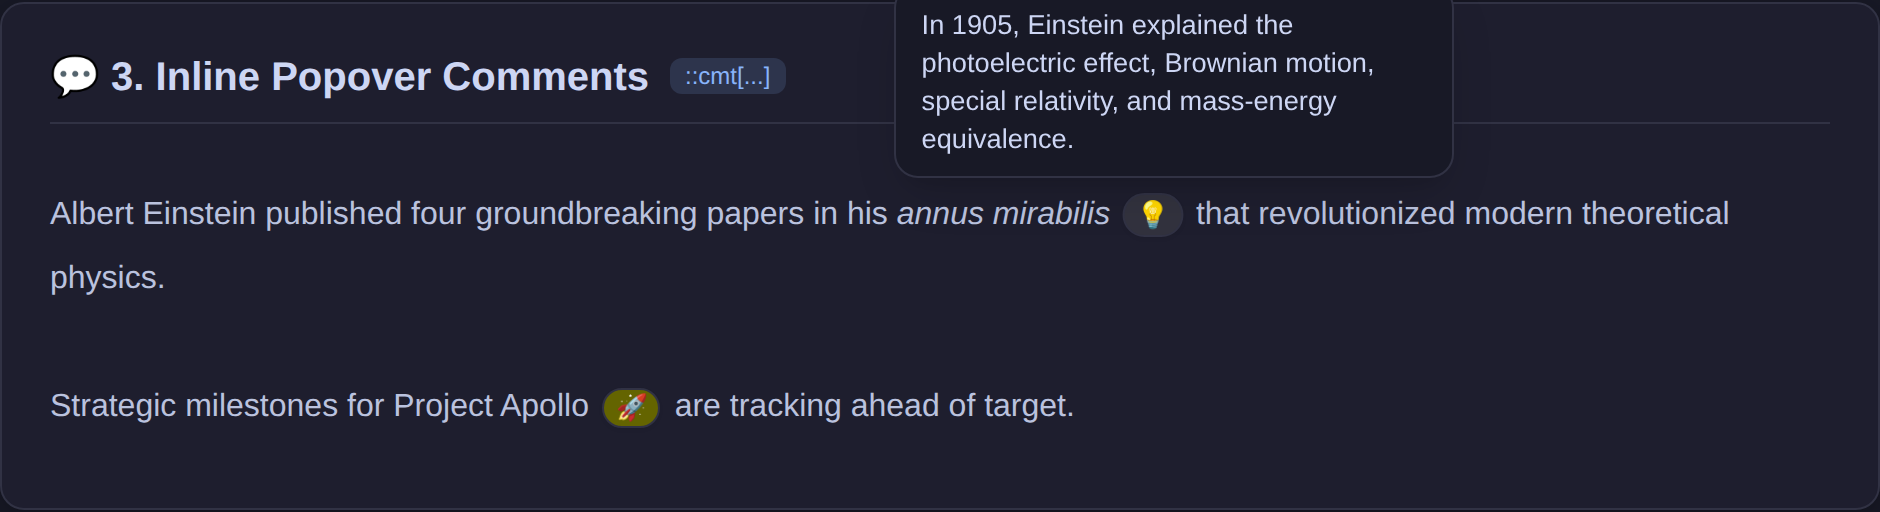
Add compact, non-intrusive popover comment callouts directly inside your text paragraphs.
Syntax
Use ::cmt[Comment text] or ::cmt{Comment text} anywhere in markdown text:
This is a key insight ::cmt[💡 Remember to review this section before the presentation!] that needs attention.

You can also include emojis or markdown formatting: ::cmt[🚀 Important: Launch date scheduled for Q3.]
Key Features:
- Displays as a clean, styled emoji trigger button in screen view.
- Hover or click to toggle a popover containing the comment text.
- Clean print formatting so comments appear inline when exporting to PDF or printing.
- Supports nested brackets
::cmt[Note [version 2.0] updated]and formatting.
4. Zoomable Timeline (timeline)
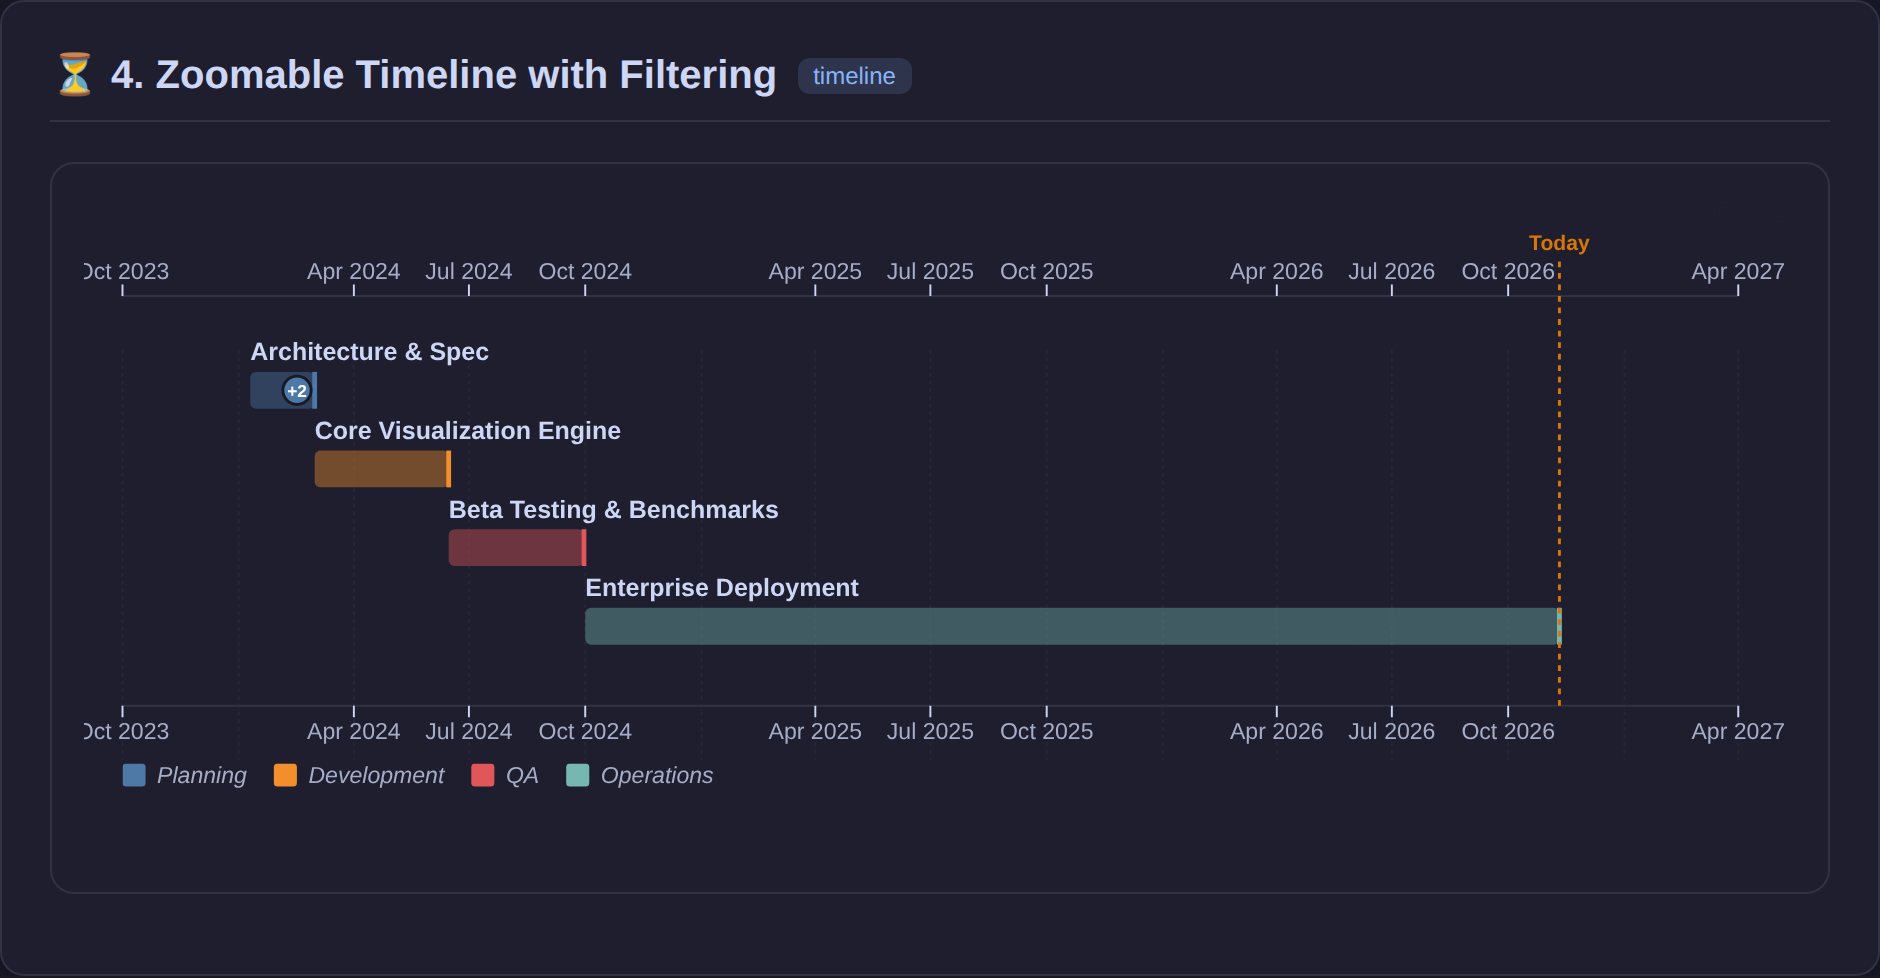
Render interactive, zoomable event timelines with category filters, ongoing event tracking, collection badges, and SVG export.
Syntax
Use code blocks tagged with timeline. Supports JSON, JavaScript object literal, or YAML format.
```timeline
[
  {
    "title": "Project Kickoff",
    "start": "2023-01-15",
    "end": "2023-03-01",
    "category": "Planning",
    "collection": ["Spec Doc", "Budget"]
  },
  {
    "title": "Beta Testing",
    "start": "2023-03-15",
    "end": "2023-06-30",
    "category": "Development"
  },
  {
    "title": "Production Deployment",
    "start": "2023-07-01",
    "ongoing": true,
    "category": "Operations"
  }
]
```
Key Features:
- Zoom & Pan: Smooth mouse wheel zooming and click-and-drag panning.
- Category Filter: Radio button toggles to filter timeline views by category.
- Ongoing Events: Shows dynamic "Today" indicator line for active/ongoing events.
- Collection Badges: Expandable collection item badges with interactive tooltips.
- Export & Copy: Quick action buttons to copy timeline source data or download as SVG.
5. Leaflet Map Rendering (map / leaflet)
Embed interactive maps with markers, popups, lines, polygons, circles, and GeoJSON support using Leaflet.
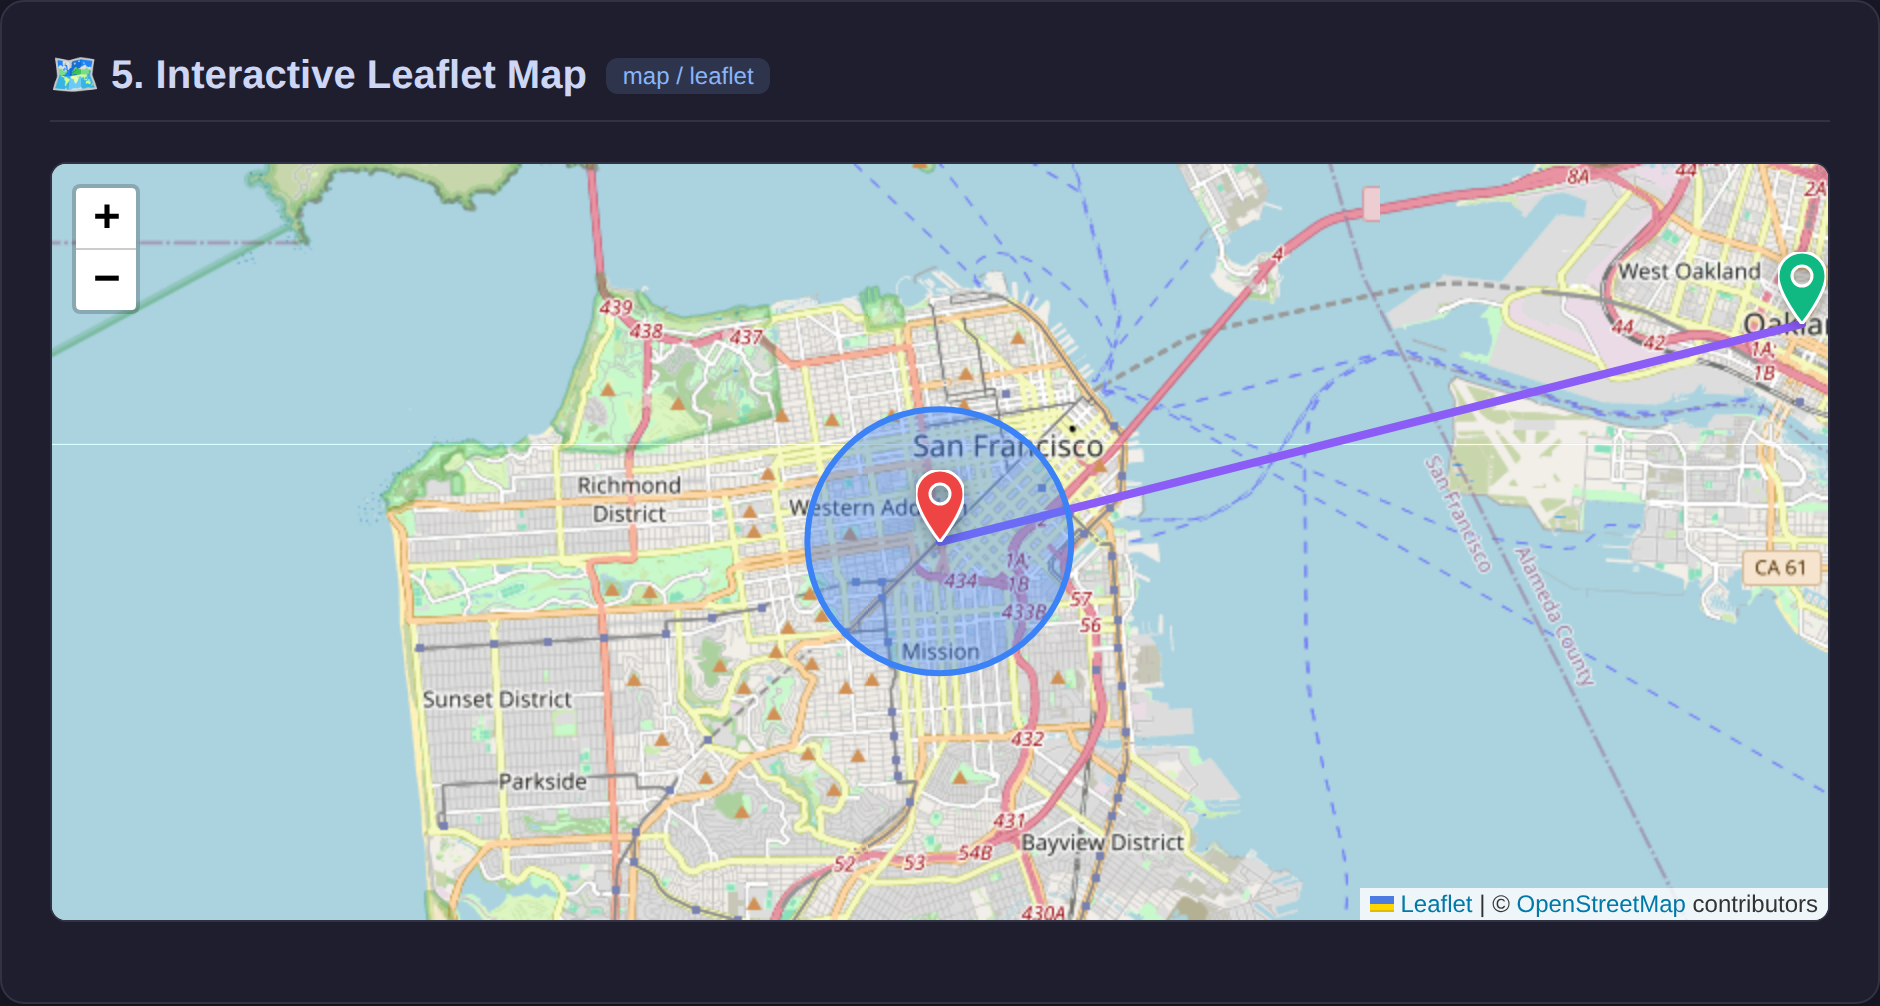
Syntax
Use code blocks tagged with map or leaflet.
```map
center: [37.7749, -122.4194]
zoom: 12
height: 400px
markers:
  - lat: 37.7749
    lng: -122.4194
    title: "San Francisco"
    popup: "Welcome to San Francisco!"
    color: "#ef4444"
circles:
  - lat: 37.7749
    lng: -122.4194
    radius: 1000
    color: "#3b82f6"
    popup: "1km Radius Zone"
```
Advanced Map Features
- Custom Tile Servers: Specify custom tile URLs via
tileServer. - Fit Bounds: Automatically fit map view to all elements with
fitBounds: true. - Polylines & Polygons: Draw routes or areas with customizable line weights, colors, and fill opacities.
- GeoJSON Layers: Render complex GeoJSON objects or FeatureCollections.
```map
fitBounds: true
lines:
  - points: [[37.7749, -122.4194], [37.8044, -122.2712]]
    color: "#10b981"
    weight: 4
    popup: "Bay Bridge Route"
polygons:
  - points: [[37.77, -122.42], [37.78, -122.45], [37.75, -122.44]]
    fillColor: "#8b5cf6"
    fillOpacity: 0.5
    popup: "Custom Area"
```
Development & Testing
Installation & Build
# Install dependencies
pnpm install

# Run unit tests
npx tsx --test tests/*.test.ts

# Build production bundle
pnpm run build
Credits & Acknowledgments
Special thanks to the authors and maintainers of the open-source projects and libraries that make InsightPage Style possible:
- obsidian-charts by phibr0: Special thanks! Some code in the simple chart rendering part and settings page are adapted from here.
- Leaflet.js: For interactive map rendering engine and map features (
map/leafletblocks). - abcjs: For ABC sheet music notation rendering and interactive audio player (
abc/abcjsblocks). - Observable Plot: For expressive visual plot rendering (
plot,observableblocks). - D3.js: For data transformations, scales, and visualization utilities.
- chroma-js: For color manipulation and color palette generation.
- Vanilla Picker: For color picker interface in settings tab.
- Svelte: For reactive modal and section UI components.
License
AGPL-3.0 License.