Clew
 Christian Luger820 downloads
Clew is a Knowledge Explorer for your Obsidian vault - not just another way to draw the graph.
- Overview
- Scorecard
- Updates25

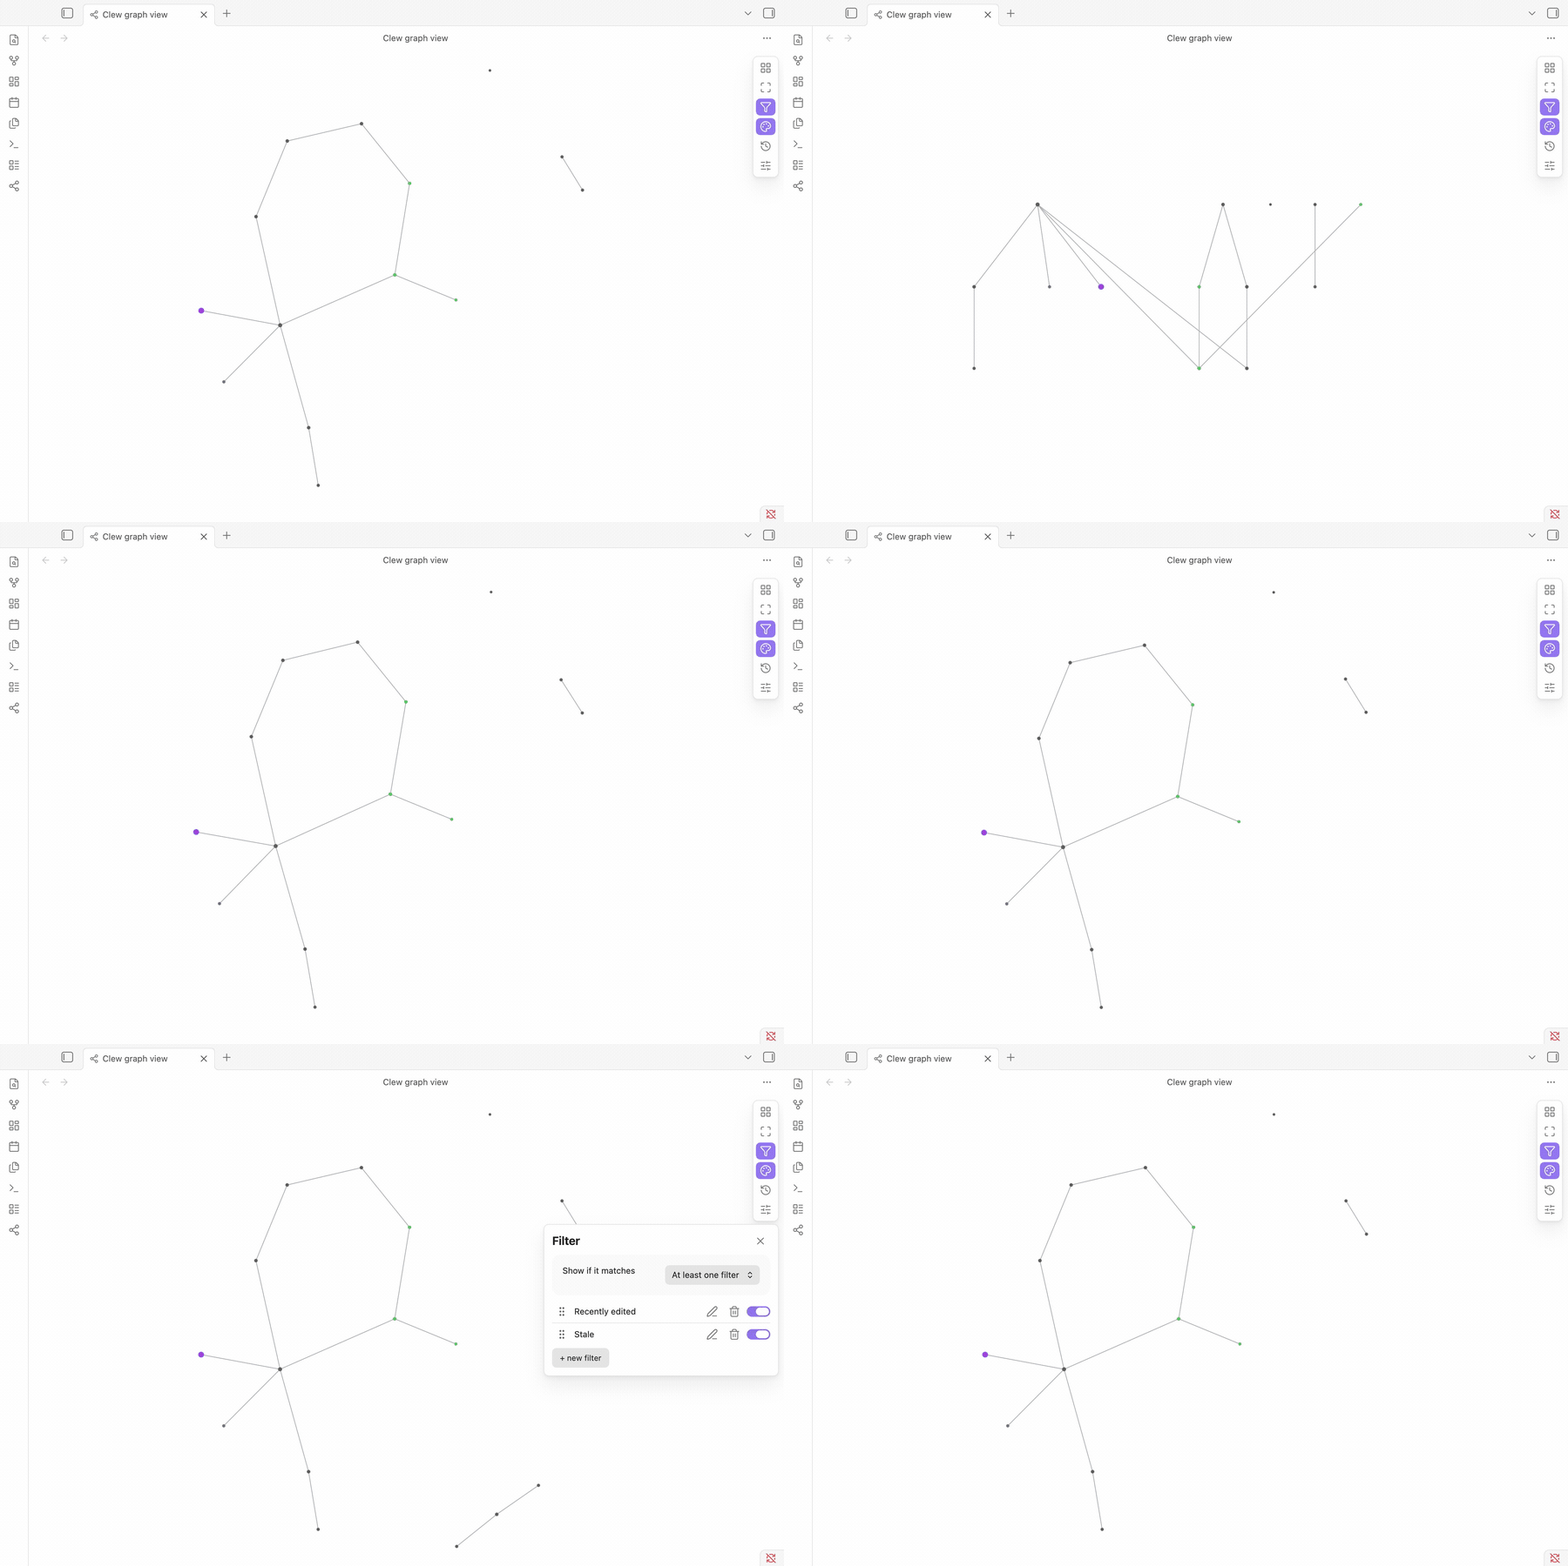
Clew is a Knowledge Explorer for your Obsidian vault - not just another way to draw the graph. Every note is a node, every link an edge, but on top of that Clew runs real analytics (betweenness, PageRank, community detection, connected components) and lets you filter, color, and size notes by what it finds - so you can understand how your vault actually connects, not just look at it.
A plugin for Obsidian. Full documentation (with more screenshots) lives at the Clew guide.
Why use it
Obsidian's built-in graph shows everything at once, but it's a single fixed view: one color scheme, one layout, no analysis beyond what you can eyeball. Clew is a second, purpose-built graph view layered on top of your vault, and it can tell you things the built-in one can't:
- Which notes are hubs. Notes with more links render larger by default, and a link-count filter lets you isolate them directly - the notes the rest of your vault actually depends on.
- Which notes bridge otherwise-separate parts of your vault. Betweenness centrality finds the notes that sit on the path between two topic areas - remove one and the vault would split apart. PageRank finds the notes that are prominent because well-connected notes link to them, not just because they have many links.
- Which notes are orphaned or isolated. With no links in or out, they drift to the outskirts under the default Force layout on their own - and the Diagnostics panel lists them, along with broken links and clusters cut off from the rest of the vault, directly.
- Which topic areas have gone stale, or are scattered across mismatched folders. The "Activity" criterion detects communities of linked notes and compares how recently each one was edited relative to the others. "Structure" compares the same communities against your folder layout - so a group of notes that clearly belongs together by links, but is scattered across five different folders, becomes visible without you tracking it by hand.
- How everything relates to one specific note. The Radial layout rings out every other note by hop distance from a note you pick, or Focus narrows the whole graph down to just that note's neighborhood.
- How your vault grew over time. The Timeline panel replays notes and links in creation order, revealing bursts of activity or long quiet stretches.
- How two specific notes connect. Find path traces a route through the link graph between them, favoring notes with fewer links over big hub/index notes even if that route has more hops.
Nothing here edits your notes - filters, groups, and appearance settings are Clew's own saved state, completely separate from your note content.
Getting started
- Install the plugin (see below) and enable it.
- Click the Clew icon in the left ribbon, or run "Open graph view" from the command palette (
Ctrl/Cmd+P). - That's it - the graph builds itself from your vault, no configuration needed. Everything below is optional tuning.
What you can do
- See your whole vault as a graph. Every note and link, laid out automatically - no setup, no manual arrangement.
- Run real graph analytics on your notes. Betweenness centrality (bridge notes), PageRank (prominent notes), community detection (topic clusters), and connected-component analysis (isolated pockets) - all computed on demand, not just approximated by node size.
- Get structural diagnostics in one panel. Orphaned notes, broken links, isolated clusters, and communities scattered across mismatched folders - each with a one-click "show me on the graph."
- Choose a layout that fits what you're looking at. Force-directed (the default - related notes cluster together), Hierarchical (top-down, for vaults with a real outline structure), Radial (rings out from one note by link distance), or Circular (every note evenly spaced, good for spotting recurring patterns). The layout picker explains what each one is for.
- Focus on one note. Narrow the whole graph down to a single note and its neighborhood, out to however many hops you pick, with everything else out of the way.
- Filter down to what matters. Build named, reusable filters from tags, properties, folder, filename, text, link count, edit recency, activity, structure, bridging, prominence, connectivity, or community - and invert any of them ("in this folder" ↔ "not in this folder") with one click. Combine several filters with either/or logic.
- Color and size notes by your own rules. Same criteria as filtering, applied as named, colored groups instead - so "everything tagged #project," "notes I haven't touched in 30 days," or "this note's own community" gets its own color and size at a glance, with a legend explaining what's on screen.
- Watch your vault grow. The Timeline panel replays your notes and links in the order they were created - pick how long the replay takes and whether it paces evenly or maps onto real elapsed time.
- Tune the look live. Node/edge size, color, physics, and label density are all adjustable while watching the graph react.
- Interact directly with the graph. Click a node to open that note, hover one to highlight its connections, drag a note to pin it exactly where you want it.
- Find how two notes connect. Pick a start and end note and Clew finds the shortest route through the link graph - favoring notes with fewer links over big hub notes, with a couple of alternative routes alongside. Notes and folders excluded in Settings are routed around entirely and get a ring on the graph so you can see which ones at a glance.
Installing the plugin
From the Community Plugins browser
- Open Settings → Community plugins → Browse in Obsidian.
- Search for Clew and click Install, then Enable.
Manual installation
- Download
main.js,styles.css, andmanifest.jsonfrom the latest release. - Copy them into
<YourVault>/.obsidian/plugins/clew/. - Reload Obsidian and enable Clew under Settings → Community plugins.
Compatibility
- Requires Obsidian 1.12.0 or later.
- Works on desktop and has been verified on a real tablet (iPad, Obsidian mobile) - see DEVELOPMENT.md for details.
Support
Found a bug or have a feature request? Please open an issue.
If Clew helps you, a ⭐ on the repo makes it easier for others to discover - thank you!
Contributing
Contributions are welcome. See CONTRIBUTING.md for how to report issues, set up the project, and open a pull request, and DEVELOPMENT.md for the local dev workflow and the release process.
Quick start:
nvm use        # activate the Node version from .nvmrc
npm install    # install dependencies
npm run dev    # compile src/main.ts to main.js in watch mode
npm run build  # type-check and produce a production build
npm run lint   # ESLint, incl. the Obsidian-specific ruleset
API documentation
License
Clew is licensed under MIT.