Three D Graph View
 Steve949 downloads
A graph-style view that can be rotated in 3D space.
- Overview
- Scorecard
- Updates7
Built by Sidepath Studio.
Built by Sidepath Studio - small apps, practical tools, and digital experiments.
Three D Graph View is a released Sidepath Studio tool for Obsidian, built to make vault structure easier to explore from another angle.
Overview
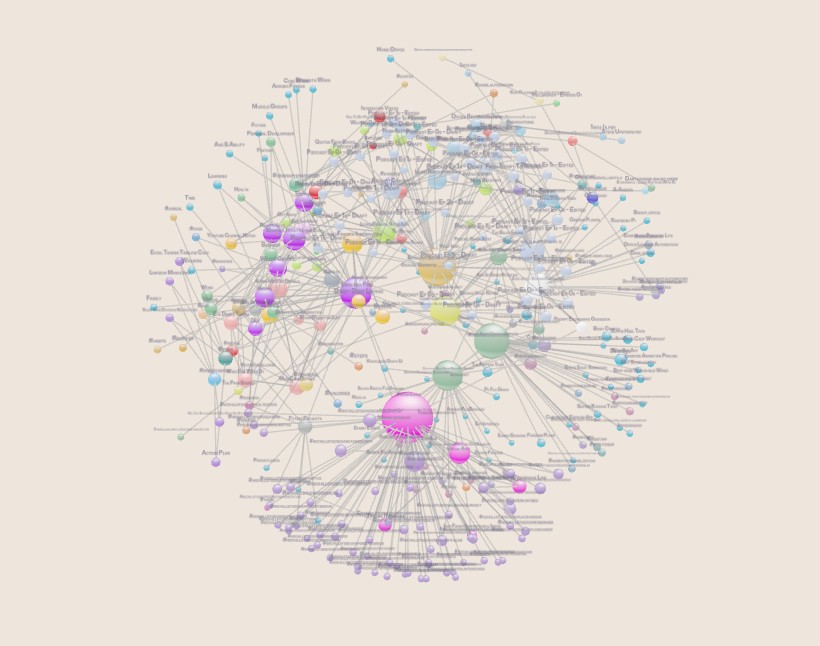
Three D Graph View adds a rotatable, graph-style view for exploring notes, links, backlinks, folders, tags, and vault growth over time.
It is designed for visual scanning: find clusters, see folder groups, inspect direct relationships, and keep the note you are working on visible inside a larger vault structure.
Find the note you are working on
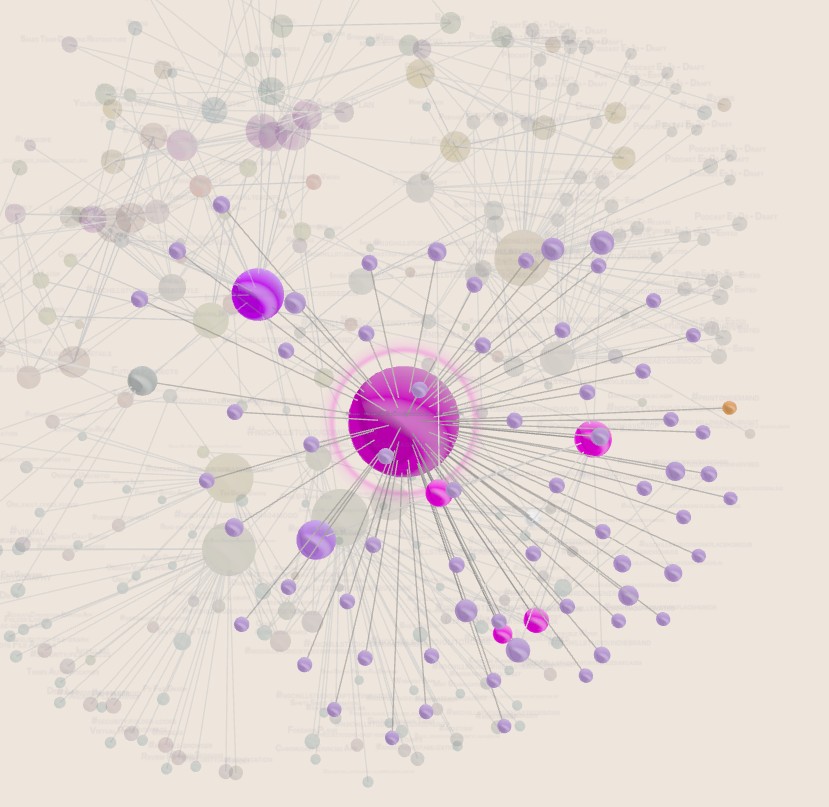
The currently open markdown note is brought into focus and marked with a subtle pulse and sonar ping.
Watch the active note sonar demo
Folder and tag colouring
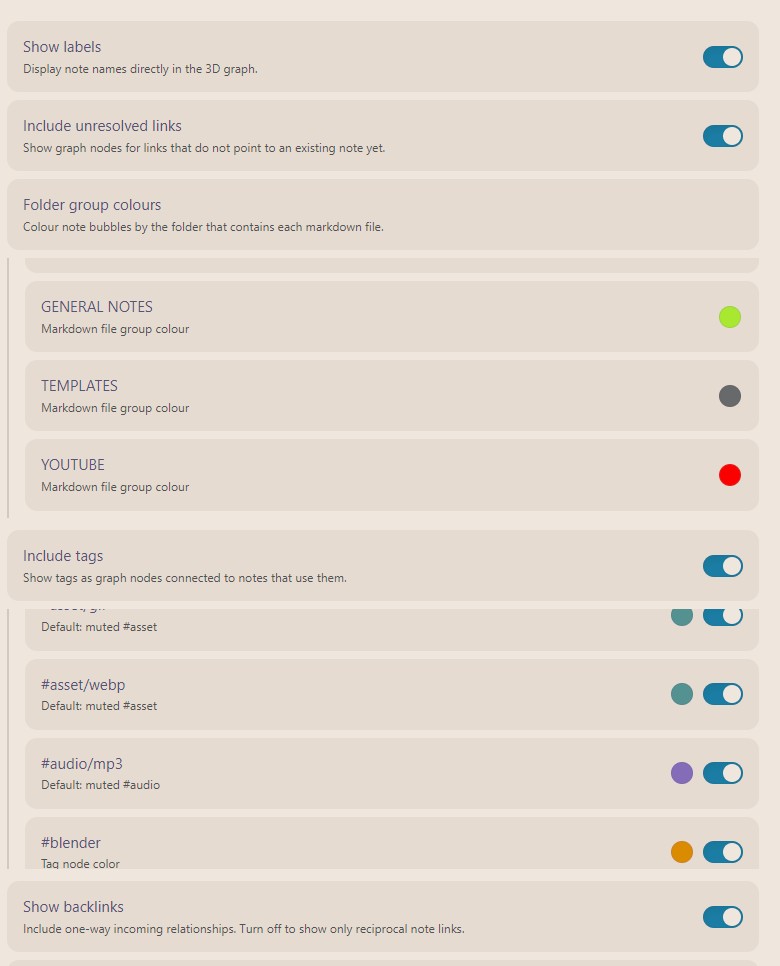
Colour note bubbles by folder, then layer tag nodes on top for another way to read structure across the vault.
Explore connected notes
Hover over a node to keep it and its direct connections clear while the rest of the graph fades back.
Watch your vault build over time
Timelapse mode replays the graph in note creation order, making the shape of the vault easier to understand as it grows.
Features
- Rotate, pan, zoom, and auto-rotate through a 3D vault graph.
- Core-to-surface spherical layout for a globe-like graph volume.
- Folder-based note colours with per-folder colour controls.
- Optional tag nodes with per-tag colours and muted sub-tag inheritance.
- Current note focus with pulse and sonar ping.
- Hover highlighting for a node and its direct connections.
- Viewport-aware fit with dense-centre rotation.
- Timelapse replay based on note creation order.
- Settings for labels, unresolved links, backlinks, tag visibility, disconnected group spread, node size, and sphere strength.
Usage
Open the command palette and run Open 3D graph view.
The graph toolbar includes refresh, fit, settings, timelapse, and auto-rotate controls.
Manual installation
Download main.js, manifest.json, and styles.css from a release and copy them into:
<vault>/.obsidian/plugins/three-d-graph-view/
Then enable Three D Graph View in Obsidian's community plugin settings.
Development
npm install
npm run dev
For a production bundle:
npm run build
Privacy
Three D Graph View builds its graph locally from markdown files, links, tags, folders, and file timestamps in your vault. It does not make network requests or send vault data anywhere.
Brand
Three D Graph View is built by Sidepath Studio - small apps, practical tools, and digital experiments.
Support
If Three D Graph View is useful in your vault, you can support Sidepath Studio here:
License
MIT