Function Plot
 leonhma20k downloads
Render mathematical functions in a Markdown code block.
- Overview
- Scorecard
- Updates8
A plugin for displaying mathematical graphs in obsidian.md.
⭐ Remember to star this plugin on Github if you like it!
This file only contains basic instructions to get you to using this plugin quickly. If you want a more detailed documentation, take a look at the wiki.
🔮 How to use
With Command
Since version 1.1.0 you can create plots via a handy GUI with live-preview functionality.
Open the command palette and select
Obsidian Functionplot: Plot a FunctionAdjust the plot to your liking.

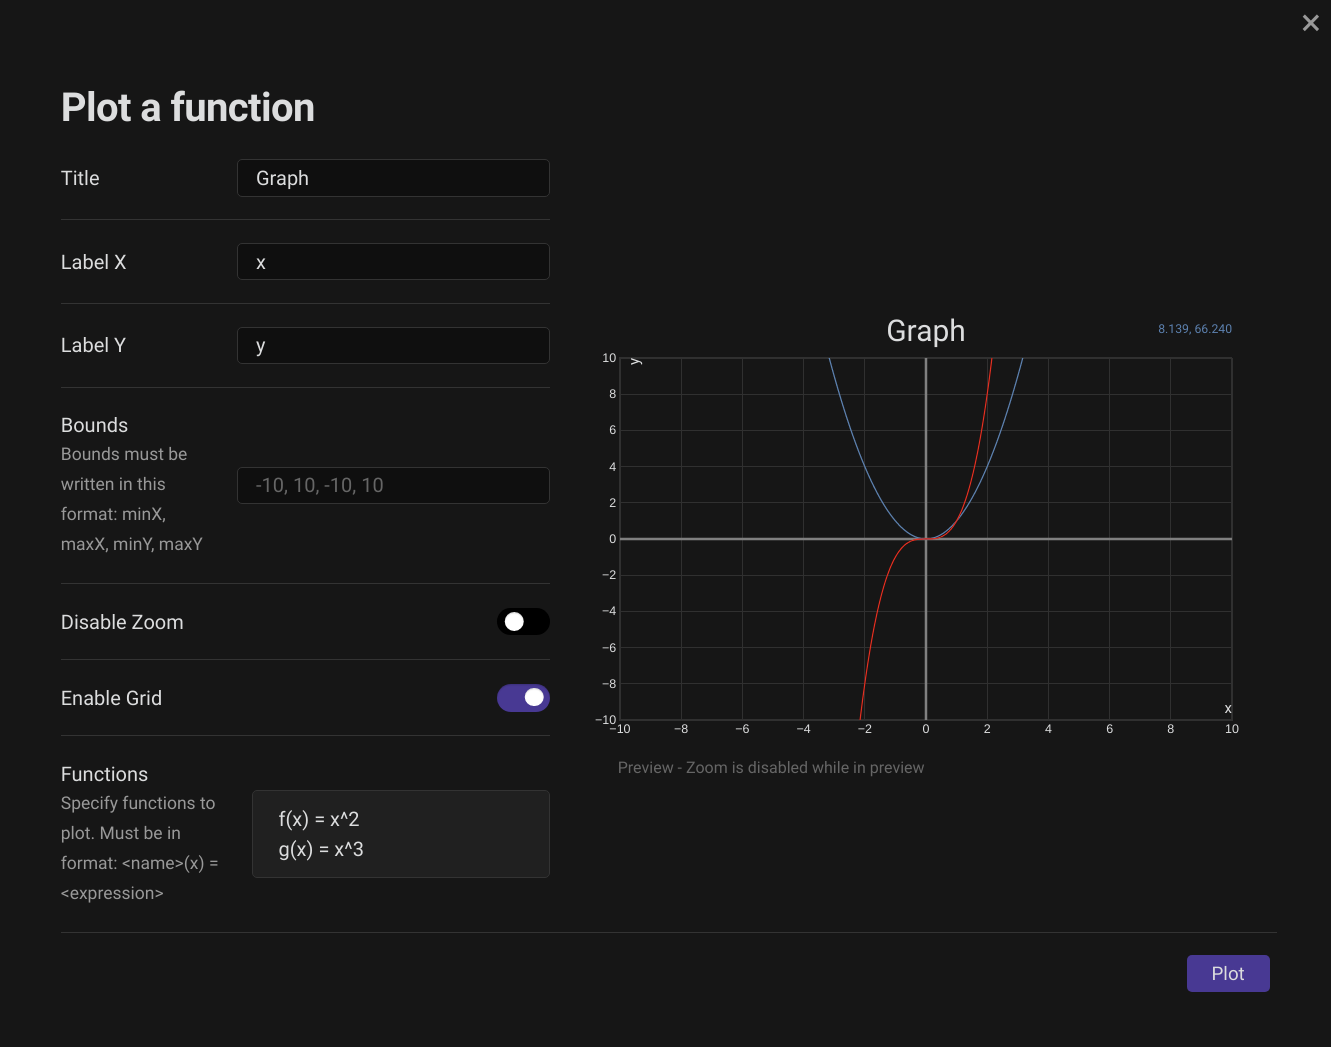
This will create a coordinate system with bounds
-10 < x < 10, -10 < y < 10and plot the functions f and g. If you havent disabled it, you can even drag and zoom the graph.
With functionplot Block
```functionplot
---
title: string
xLabel: string
yLabel: string
bounds: array[min x, max x, min y, max y]
disableZoom: boolean
grid: boolean
---
<name>(variable)=<expression>
```
Example:
```functionplot
---
title: The random graph
xLabel: Time
yLabel: Cost
bounds: [0, 10, 0, 50]
disbaleZoom: 1
grid: true
---
g(x)=x^PI
f(x)=E+log(x)*2
```
🧮 Supported Math
To see the complete list of supported math functions, please check the wiki.
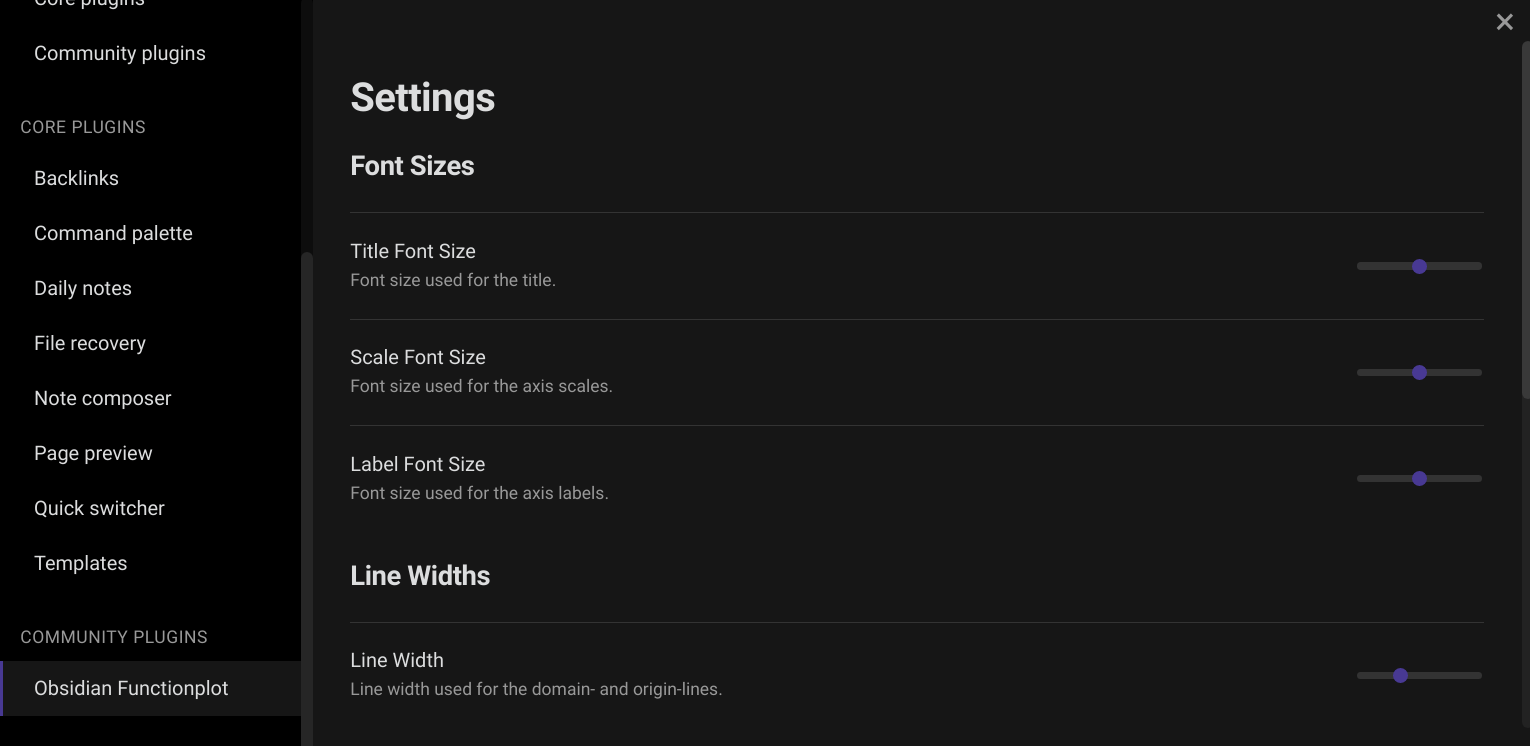
⚙ Plugin Settings
Since version 1.2.0 there's a dedicated settings page for this plugin. Here you can adjust things like font sizes for the text elements of the plot, line widths and various colors. To access this page, head to the obsidian settings and scroll down the list to 'Community Plugins > Obsidian Functionplot'.
Note
For changes to be applied, Obsidian needs to "re-render" the chart. You can either restart Obsidian, or switch between view modes (eg. Reading mode > Edit mode > Reading mode).
❓ Questions
If you have any questions about the usage of the plugin, take a look at the wiki or post a question in the discussions.
🐞 Bugs and Errors
If you encounter any errors while using this plugin, please report them to us. To do so, click this link, fill out the form as best as you can and click Submit new issue. These issues are publically viewable, so please don't submit any personal information.
🤝 Contributing
Contributions are always welcome! Be it submitting issues, editing the wiki or creating a pull request, contributions by people like you help keep the project evolving. Please adhere to the contributing guidelines.
©️ Attribution
This plugin is based on / uses:
- function-plot: MIT License, Copyright (c) 2015 Mauricio Poppe