Live Plots
 Andrea11 downloads
Live, interactive Desmos graphs from desmos-graph code blocks. Requires a free Desmos API key.
- Overview
- Scorecard
- Updates3
Live Plots turns a desmos-graph code block into a real Desmos calculator
inside the note — one you can pan, zoom and drive with sliders, in Reading view
and in Live Preview. Curves label themselves, typeset, in the curve's own colour,
and the block text stays the only source of truth: interaction is ephemeral, and
one explicit "save view" writes back the viewport and the slider values.
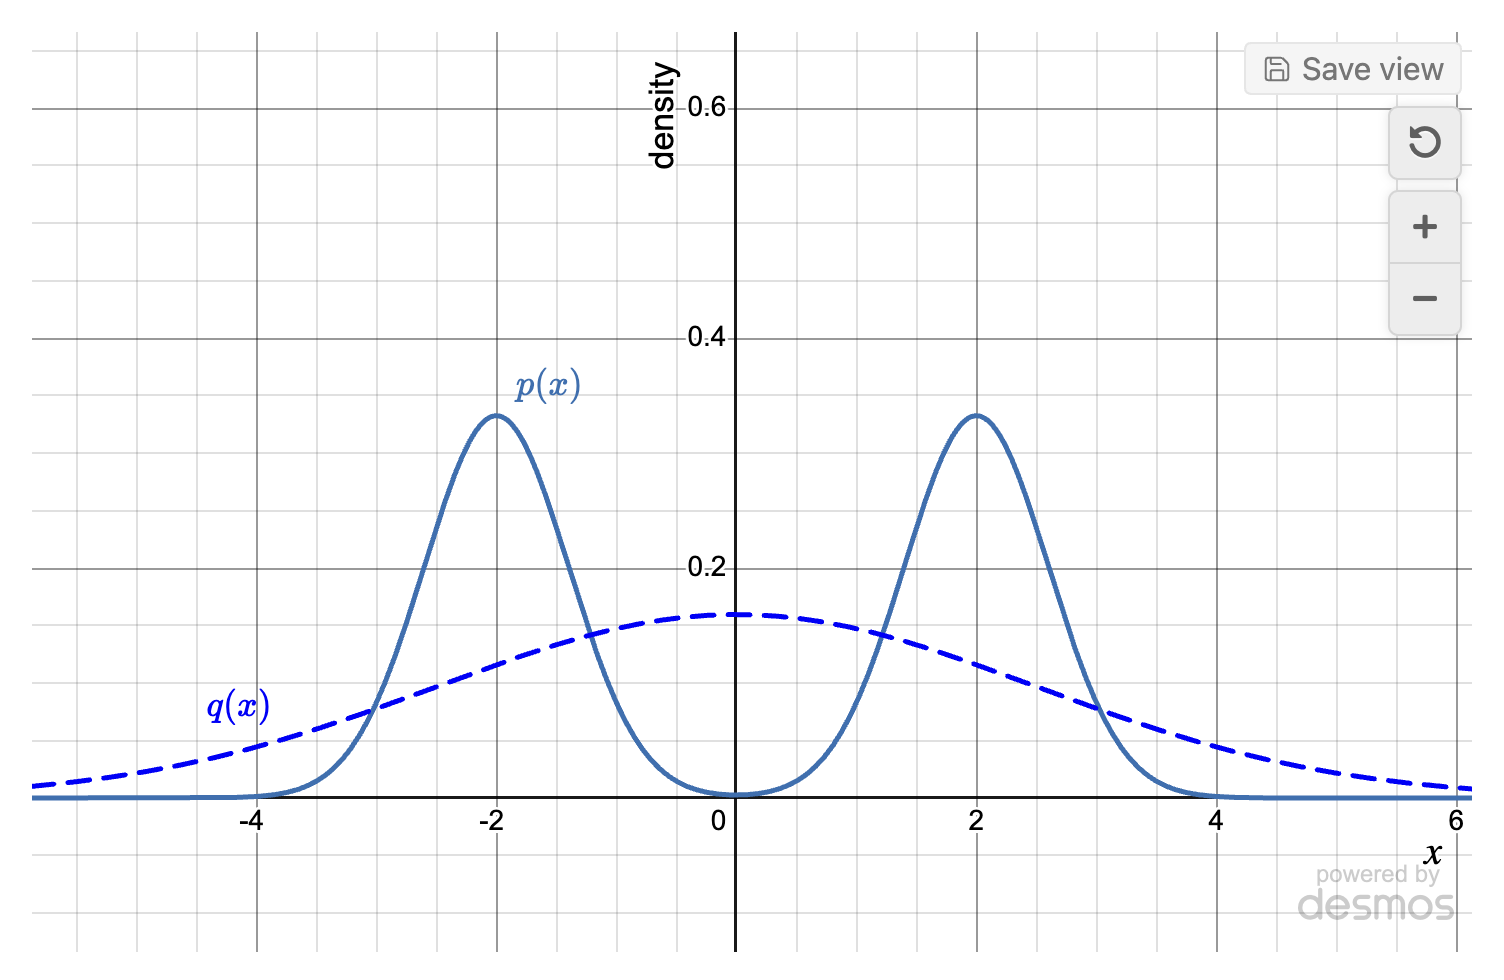
The grammar is a strict superset of obsidian-desmos 0.6.8, so notes written for that plugin render unchanged.
Requirements
Obsidian 1.11.4 or later, on desktop, and a free Desmos API key (below). The plugin never bundles the Desmos API; it downloads it once with your key.
Installing
Once the plugin is in the community directory: Settings → Community plugins → Browse → Live Plots → Install, then Enable.
Until then, either add the repository to BRAT,
or install by hand: take main.js, manifest.json and styles.css from a
release, put them in <vault>/.obsidian/plugins/live-plots/, and reload the
Obsidian window.
If you are coming from obsidian-desmos, disable it first — only one plugin can render a given code fence, and a window restart (not a plugin reload) is what frees it.
The plugin needs an internet connection once per API version and key: the first
time a graph renders, it downloads Desmos's calculator.js from desmos.com with
your API key (the Desmos terms don't allow shipping it) and caches it in the
plugin folder. After that it works offline. Nothing else is fetched, and nothing
is sent anywhere.
The API key
Desmos gives away a personal key: sign in at desmos.com/my-api and take the Personal Project plan ($0/month, personal and non-commercial use). Then, in Obsidian, Settings → Community plugins → Live Plots → Desmos API key, and link the key through Obsidian's secret picker.
Obsidian stores secrets per device, so what travels with a synced vault is the NAME of the secret, never the key; each machine that opens the vault is asked for the key once. The plugin then downloads the API with it and caches the file at
<vault>/.obsidian/plugins/live-plots/vendor/desmos-<version>-<fingerprint>.cjs ≈ 4.3 MB
where <fingerprint> is eight hex digits derived from the key — never the key
itself. Vault sync copies that file like any other file in the plugin folder, but
a synced copy is not used until the device it lands on has the key itself: the
file is named after the key it was fetched with, and each reader holds their own
key (Desmos Terms §5.c). Changing the key or the API version downloads again,
into a file of its own; enabling another calculator on an existing key changes
what Desmos serves for the same key, and Download now in the settings is what
fetches it. Delete cached API files removes what has been downloaded.
The version downloaded is v1.12, which is what Desmos issues personal keys
against. v1.9 still works: type it into Settings → Desmos API version and it
is downloaded and cached like any other version.
Writing a block
A block is an optional settings section, ---, then one equation per line.
Modifiers follow an equation after |.
A function that names itself. Nothing asks for the label; p(x)=… draws p(x)
on the curve, typeset, in the curve's colour:
```desmos-graph
left=-3; right=3; top=1.1; bottom=-0.1
---
p(x)=e^{-x^2}
q(x)=\frac{1}{1+x^2} | blue
```
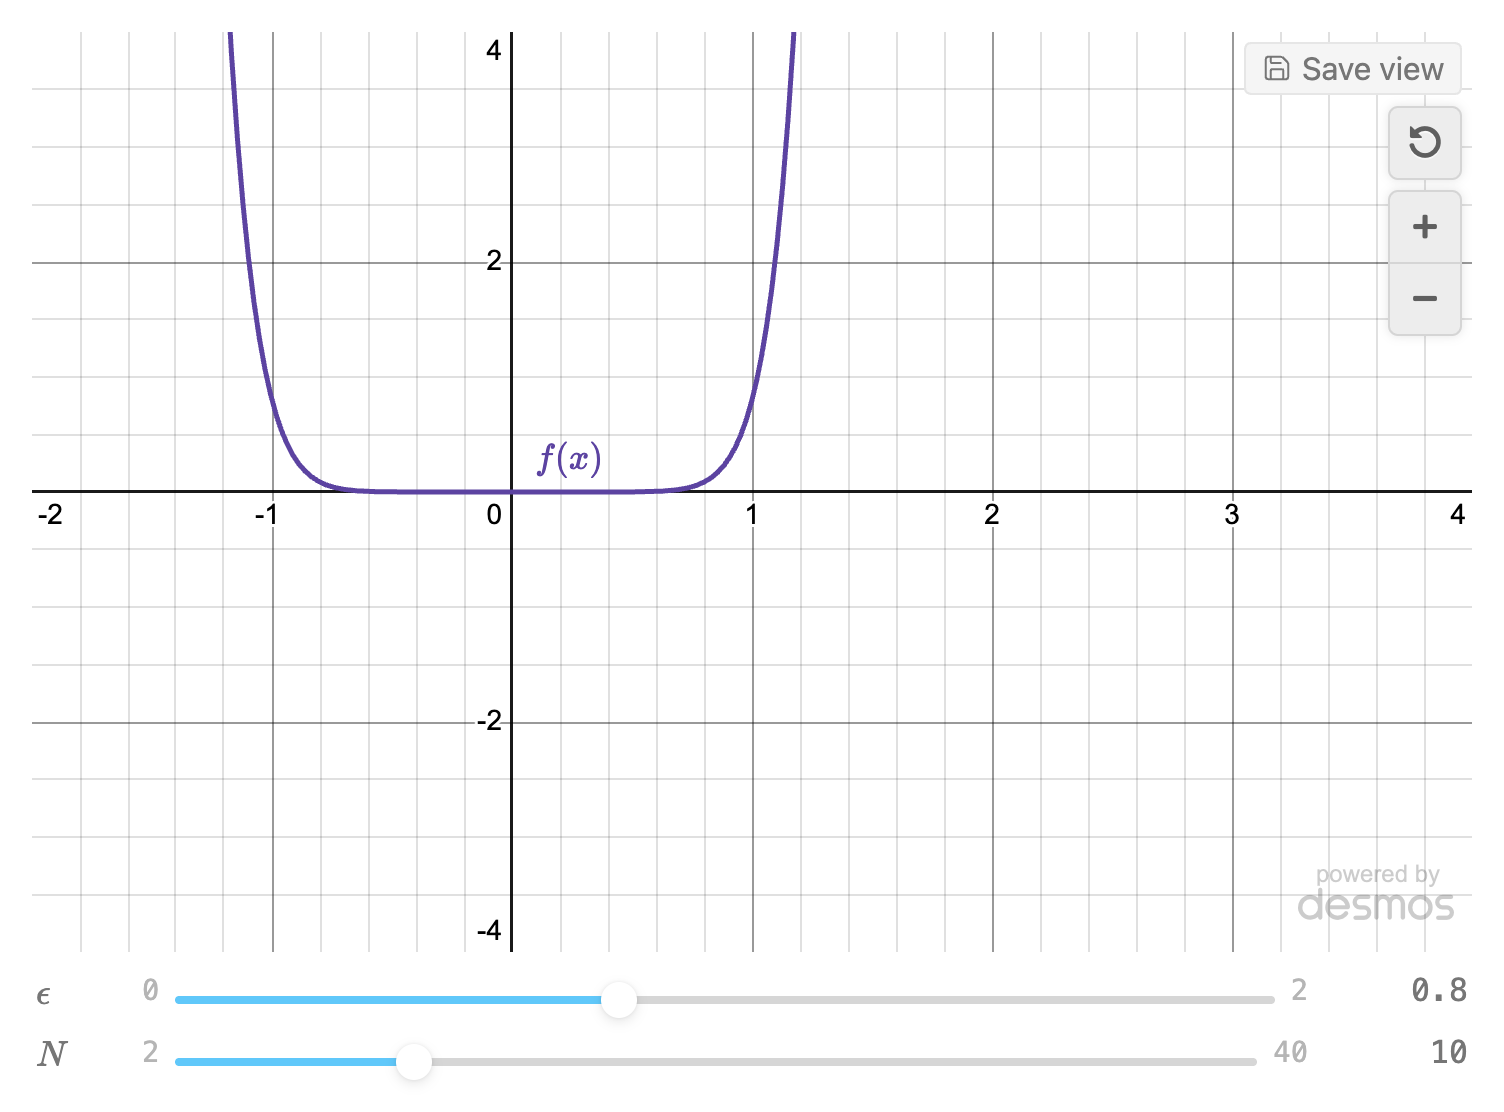
Sliders. Each slider: line gets a control under the graph, and "save view"
writes the number you left it at back into the block:
```desmos-graph
left=-2; right=4; top=4; bottom=-4
---
\epsilon = 0.8 | slider:0..2..0.01
N=10 | slider:2..40..1
f(x)=\epsilon x^N
```
Colours, dashes and a point with a label:
```desmos-graph
left=-4; right=4; top=4; bottom=-4; defaultColor=purple
---
f(x)=x^2 | red | dashed
g(x)=x^3 | #1f77b4 | label:cubic | labelx:1.4
(1,1) | point | label:vertex | labelpos:above
```
Bounds, a fixed size and a hand-written label. Panning and zooming this graph changes nothing on disk until you click Save view on the graph's toolbar (or run the command "Live Plots: Save view to block"), which rewrites exactly the four bounds and the slider literals:
```desmos-graph
id=bessel-fig; left=0; right=20; bottom=-0.5; top=1.1; height=360; width=fill
---
j_0(x)=\frac{\sin x}{x} | blue | label:$j_0(x)$ | labelx:3
```
The settings section takes obsidian-desmos 0.6.8's keys — left right top
bottom grid hideAxisNumbers xAxisLabel yAxisLabel degreeMode
defaultColor and the rest — plus id= (a stable name for the block), height=,
width=fill|<px>, interactive=false, theme=light|dark and labels=auto|off.
Equation modifiers add labelx: labely: labelat:(x,y) labelpos:, width:n,
slider:min..max[..step], restrict:<text> and {<text>}, alongside 0.6.8's
hidden noline dashed dotted solid point open cross label: and
nolabel. desmos works as an alias for the desmos-graph fence.
An unrecognised modifier is an error naming the line and the token, rather than a curve that silently does not plot.
Settings
Desmos API version, Desmos API key, Cached API, Download the Desmos API and Delete cached API files are the key and cache section above.
The rest: Wheel zoom (whether the scroll wheel over a graph zooms it or scrolls the note), Default graph height, Follow the Obsidian theme, Print snapshots (keep a PNG of each graph so printing and Export to PDF show the graph rather than a blank canvas), Labels (the automatic labels, on by default; a block can override either way), Maximum live graphs and Maximum parked graphs and Park timeout (how many calculators stay alive at once, and how long a graph you have navigated away from keeps its zoom), Render desmos-graph blocks (turn off to leave that fence to another plugin), and Debug hooks (for the integration harness).
Not supported
Mobile: isDesktopOnly is true. The plugin loads the Desmos API through Node's
module loader, which the desktop app gives every window and the mobile app gives
none; a window without it gets a message naming the app the plugin needs, and no
download.
3D: Desmos ships a 3D calculator inside the same API file, and this plugin does not use it.
Development
npm install
npm run build         # dist/main.js, dist/manifest.json, dist/styles.css
npm run build:vault   # the same three, straight into a vault's plugin folder
npm run dev           # build:vault in watch mode, with inline sourcemaps
npm test              # node --test over test/**/*.test.ts
npm run typecheck
npm run lint          # see docs/LINT.md
build:vault and dev install into $LP_VAULT/.obsidian/plugins/live-plots/,
where LP_VAULT defaults to a development vault on the author's machine; set it
to your own. Reload the Obsidian window afterwards — a plugin reload is not
enough when the fence changes hands.
A CSS snippet has stable hooks to aim at. Every rendered block is a
div.live-plots, and its parts carry the dl- prefix: dl-graph (the
calculator), dl-sliders with a dl-slider-row each, dl-toolbar, dl-footer,
dl-errors, dl-label for an automatic label, dl-print for the print
snapshot. styles.css is the full list.
The unit tests are pure functions: the grammar against the 0.6.8 parser kept as an
oracle, the loader's whole download path with the I/O faked, the save rewrite, the
label placement. The integration matrix and the label acceptance harness drive a
running Obsidian over the CLI's dev:cdp channel and live in
test/obsidian/.
The contracts are DESIGN.md (§0 binding), LABELS.md and
ARCHITECTURE.md; the spike logs behind them are in
docs/spikes/.
Credits and licence
The block grammar is ported from Nigecat/obsidian-desmos, GPL-3.0, and that project's parser is kept in this repository as a test oracle. See NOTICE.
All the code in this repository was written by Claude: Anthropic's Claude Fable 5.1 designed the plugin, orchestrated the work and reviewed it, with Claude Opus 5 doing most of the building and testing under its direction. Andrea Di Biagio steered, tested each round in his own vault, and took the decisions.
GPL-3.0. Not affiliated with or endorsed by Desmos Studio PBC.